Market Outlook entering the Week of November 1st = Medium-term uptrend
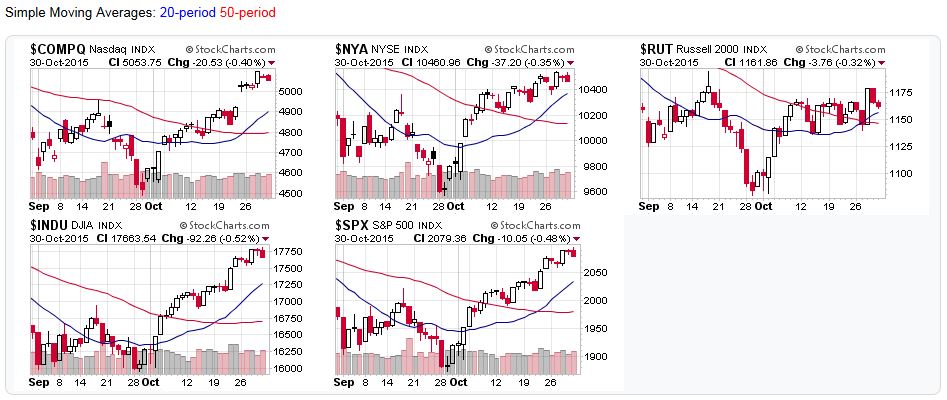
MOVING AVERAGES
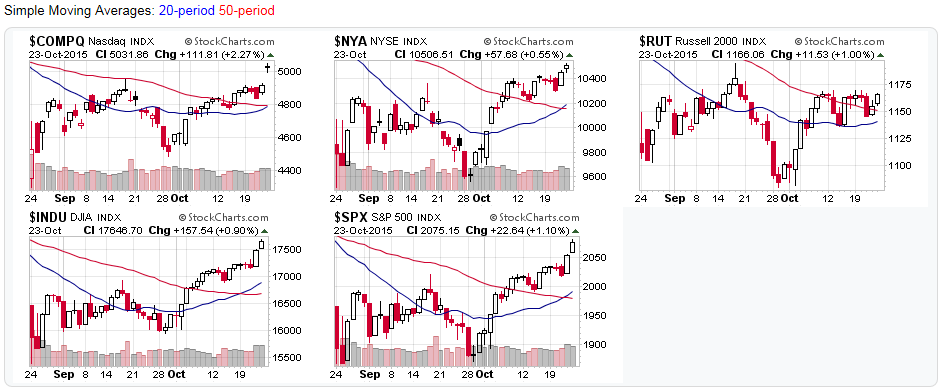
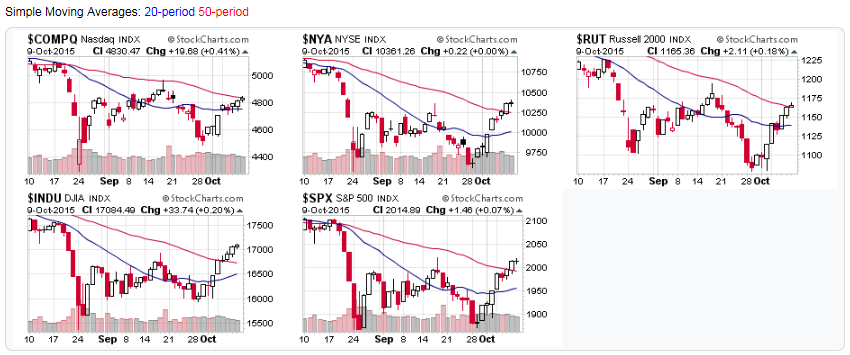
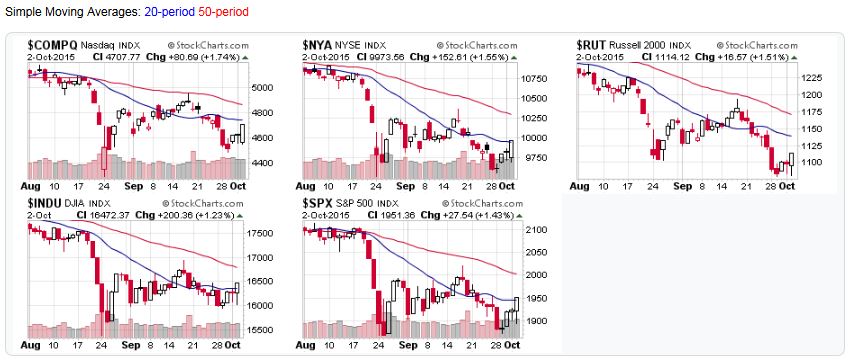
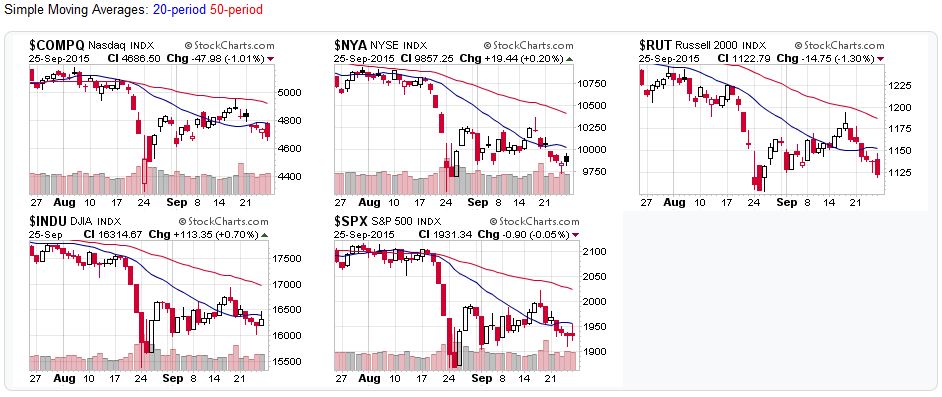
- Short-term (20 DMA): Uptrend
All the major stock market averages remained above their 20-day moving averages.
- Intermediate (50 DMA): Uptrend
All the major stock market averages remained above their 50-day moving averages.
- Long-term (200 DMA): Mixed
3 of the 5 major stock market averages rose above their 200-day moving averages.
COMMENTARY
Several indexes are back above their 200-day moving averages, which adds more credence to the latest uptrend. It remains a good time to do some short-term trading, or make adjustments to your longer term holdings.
2015-11-01 – US Stock Market Averages
For the detailed Elliott Wave Analysis, go to the ELLIOTT WAVE lives on by Tony Caldaro. For price/volume data, head to stockcharts.com.
Moving Average Signals:
- Uptrend=Market indexes remained above their moving average during the trading week
- Downtrend=Market indexes remained below their moving average during the trading week
- Buy signal=Market indexes rose above their moving averages during the trading week
- Sell signal=Market indexes fell below their moving averages during the trading week