Stock Market Outlook: June 28th = Uptrend
Disclosure: The author holds no material positions in the securities mentioned. See Editorial Policy & Disclosures for details. No-Advice Disclaimer: This analysis is for informational purposes only and not a recommendation to buy or sell any security.
The stock market outlook remains in an uptrend, but mixed technicals and ongoing sector rotation make for challenging conditions.
U.S. Bonds, Healthcare, and Low Beta outperformed; Oil, Technology, and Momentum underperformed. A short trading week on tap for U.S. markets, with employment data hitting the wires mid-week.
TREND ANALYSIS
The S&P500 ( $SPX ) dropped 2% last week. The index is:
- ~ at the 50-day moving average
- ~6% above the 200-day moving average
A strange week, with a lower day to day closing all week, but no open to close movement that met distribution day criteria. That said, one heavy sell-off through the 50-day moving average as we’ll get a change in the overall outlook.

SPX Price & Volume Chart – 2026-06-28
PERFORMANCE HIGHLIGHTS & COMPARISONS
Asset Classes
U.S. Bonds ( $IEF) managed to stay green last week, while other asset classes fell. The commodity complex sold off, led by oil ( $USO ). No changes in bias last week.
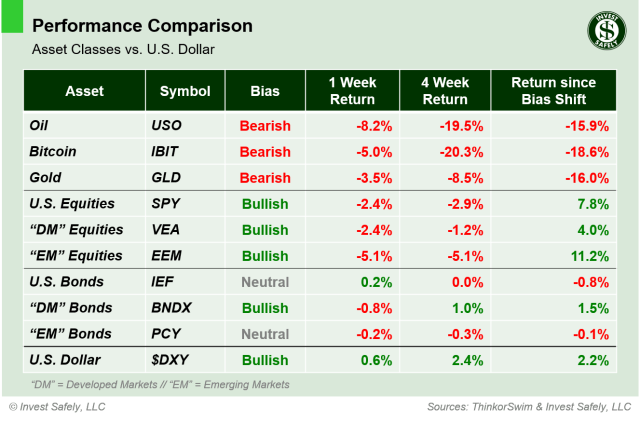
Asset Class Performance – 2026-06-28
S&P500 Sectors
Healthcare ( $XLV ) was the strongest sector by a large margin, and Technology ( $XLK ) gave back almost all of the prior weeks gain. Communications ( $XLC ) broke to bearish bias, while Consumer Staples and Utilities ( $XLP, $XLU ) moved to bullish.

S&P Sector Performance – 2026-06-28
S&P500 Investing Styles
In a reversal from the prior week, Low Beta ( $SPLV ) led to the upside and Momentum ( $MTUM ) led to the downside, reflecting a risk-off posture. Low Beta, High Dividends and Defensives ( $SPLV, $SPHD, $POWA ) bounced back to bullish bias from neutral.

Sector Style Performance – 2026-06-28
COMMENTARY
Markets
Capital flows rotated out of risk-on plays, such as Technology and Momentum, with investors reallocating AI-related gains into more defensive / lower volatility areas of the market like Healthcare, Utilities, and Staples. Commodities have also been on the selling end, with Gold and Oil down significantly since changing bias; a great example of why we avoid adding exposure when the bias is bearish.
Macroeconomic Data & Policy
2026 Q1 GDP accelerated to 2.1%, per the final adjustment. Based on the year over year deltas in GDP and CPI, the U.S. economy experienced accelerated growth with ever-so slightly slowing inflation during the first quarter.
May PCE reached 4.1%, well above last May’s 2.5% level, highlighting the impact of higher energy prices.
Geopolitics
After initial confusion about the U.S-Iran Memorandum of Understanding, a small amount of maritime traffic within the Strait of Hormuz resumed. Unfortunately, tit-for-tat strikes followed quickly, putting the whole ceasefire at risk.
EYES ON THE HORIZON
It’s the start of the summer holidays, which usually means a transition to “slower” trading sessions, in terms of lower volume. We’ll probably see the most activity early in the week, as participants position for employment data releases and a Fed Speech…not to mention the fact that the U.S. market is closed on Friday for Independence Day.
- Monday: —
- Tuesday: JOLTS
- Wednesday: ADP, Fed Speech (Warsh), ISM Manufacturing Survey
- Thursday: NFP
- Friday: US Bank Holiday (Independence Day)
Best to Your Week!
P.S. If you find this research helpful, please tell a friend.
If you don’t, tell an enemy.
Content Sources:
Bloomberg, CNBC, Federal Reserve Bank of St. Louis (FRED), Hedgeye, StockCharts.com,
TradingEconomics.com, U.S. Bureau of Economic Analysis, U.S. Bureau of Labor Statistics.
Performance Methodology:
All sector performance data is sourced from ThinkorSwim and reflects price‑only returns
calculated using end‑of‑week closing data. Bias classifications follow a proprietary
Invest Safely, LLC model and update only when trend conditions meet predefined thresholds.
Disclaimer:
Invest Safely, LLC is an independent investment research and online financial media company.
Use of Invest Safely, LLC and any products available through Invest‑Safely.com is subject to
our Terms of Service and Privacy Policy.
Not a recommendation to buy or sell any security.


