Stock Market Outlook entering the Week of January 11th = Uptrend
- Average Directional Index: Bullish
- Institutional Activity: Bullish
- On-Balance Volume: Bullish
ANALYSIS
The stock market outlook maintains an uptrend, despite geopolitical turmoil and news-driven volatility.
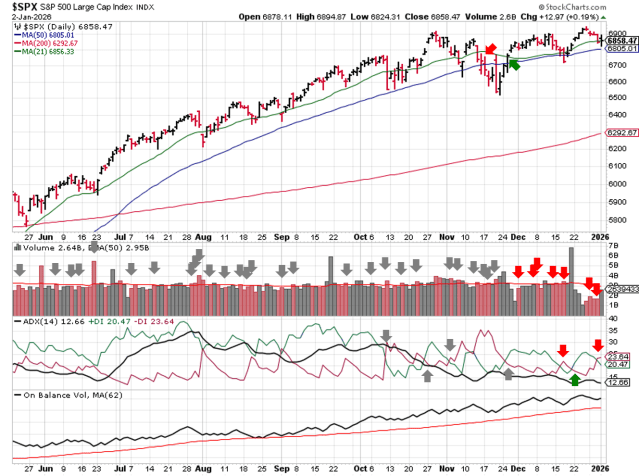
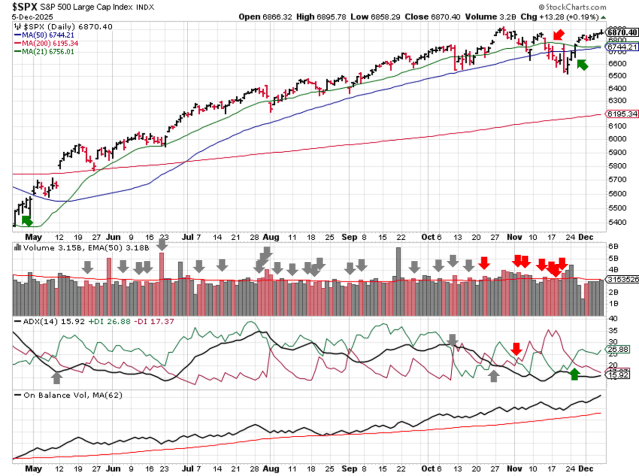
The S&P500 ( $SPX ) rose 1.6% last week. The index sits ~2% above the 50-day moving average and ~10% above the 200-day moving average.
All three technical indicators are bullish to start the week. Price broke out of a recent trading range and the index dropped a few distribution days from the overall count.
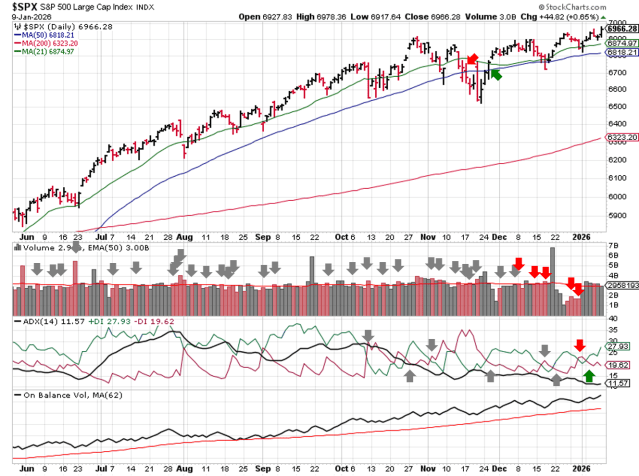
SPX Price & Volume Chart for Jan 11 2026
PERFORMANCE COMPARISONS
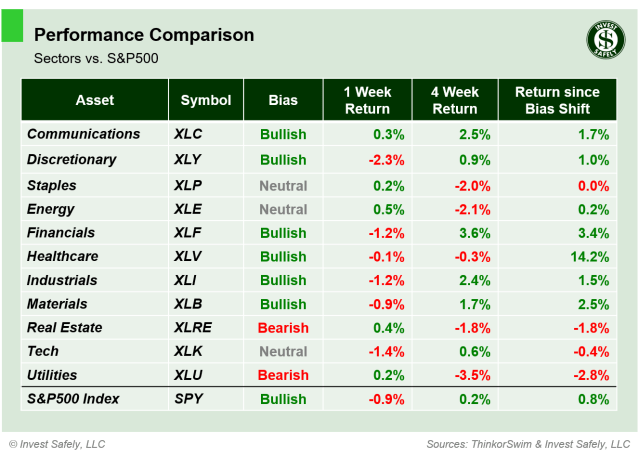
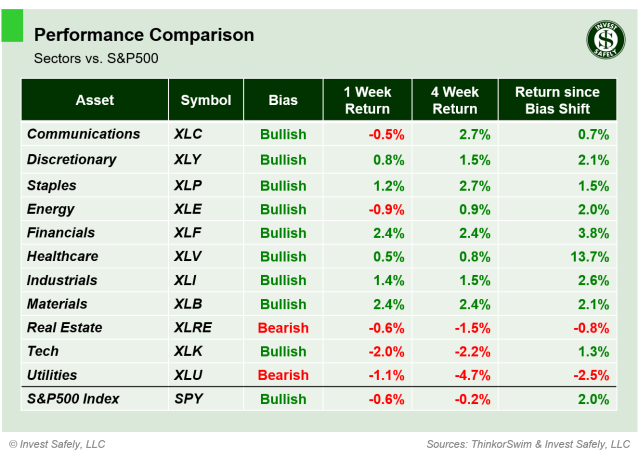
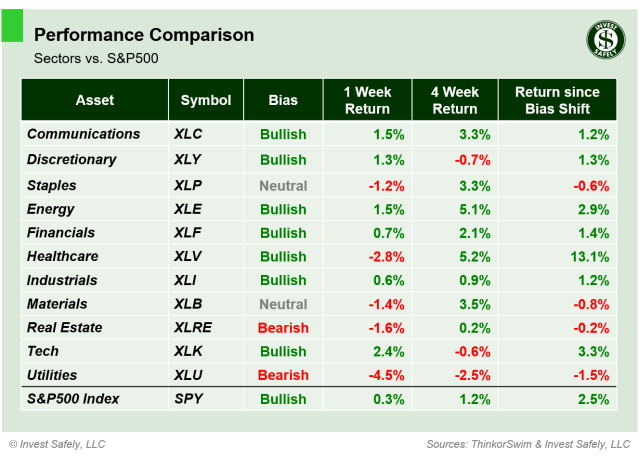
Consumer Discretionary ( $XLY ) outperformed by a wide margin, thought Industrials ( $XLI ) was a close second. Utilities ( $XLU ) underperformed; the only sector in the red. Consumer Discretionary and Consumer Staples ( $XLP ) improved to bullish bias.
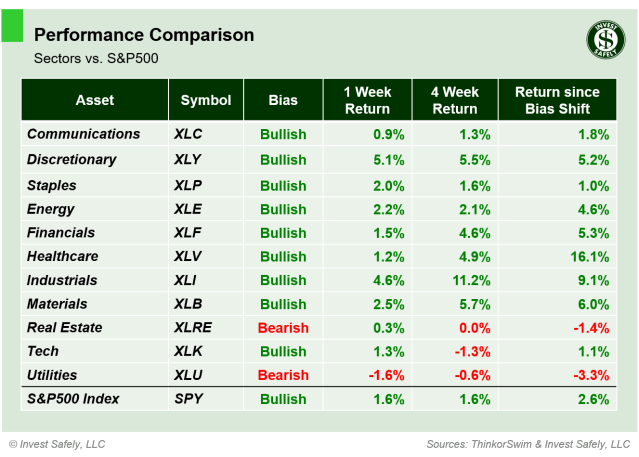
S&P Sector Performance from Week 03 of 2026
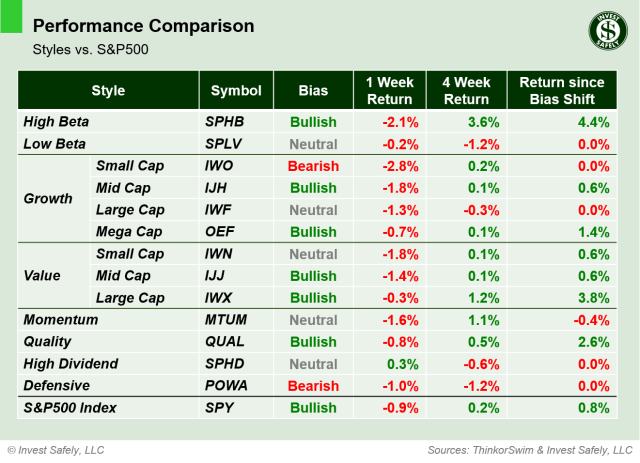
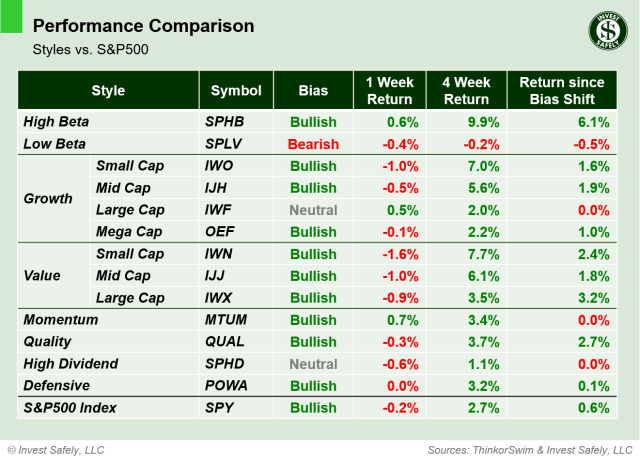
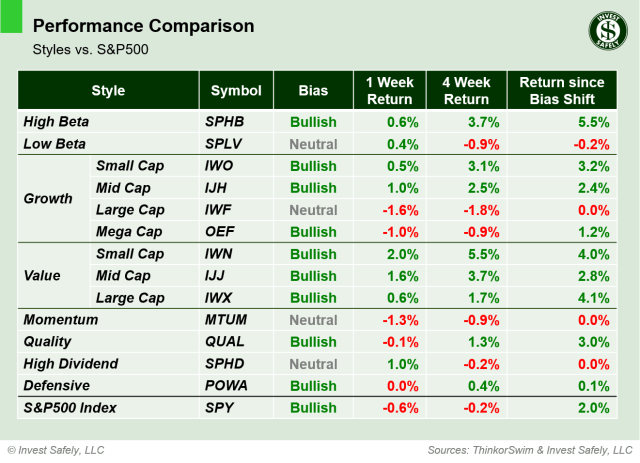
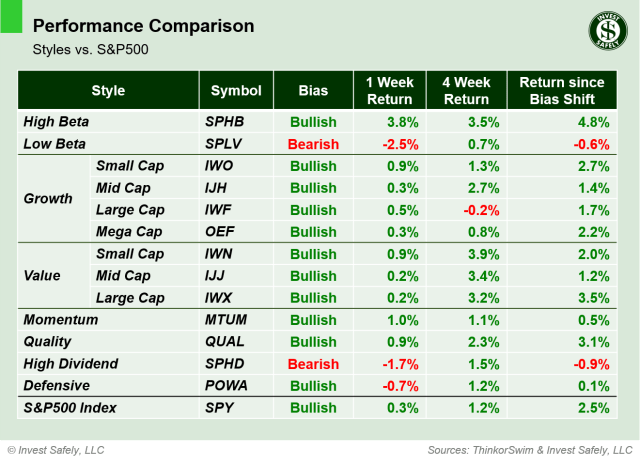
All sector styles made headway last week, but it was Small Cap Value ( $IWN ) leading the charge. Interestingly, the “Value” category ( $IWN, $IJJ, $IWX ) has improved more than all other styles over the past 4 weeks, on a relative basis. High Dividend ( $SPHD ) underperformed. Low Beta ( $SPLV ) moved back to neutral; High Dividend and Defensives ( $POWA ) improved to bullish.
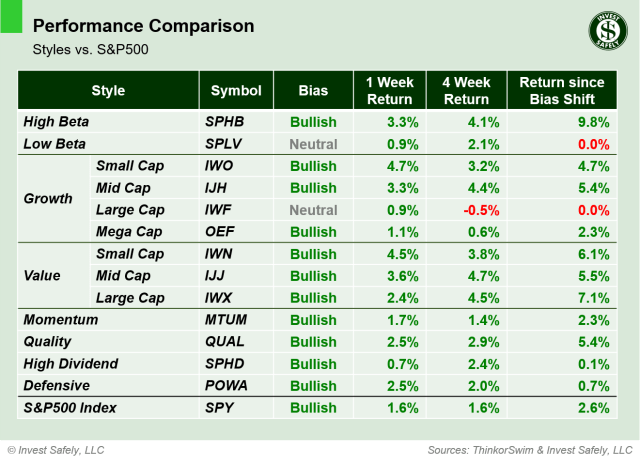
Sector Style Performance from Week 03 of 2026
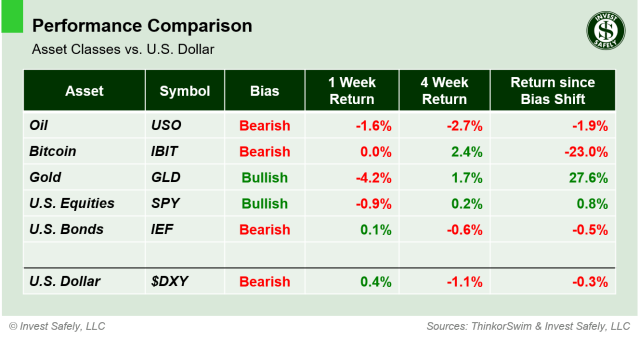
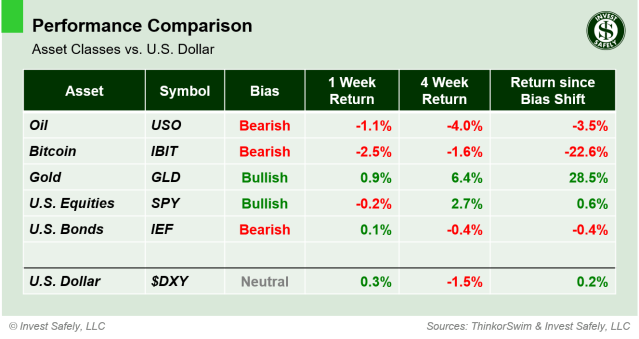
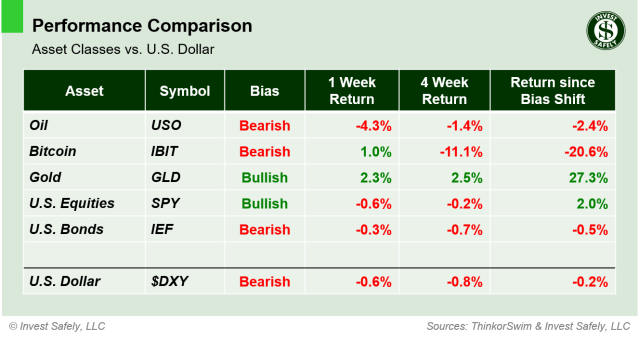
Gold ( $GLD ) returned to the win column last week, leading assets higher. Bonds ( $IEF ) lagged. Oil ( $USO ) moved back to bullish bias after almost 4 months in bearish territory. Time will tell if it’s a retest or a breakout. Bonds and U.S. dollar ( $DXY ) improved to neutral bias as well.
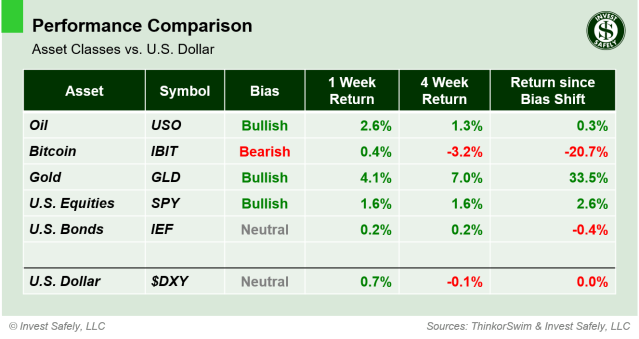
Asset Class Performance from Week 03 2026
COMMENTARY
In addition to geopolitical headlines, policy by social media ramped up again last week, with the U.S. defense sector in the crosshairs. President Trump called out contractors and executives for their high dividends, stock buyback programs, and compensation packages, which sent most of the sector lower midweek. A few hours later, he requested for a $1.5 trillion dollar defense budget for 2027 ( +66% vs. 2026 ), boosting stocks back to where they were.
After market hours on Friday, he declared a one-year ceiling of 10% on credit card interest rates. Expect more news-drive volatility throughout the year, as political parties pander position ahead of mid-term elections.
December ISM Manufacturing PMI was 47.9 in December 2025, falling from November and below forecasts. It’s the 3rd month of declines, and the lowest level since October 2024. Services PMI was 54.4, up from November and above forecasts.
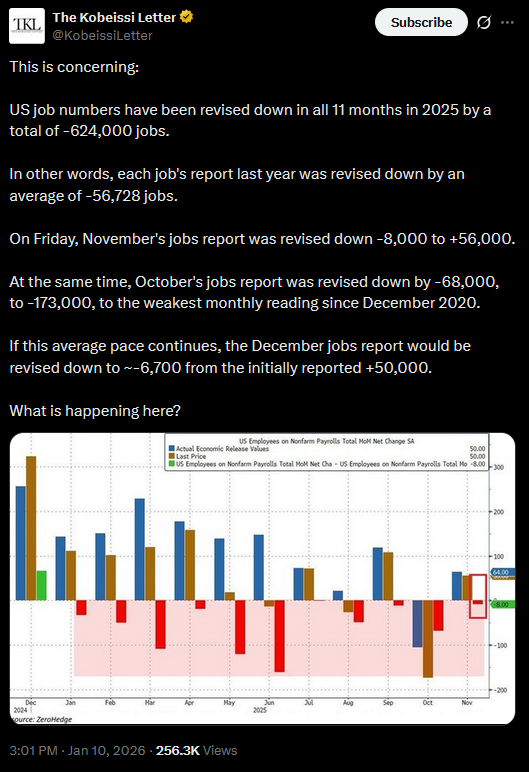
Job openings ( JOLTS ) fell month over month, falling short of expectations and hitting the lowest level since September 2024. December Non-farm Payrolls fell in December, coming in below a downwardly revised November figure, forecasts, and far off last December’s 323k number. The downward revisions hint that employment is weaker than initial reporting suggests, which will influence the FOMC’s next interest rate decision.
This week’s data releases include December CPI and PPI figures, as well as the start of earnings season.

Source: https://x.com/eWhispers/status/2009633514765877736
Best to Your Week!
P.S. If you find this research helpful, please tell a friend.
If you don’t, tell an enemy.