Stock Market Outlook entering the Week of August 7th = Uptrend
-
- ADX Directional Indicators: Uptrend
- Price & Volume Action: Uptrend
- Elliott Wave Analysis: Mixed
ANALYSIS
The stock market outlook enters week 3 of the current uptrend, but failed to make much progress last week.
The S&P500 ($SPX) got caught in highlighted resistance band, sandwiched between the lows of March and the highs of early June. For the week, the index rose 0.4%.

SPX Price & Volume Chart for the Week of August 07 2022
All three signals remain unchanged. The ADX shows strengthening bullish price action, but the overall reading isn’t high enough to say the trend is “strong”/
Price/volume shows an uptrend in place. Trading volumes were below average, but there’s not much in the way of institutional selling either.

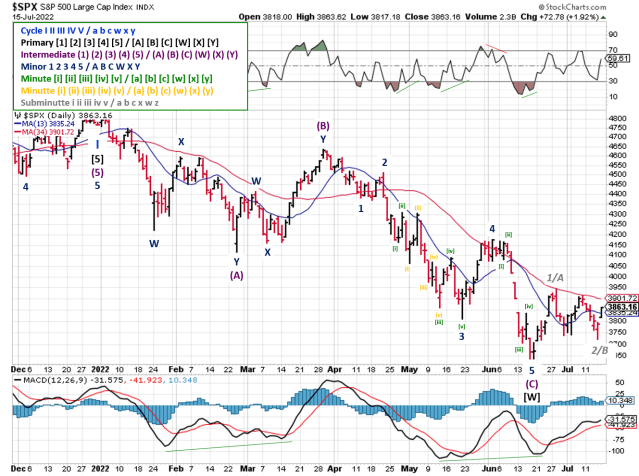
SPX Elliott Wave Analysis for the Week of August 07 2022
Elliott Wave remains mixed. We don’t know if it’s the 5th wave in a bullish count (3rd wave of an uptrend) or a bearish count (completed C-wave). An RSI divergence developed, supporting a completed 5th wave in either case. But the index rose above the target price range for the bearish “flat” pattern. See the end of the post for weekly and monthly views.
COMMENTARY
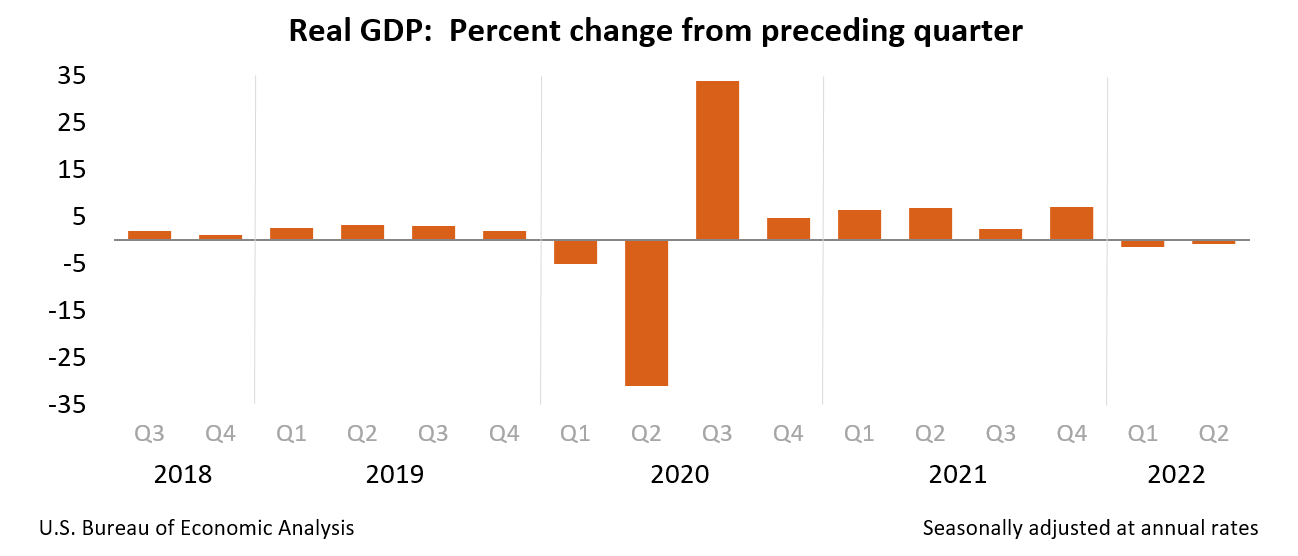
As of Friday morning, 87% of the SP500 had reported earnings; average revenue is up 15% year over year, and earnings are up 9%. Those are better than the aggregate numbers mentioned last weekend, when 50% of the index had reported. The data shows that overall, companies overcame macro headwinds and challenging year-over-year comparisons.

Source: Hedgeye Risk Management
That said, a large portion of the overall improvement came from the energy sector (22 of 23 companies reporting), which averaged a 77% increase in revenue and a 308% increase in earnings! That skews the average a bit, and masks weakness in other sectors of the economy (Financials, Communications, Consumer Discretionary, etc.).
On Friday, we found out that the U.S. economy added 528,000 jobs in August. That’s more than double estimates for and increase of 258,000 jobs, which means we’ve recovered all the jobs lost during COVID-19 shutdowns (in aggregate). That puts the U.S. unemployment rate back to a pre-pandemic level of 3.5%.
From an employment standpoint, that’s great news. Unfortunately, that means the Fed has a green light to continue hiking rates.
Think about it. The Fed’s so-called “dual mandate” is low inflation and full employment. Right now, they’re on a mission to reduce inflation ~9% to 2% as fast as possible with as little as possible unemployment (the “soft landing”). After “big” rate hikes and QT, we see signs that inflation is just starting to ease, but unemployment is at all time lows. To me, that seems like the all clear to continue aggressive rate hikes, not take them off the table.
That would be an issue for all those CNBC narratives saying markets rallied because inflation has peaked and therefore so have interest rate hikes.
Best To Your Week!
P.S. If you find this research helpful, please tell a friend. If you don’t, tell an enemy.
Sources: Bloomberg, CNBC, Hedgeye
P.S.S. Weekly / Monthly Elliott Wave Charts

SPX Elliott Wave Analysis for the Week of August 07 2022
In a weekly view, we see the SPX retracing a bit less than 50% from the January high to the June low. If the March 2020 low was the start of a new bull market (i.e. Cycle III wave, which is not the count shown above), then it’s possible that the 2nd wave correction is complete. I don’t see too many people that bullish on stocks at this point.

SPX Elliott Wave Analysis for the Week of August 07 2022
Going out even further, we see the SPX gained 4151 points from the 2009 market bottom (667) to the 2022 market to (4818), for a gain of 622% (Cycle I wave)! At the June low of 3637, the SPX retraced 28% of the total bull run. As of Friday, the closed at 4145, which is a 16% retracement of the total bull run. Neither of those retracements would satisfy a Cycle II corrective wave, lending support to the view that the bear market isn’t over.