Stock Market Outlook entering the Week of August 21st = Uptrend
-
- ADX Directional Indicators: Uptrend
- Price & Volume Action: Uptrend
- Elliott Wave Analysis: Mixed
ANALYSIS
The stock market outlook uptrend continues into its 5th week, even though the SPX met resistance at a key indicator for technical analysts.
For the week, the S&P500 ($SPX) fell 1.2%, after failing to break through the 200-day moving average on Tuesday.

SPX Price & Volume Chart for the Week of August 21 2022
The ADX remains bullish and price/volume actions shows the index above the 50-day moving average with a low number of distribution days. The trend of lower trading volume continues.

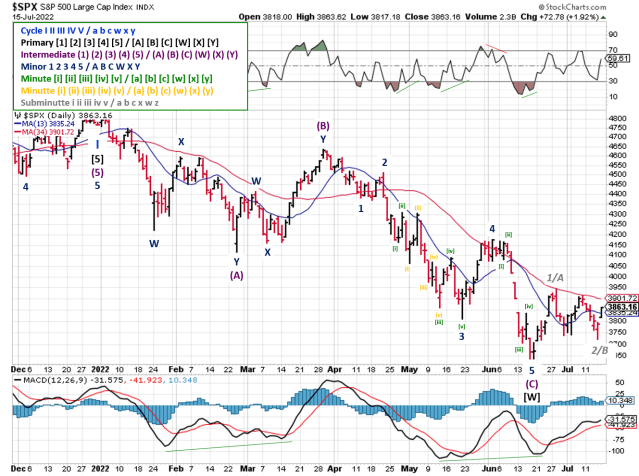
SPX Elliott Wave Analysis for the Week of August 21 2022
Elliott Wave is unchanged from last week, other than the fact that the index moved from an up-wave to a down-wave. If the rally is complete (Wave C complete), Tuesday’s high was the top. If the rally isn’t over (Wave 3 complete), the index could drop as far as the late June high (~3950) before heading higher again.
COMMENTARY
Fed minutes were released last week, but amounted to a nothing burger. Some market participants reacted were surprised by the hawkish tone. But those were the same people that assumed the words “neutral rate” meant the Fed was pivoting to rate cuts. Look for more slicing and dicing of Fed comments coming out of the Jackson Hole Economic Symposium this week.
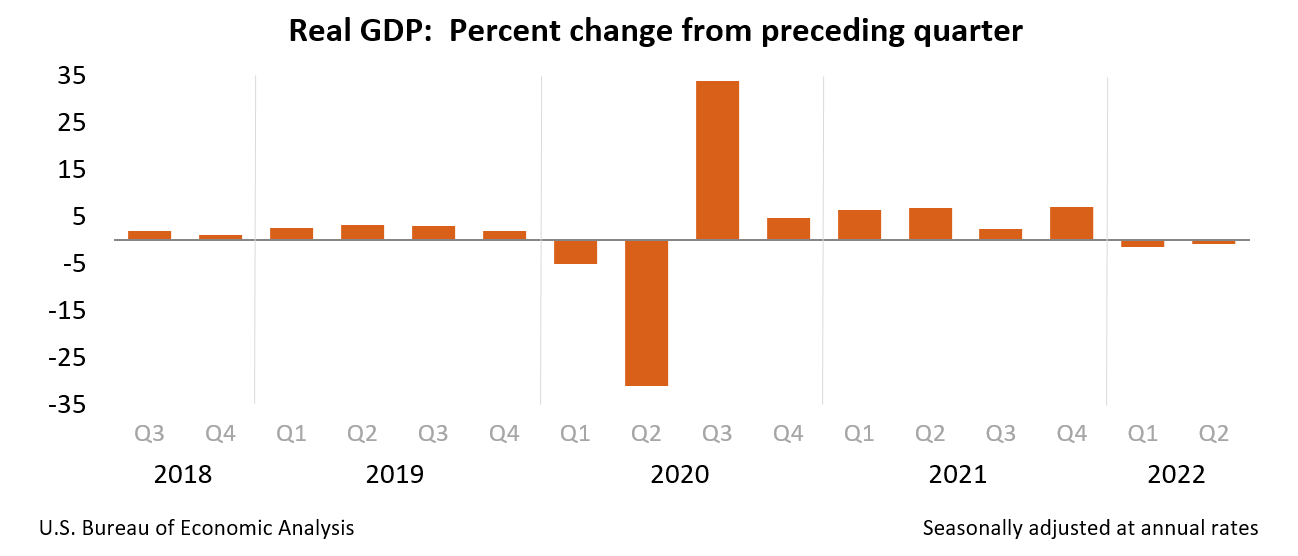
The retail sales report hit the wires too. Overall spending in July remained unchanged from June, similar to the CPI report 2 weeks ago. Housing data showed declines in the residential market (housing starts, permits, and mortgage applications), which supports recession narratives.
Friday’s weekly & option expiration covered ~$2.1 trillion, which would be a lot for a quarterly expiration date, let alone a monthly one like August. Then again, maybe it’s not surprising. If you’ve been watching stocks with high levels of short-interest, you know people are still gambling on short squeezes ($BBBY or $WEBR anyone?). Goldman Sach’s “Most Short Basket” of stocks was up a whopping +21% in the first two weeks of August alone!
I expect trading volume to pick up over the next few weeks as summer holiday’s come to a close and institutional trading desks get back to work. Quantitative tightening, rate hikes, and poor hedge fund performance will make for a challenging trading environment over the next few weeks, not to mention Q4.
The volatility index for the SPX ($VIX) is trading just above 20, after bottoming out around 19 last week. A $VIX reading between 20 and 30 is called the “chop” bucket by risk-management firm Hedgeye, because price action is uneven or “choppy” between those levels, leading to traders getting chopped up.
Back in late March & early April, the VIX was near a similar level, and the SPX took ~2.5 weeks of that back-and-forth market action to drop 5% (local high point to the 50-day moving average). With SPX is currently ~6.5% above the 50-day, there’s a high probability we see a choppy sell-off over the next few weeks…without any change the signals shift to a downtrend.
Best To Your Week!
P.S. If you find this research helpful, please tell a friend. If you don’t, tell an enemy.