Weekend Market Outlook

Market Outlook entering the Week of July 12th = Mixed

MOVING AVERAGES

  • Short-term (20 DMA): Downtrend
    All of the major stock market averages remained below their 20-day moving averages.
  • Intermediate (50 DMA): Downtrend
    All the major stock market averages remained below their 50-day moving averages.
  • Long-term (200 DMA): Uptrend
    4 of the 5 major stock market averages closed above their 200-day moving averages.  The NYSE remained below, while the S&P500 and DJIA were able to recover before the end of the week.

COMMENTARY
A lot of volatility in the US markets last week, although nothing as dramatic as the 5%+ moves in Chinese equities.  Nothing a little “ban” won’t help; as in banning sales by major stock holders! (Bloomberg).  Couple that with news that Greece submitted another bailout proposal, and we’re back to where we started last week’s market outlook.

Trading volumes remained subdued, both on the downside AND the upside, so price-volume action continues to indicate we’re in an uptrend that’s encountering selling pressure.

Intermediate support/resistance levels from Objective Elliott Wave analysis remain unchanged from last week:

  • Resistance:  2,185/ 2,131
  • Support:  2,019 / 2,070

This “correction” has been pretty minor (~4% for the S&P), and the Put/Call ratio has already spiked to it’s highest level in months (a contrarian indicator).  With Europe’s quantitative easing still going strong, and Chinese brokers adding liquidity, odds are this latest round of selling won’t be the one to sink the market.

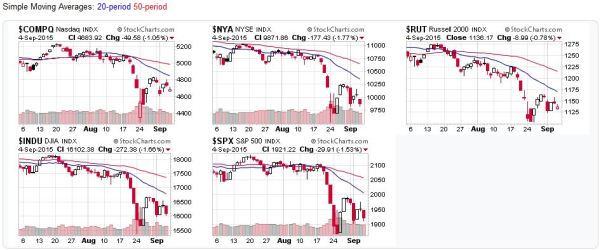
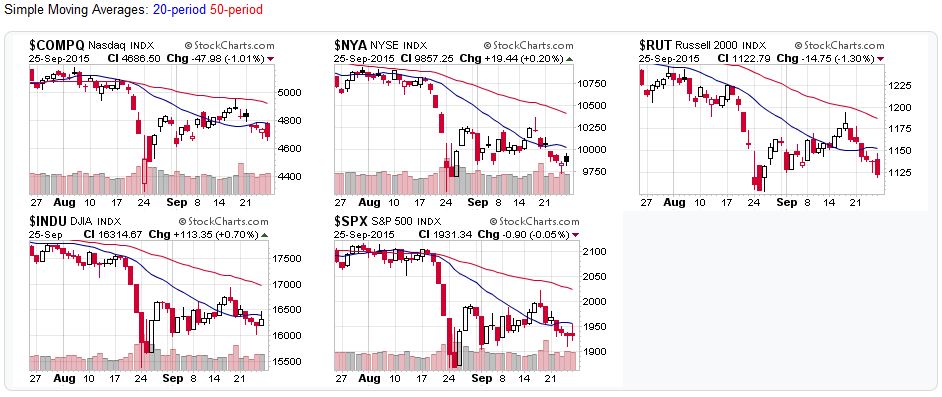
2015-07-12 - US Stock Market Averages

2015-07-12 – US Stock Market Averages


Sources:

For the detailed Elliott Wave Analysis, go to the ELLIOTT WAVE lives on by Tony Caldaro.  For price/volume data, head to stockcharts.com.

Moving Average Signals:

  • Uptrend=Market indexes remained above their moving average during the trading week
  • Downtrend=Market indexes remained below their moving average during the trading week
  • Buy signal=Market indexes fell below their moving averages during the trading week

  • Sell signal=Market indexes rose above their moving averages during the trading week
Posted in Historical Data, Market Trends, Other Blogs | Tagged , , , , , | Comments Off on Weekend Market Outlook

Weekend Reading – Personal Finance, Money Management, and Investing

Personal Finance

Money Management

Investing

  • Income Investing – The Most Important Rule (DGI)
  • Growth Investing – More about the 200 DMA (Ryan Detrick)

Odds and Ends

  • Crazy Wankel Engine (R&T)

Posted in Investing, Money Management, Personal Finance | Tagged , , , , | Comments Off on Weekend Reading – Personal Finance, Money Management, and Investing

Weekend Market Outlook – Independence Day Edition

Market Outlook entering the Week of July 5th = Mixed

MOVING AVERAGES

  • Short-term (20 DMA): Downtrend
    All of the major stock market averages fell or remained below their 20-day moving averages.
  • Intermediate (50 DMA): Downtrend
    All the major stock market averages fell or remained below their 50-day moving averages.
  • Long-term (200 DMA): Uptrend
    4 of the 5 major stock market averages remained above their 200-day moving averages.  The NYSE closed below, and the DJIA was able to recover before the end of the week.

COMMENTARY
News that Greece would miss their June 30th repayment deadline was enough to sink the market averages last week.  Coupled with a shortened trading week and lower volumes from the U.S. July 4th holiday, any recovery would be weak at best.

Again, the market is sending mixed messages.  With subdued volume, the price-volume action continues to show selling pressure, but not an outright correction.

After 10 straight weeks of sideways movement, the intermediate support/resistance levels from Objective Elliott Wave analysis finally dropped a notch.

  • Resistance:  2,185/ 2,131
  • Support:  2,019 / 2,070

Global markets will remain the focus over the next few weeks.  Greeks go to the polls on Sunday to vote on accepting the terms of the international bailout, and those results are sure to have an impact on the markets next week.  Just as troubling but less reported, the Shanghai Composite has lost 24% since June 12, and the Shenzhen Composite is down roughly 30% in the same period, meaning more pressure on US equities.

Best of luck!

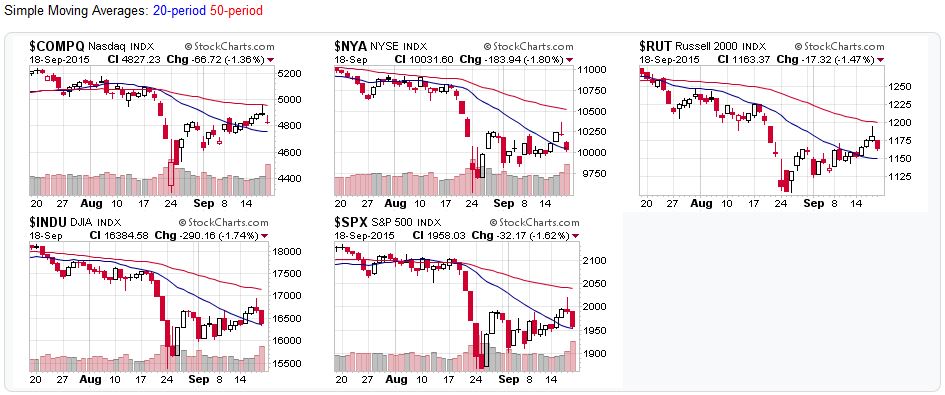
2015-07-05 - US Stock Market Averages

2015-07-05 – US Stock Market Averages

Sources:

For the detailed Elliott Wave Analysis, go to the ELLIOTT WAVE lives on by Tony Caldaro.  For price/volume data, head to stockcharts.com.

Moving Average Signals:

  • Uptrend=Market indexes remained above their moving average during the trading week
  • Downtrend=Market indexes remained below their moving average during the trading week
  • Buy signal=Market indexes fell below their moving averages during the trading week
  • Sell signal=Market indexes rose above their moving averages during the trading week
Posted in Historical Data, Market Trends, Other Blogs | Tagged , , , , , | Comments Off on Weekend Market Outlook – Independence Day Edition

Weekend Reading – Independence Day Edition – Personal Finance, Money Management, and Investing

Personal Finance

Money Management

Investing

  • Income Investing – The One Buffett Lesson No One Wants to Hear (DGI)
  • Growth Investing – The 200 day moving average is nothing special (Price Action Lab)

Odds and Ends

  • American Thunder for Independence Day (YouTube)


Posted in Investing, Money Management, Personal Finance | Tagged , , , , | Comments Off on Weekend Reading – Independence Day Edition – Personal Finance, Money Management, and Investing

Weekend Market Outlook

Market Outlook entering the Week of June 28th = Mixed

MOVING AVERAGES

  • Short-term (20 DMA): Sell Signal
    3 of the 5 major stock market averages fell below their 20-day moving averages.
  • Intermediate (50 DMA): Sell Signal
    3 of 5 major stock market averages fell below their 50-day moving averages.
  • Long-term (200 DMA): Uptrend
    All the major stock market averages remained above their 200-day moving averages

COMMENTARY
Retreat was the name of the game last week, as market prices headed south.  If you were on the lookout for high volume selling, you weren’t disappointed.  That, along with some index re-balancing, was enough to shift the market outlook.

However, the intermediate support/resistance levels from Objective Elliott Wave analysis remain unchanged for a 10th straight week.

  • Resistance:  2,131/ 2,198
  • Support:  2,070 / 2,085

The Greek financial assistance package runs out on Tuesday.  Will the markets be able to shrug it off?

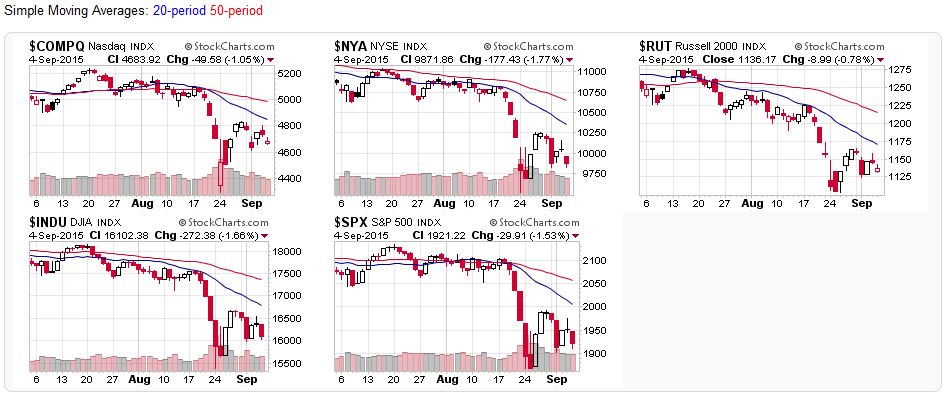
2015-06-28 - US Stock Market Averages

2015-06-28 – US Stock Market Averages

Sources:

For the detailed Elliott Wave Analysis, go to the ELLIOTT WAVE lives on by Tony Caldaro.  For price/volume data, head to stockcharts.com.

Moving Average Signals:

  • Uptrend=Market indexes remained above their moving average during the trading week
  • Downtrend=Market indexes remained below their moving average during the trading week
  • Buy signal=Market indexes fell below their moving averages during the trading week
  • Sell signal=Market indexes rose above their moving averages during the trading week
Posted in Historical Data, Market Trends, Other Blogs | Tagged , , , , , | Comments Off on Weekend Market Outlook

Weekend Reading – Personal Finance, Money Management, and Investing

Personal Finance

Money Management

Investing

  • Income Investing – Dividend Stock Analysis – Walmart – WMT (DGI)
  • Growth Investing – All trading programs eventually go boom (Zero Hedge)

Odds and Ends

  • World’s First 3-D Printer Supercar (Yahoo)
Silver Blade - World’s First 3D-Printed Supercar

Divergent Microfactories – The Blade


Posted in Investing, Money Management, Personal Finance | Tagged , , , , | Comments Off on Weekend Reading – Personal Finance, Money Management, and Investing

Weekend Market Outlook

Market Outlook entering the Week of June 21st = Uptrend

MOVING AVERAGES

  • Short-term (20 DMA): Uptrend 
    All the major stock market averages rose above their 20-day moving averages.  Only the NYSE remained below this level as of Friday’s close.
  • Intermediate (50 DMA): Uptrend
    4 of 5 major stock market averages rose above their 50-day moving averages. Only the NYSE and DJIA remained below this level as of Friday’s close.
  • Long-term (200 DMA): Uptrend
    All the major stock market averages remained above their 200-day moving averages

COMMENTARY
Just like last week, market prices recovered nicely through Thursday, but Friday’s sell off sent the indexes back towards their moving averages (20/50 DMA).

Unlike last week, price-volume continues to indicate an uptrend and Friday’s sell off had really heavy volume.  The number of high volume selling days is high for such a young rally.

Intermediate support/resistance levels from Objective Elliott Wave analysis remain unchanged for an 9th straight week.

  • Resistance:  2,131/ 2,198
  • Support:  2,070 / 2,085

All signs point to an uptrend, so the market outlook shifted.  But be on the lookout for high volume selling.

2015-06-21 - US Stock Market Averages

2015-06-21 – US Stock Market Averages

Sources:

For the detailed Elliott Wave Analysis, go to the ELLIOTT WAVE lives on by Tony Caldaro.  For price/volume data, head to stockcharts.com.

Moving Average Signals:

  • Uptrend=Market indexes remained above their moving average during the trading week
  • Downtrend=Market indexes remained below their moving average during the trading week
  • Buy signal=Market indexes fell below their moving averages during the trading week
  • Sell signal=Market indexes rose above their moving averages during the trading week
Posted in Historical Data, Market Trends, Other Blogs | Tagged , , , , , | Comments Off on Weekend Market Outlook