Stock Market Outlook entering the Week of October 18th = Uptrend
-
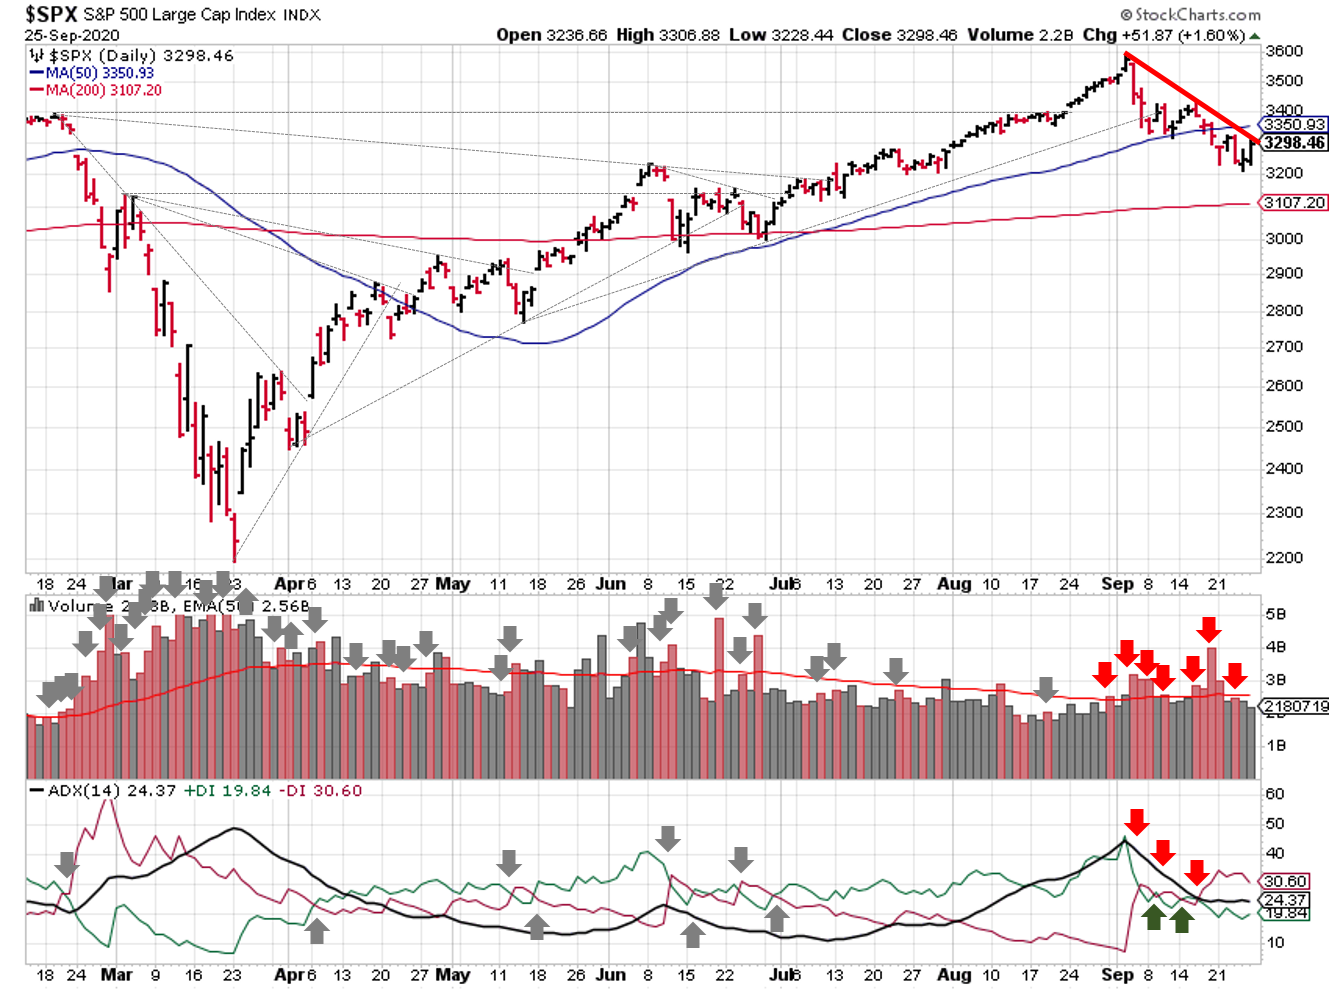
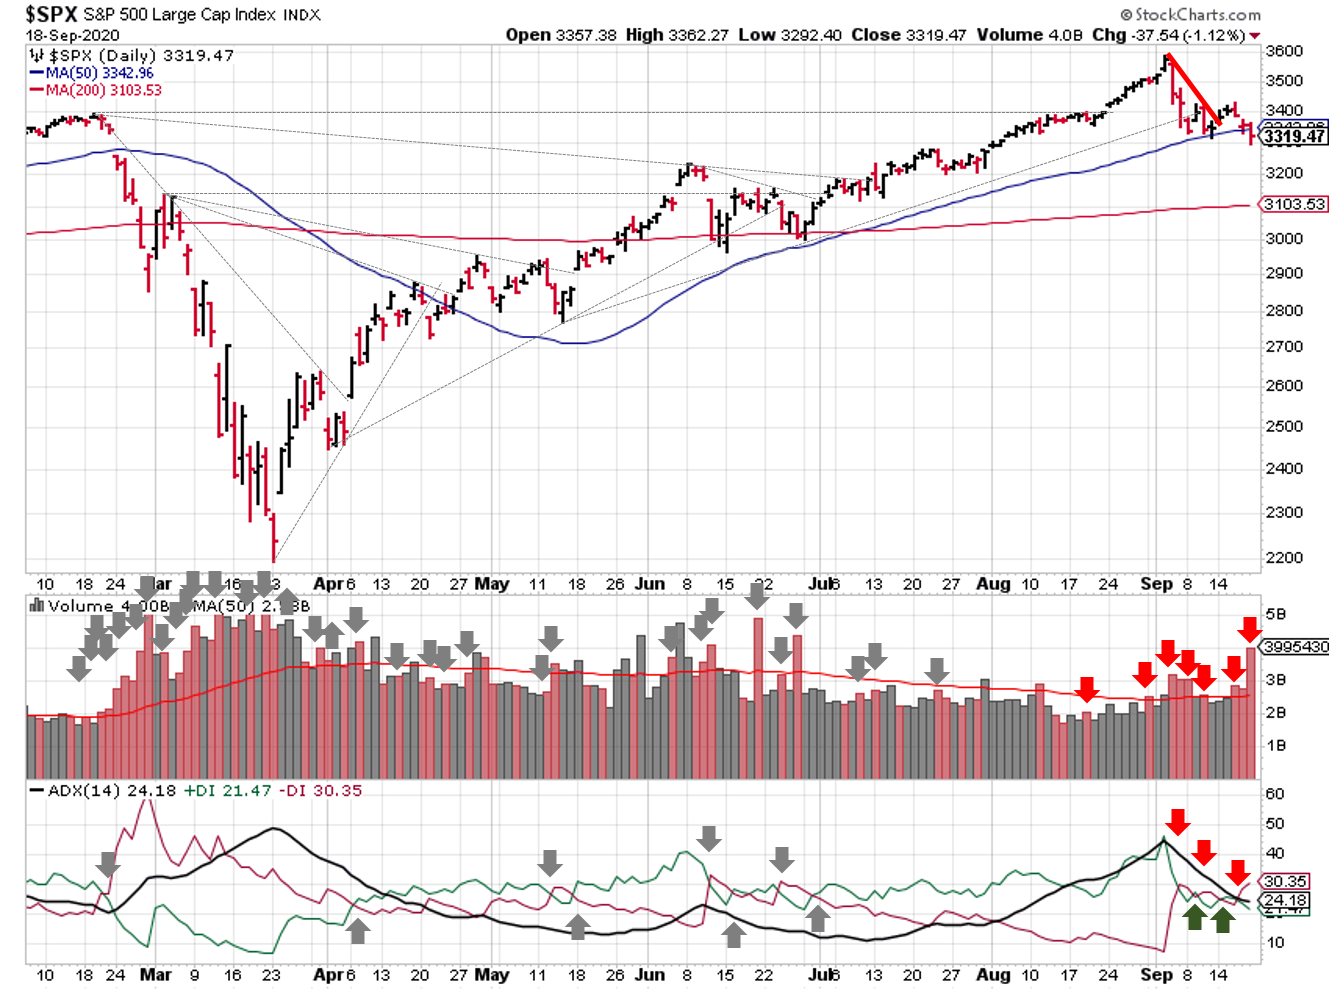
- ADX Directional Indicators: Uptrend
- Price & Volume Action: Uptrend
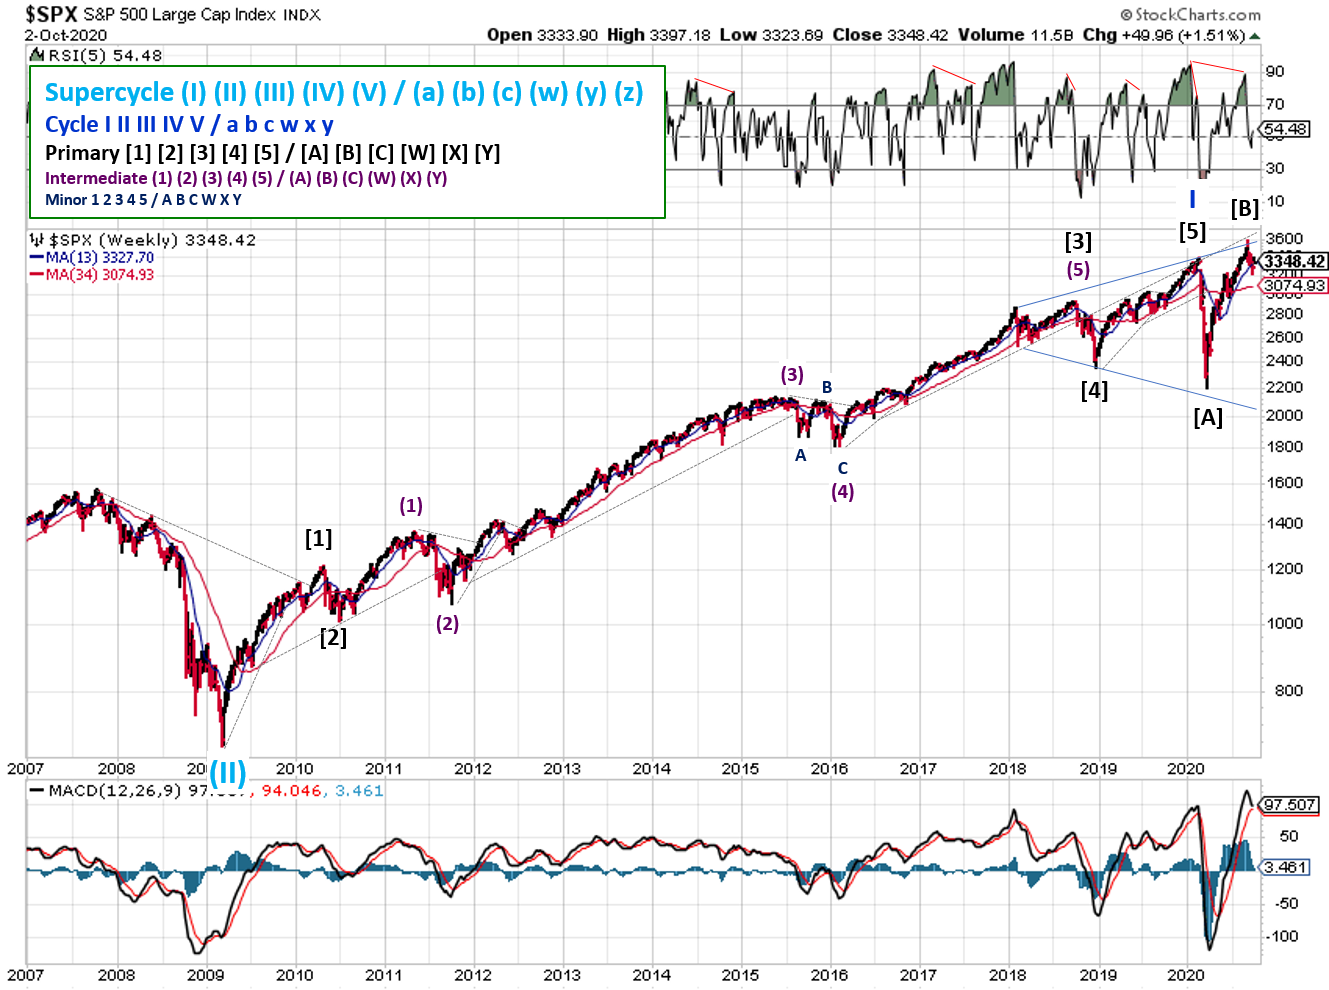
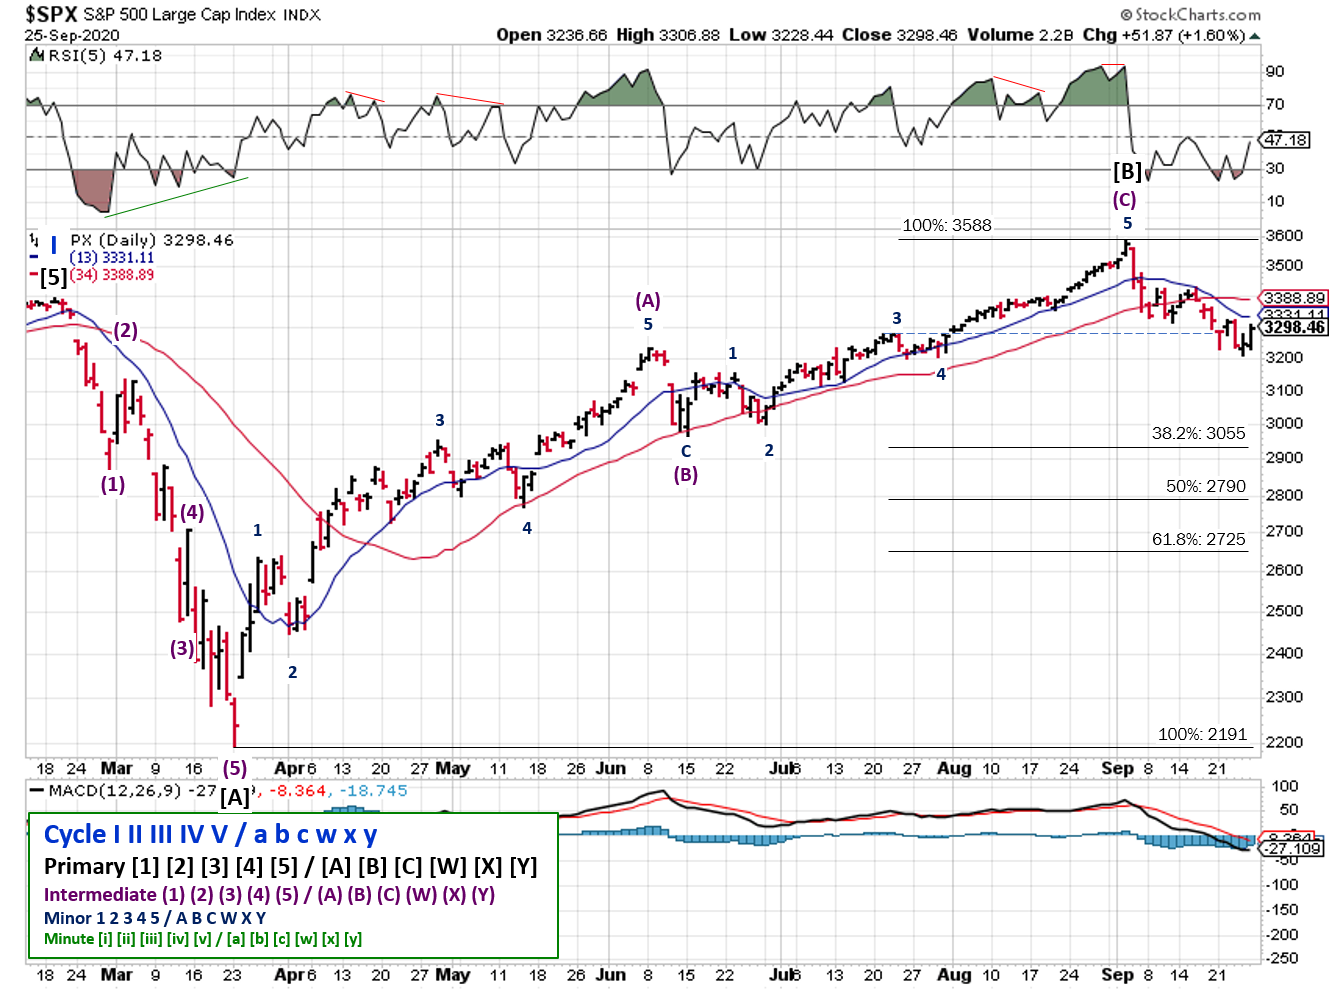
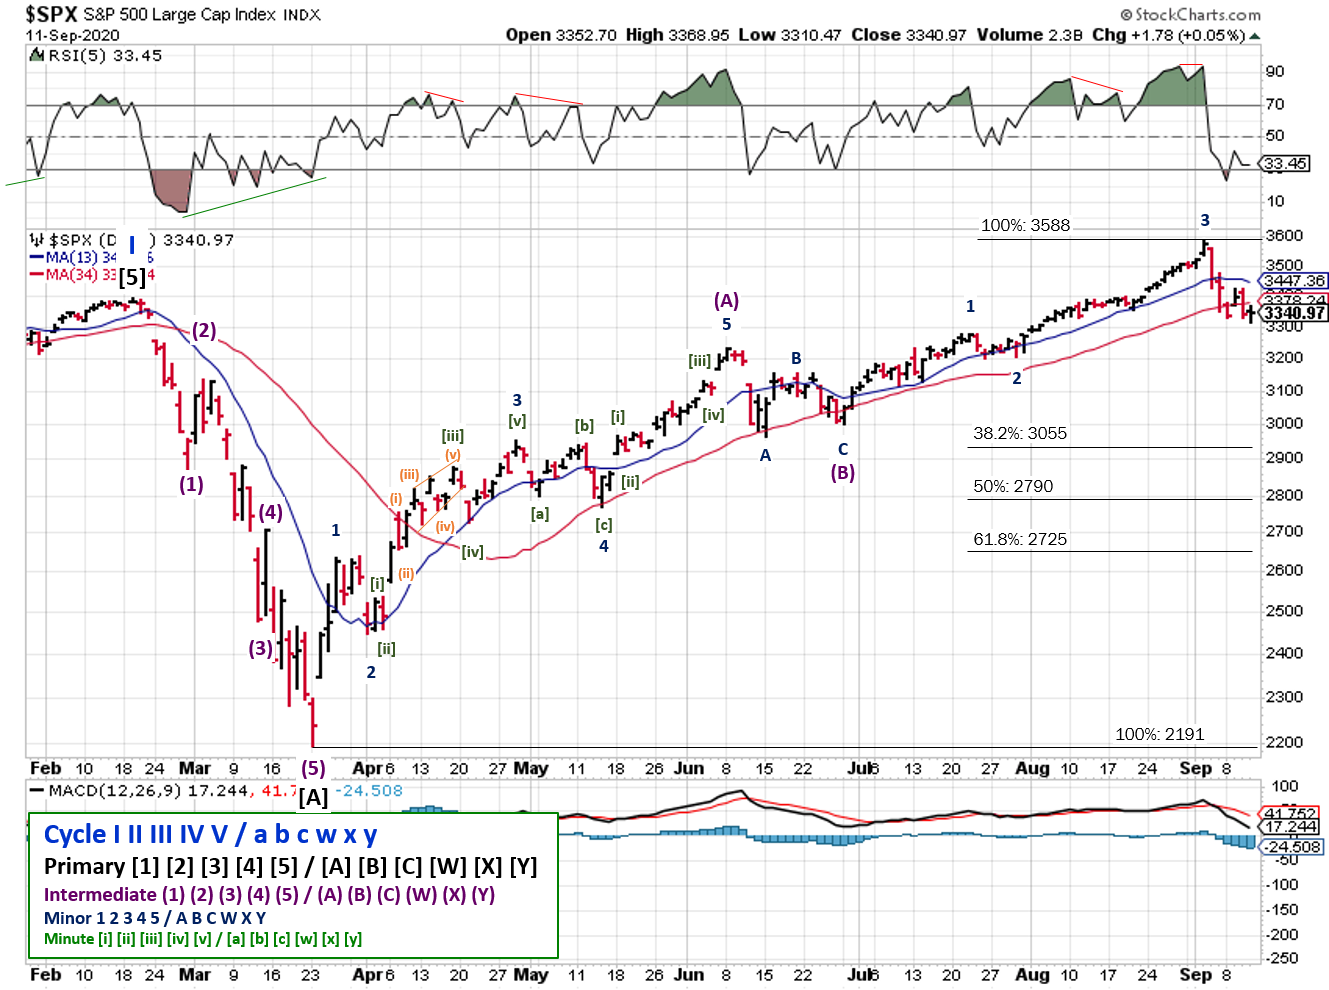
- Elliott Wave Analysis: Uptrend
ANALYSIS
The stock market outlook remains in an uptrend to start this week.
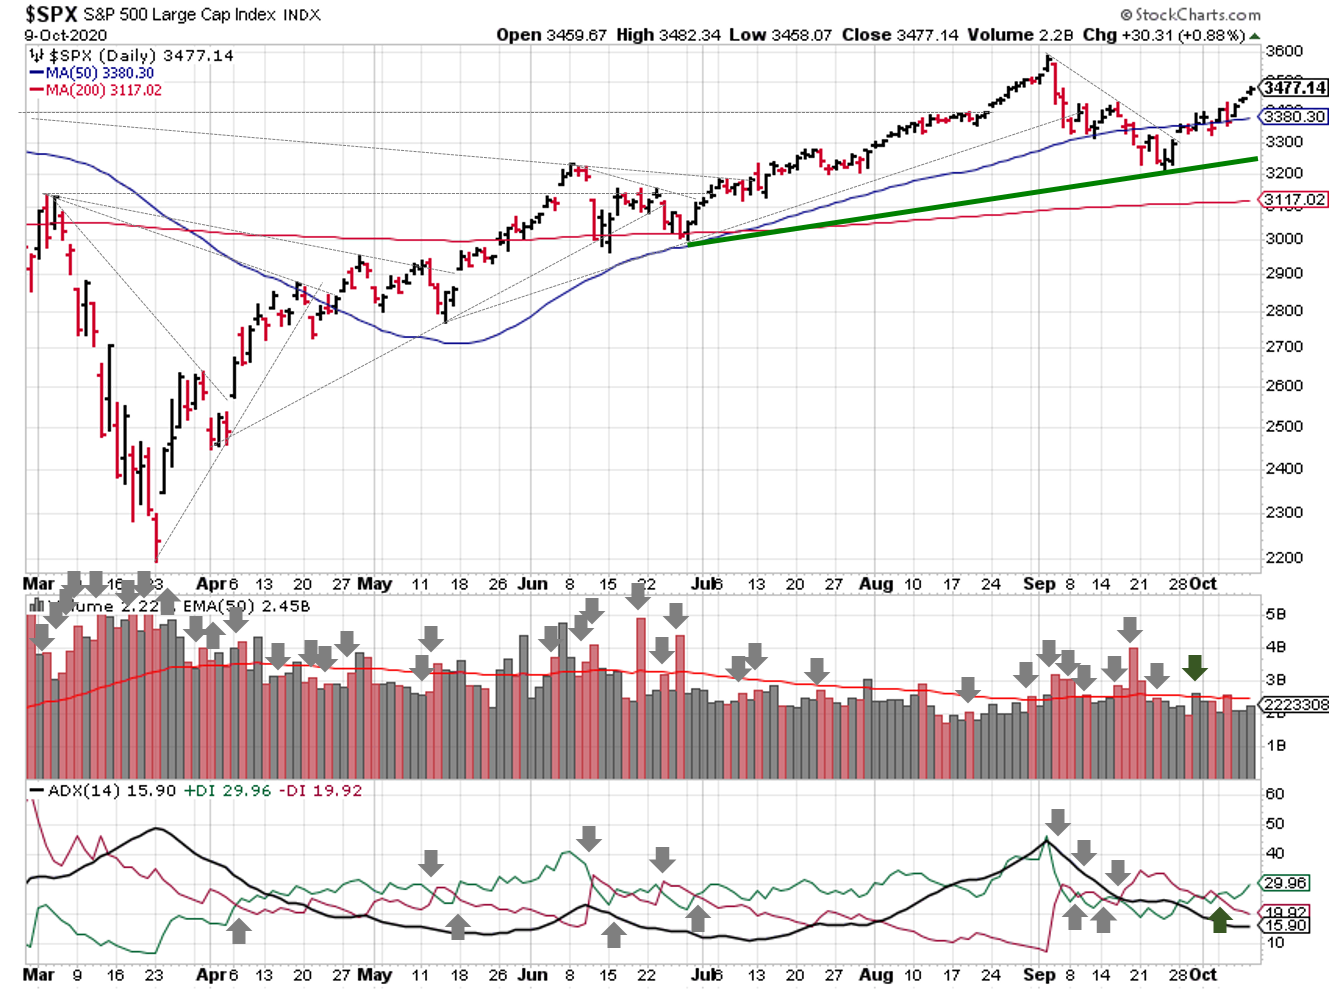
The S&P500 ($SPX) took a a break last week, finding support at the 13 day moving average. That said, price sits ~10% above the 200-day moving average, so we’re getting extended again.
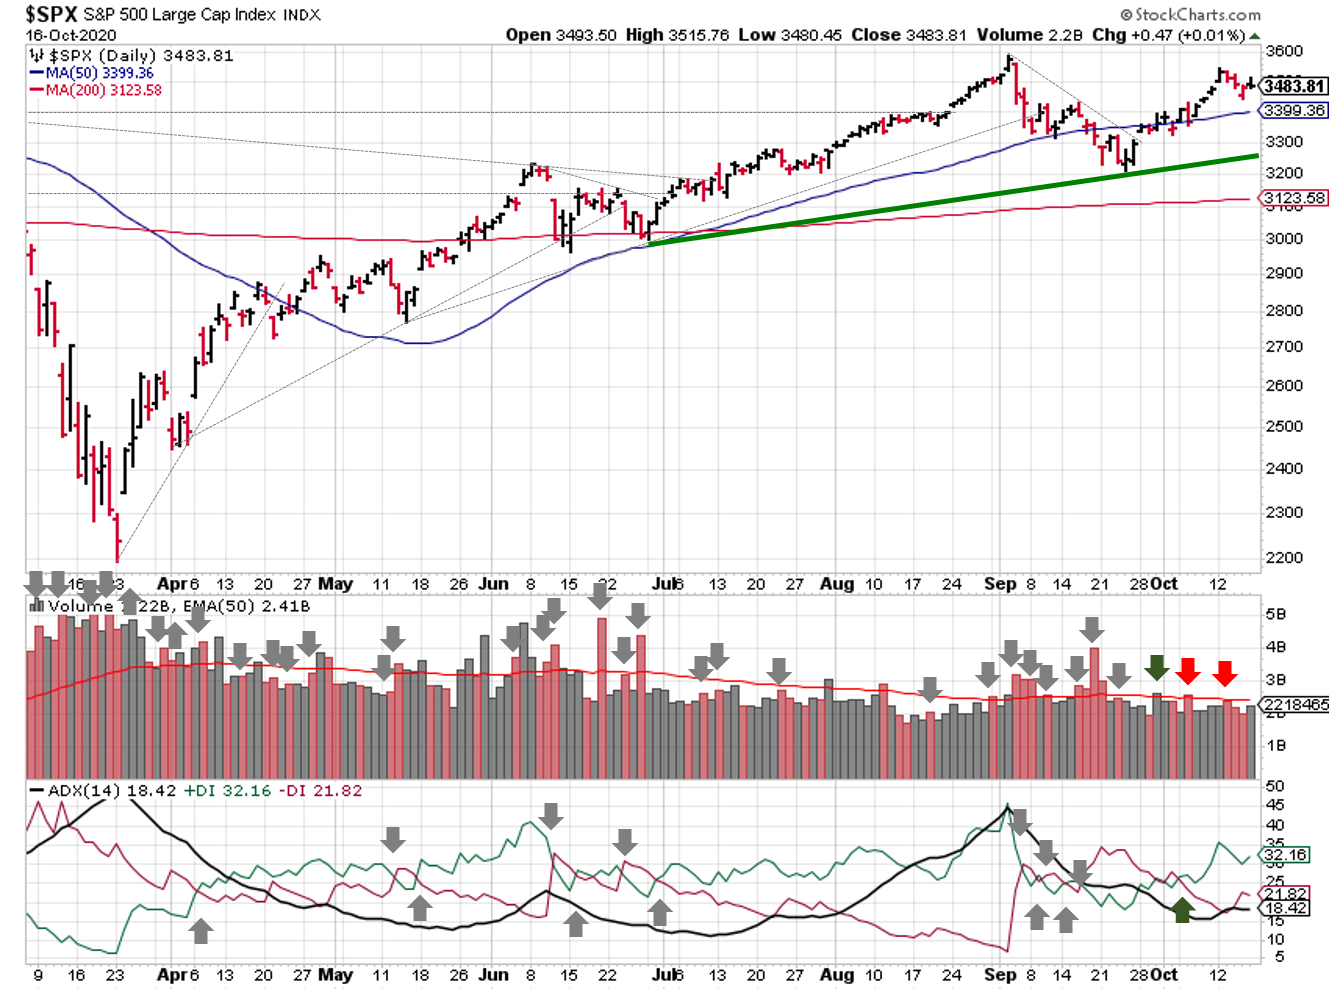
2020-10-18-SPX Trendline Analysis-Daily
The ADX continues to signal bullish price action to start the week. Price/volume picked up a distribution day, but the tally is still low.

2020-10-18-SPX Elliott Wave Analysis-Daily-PrimaryC
I didn’t get a chance to research potential bull counts last week, so I’ve updated the prior charts.

2020-10-18-SPX Elliott Wave Analysis-Daily-Primary1
The only hope for the bears is that prices fall past the 3200 level. If the S&P gets back to all time highs, it’s game over!

COMMENTARY
U.S. retail sales were unexpectedly higher last month, in spite of higher unemployment, lower hiring, and no stimulus package. On the downside, the second wave of the pandemic appears to be upon us, as cases throughout Europe and the US rise. A few vaccine trials have been paused due to health concerns, decreasing the likelihood that a vaccine will be available this year.
Best to your week!