Stock Market Outlook entering the Week of January 31st = Uptrend
-
- ADX Directional Indicators: Downtrend
- Price & Volume Action: Mixed
- Elliott Wave Analysis: Uptrend
ANALYSIS
The stock market outlook still shows an uptrend, but there’s bearish price action across the board.
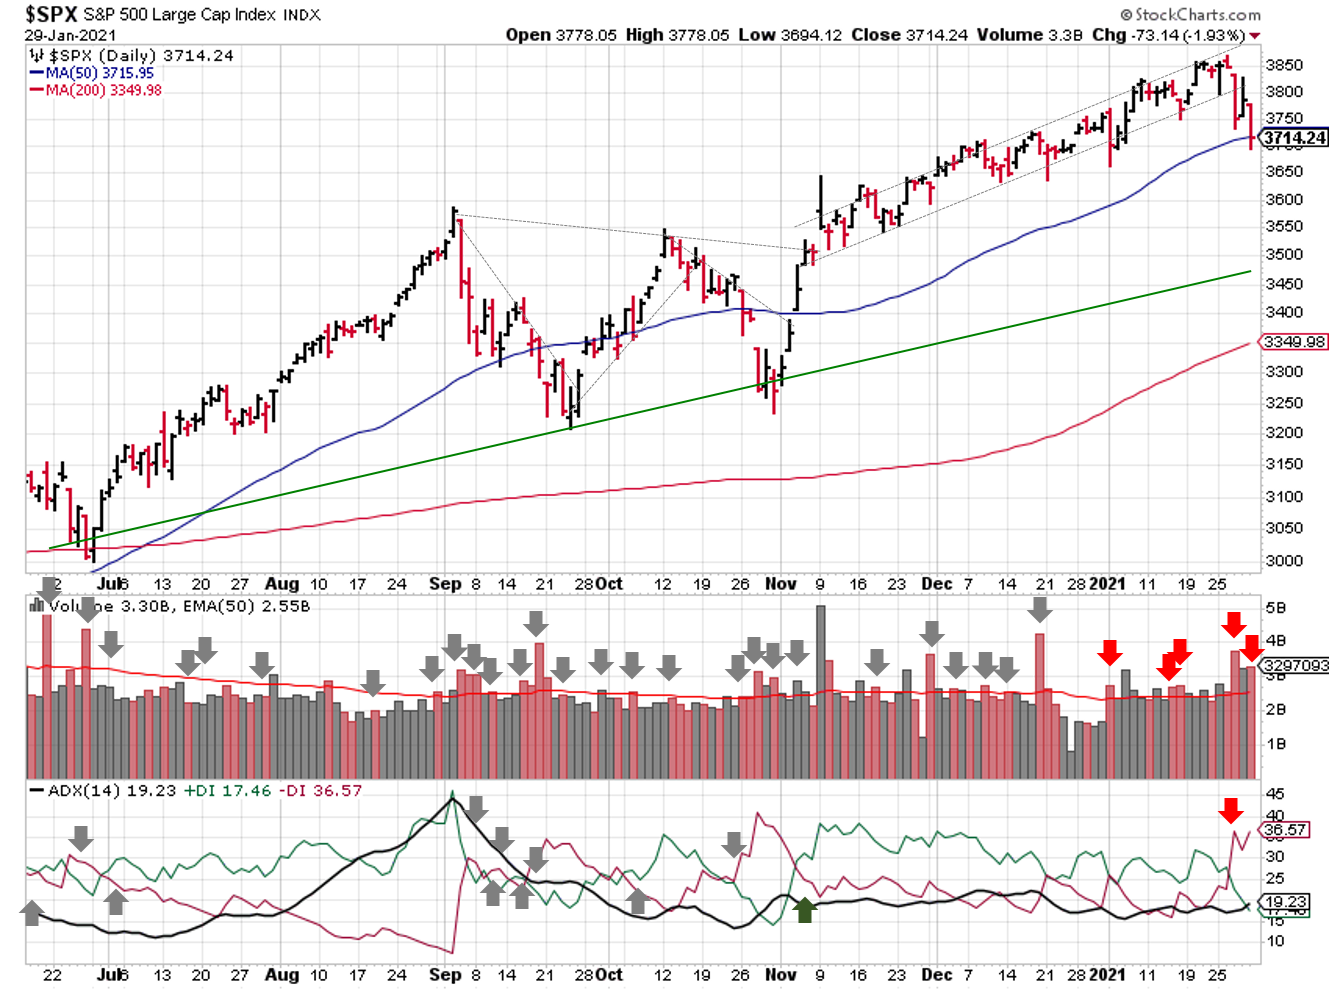
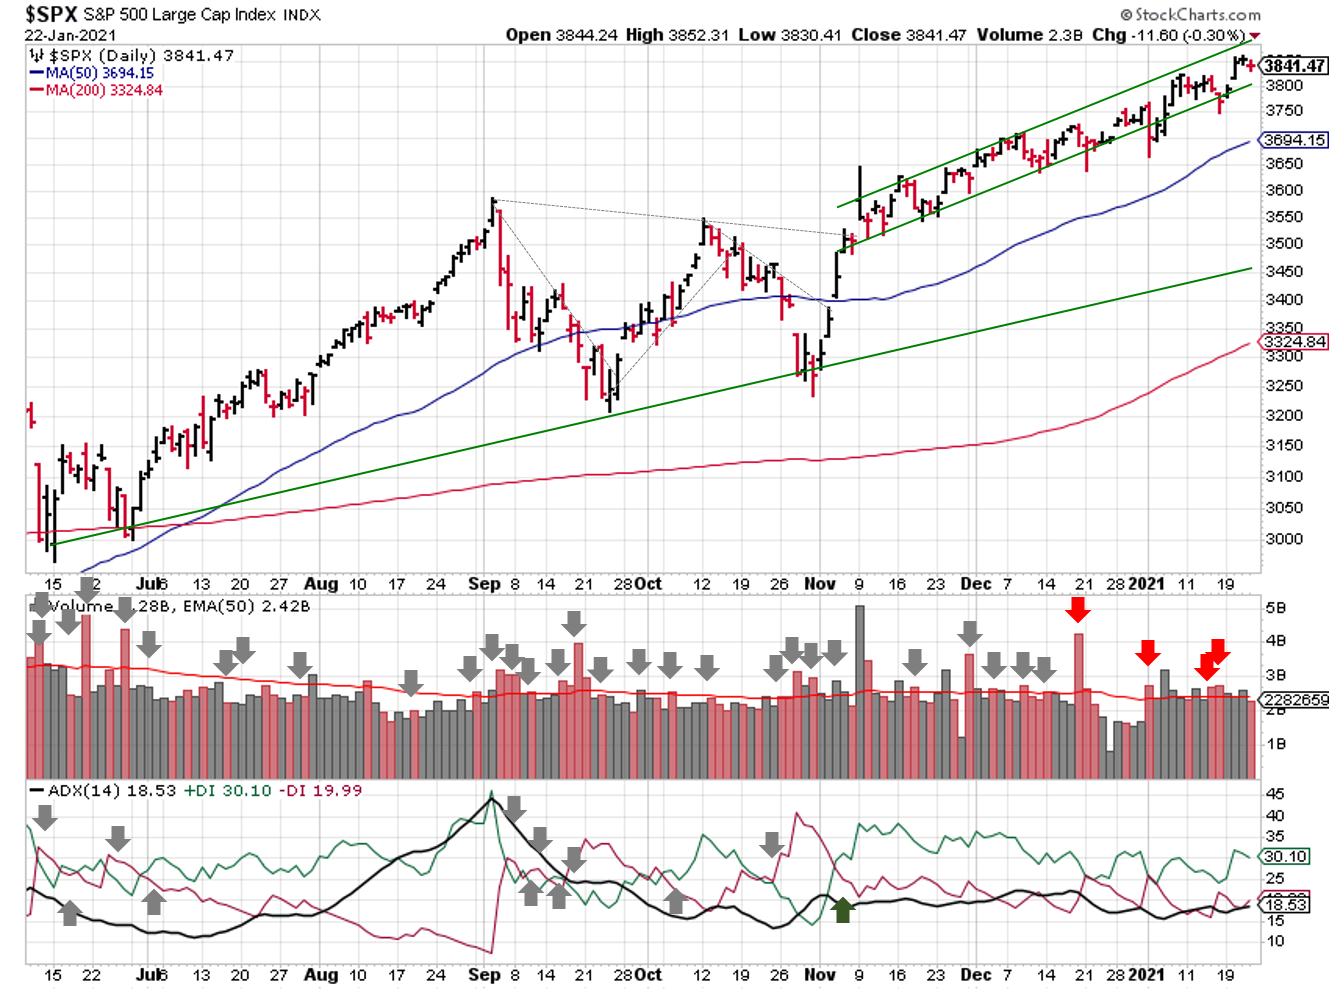
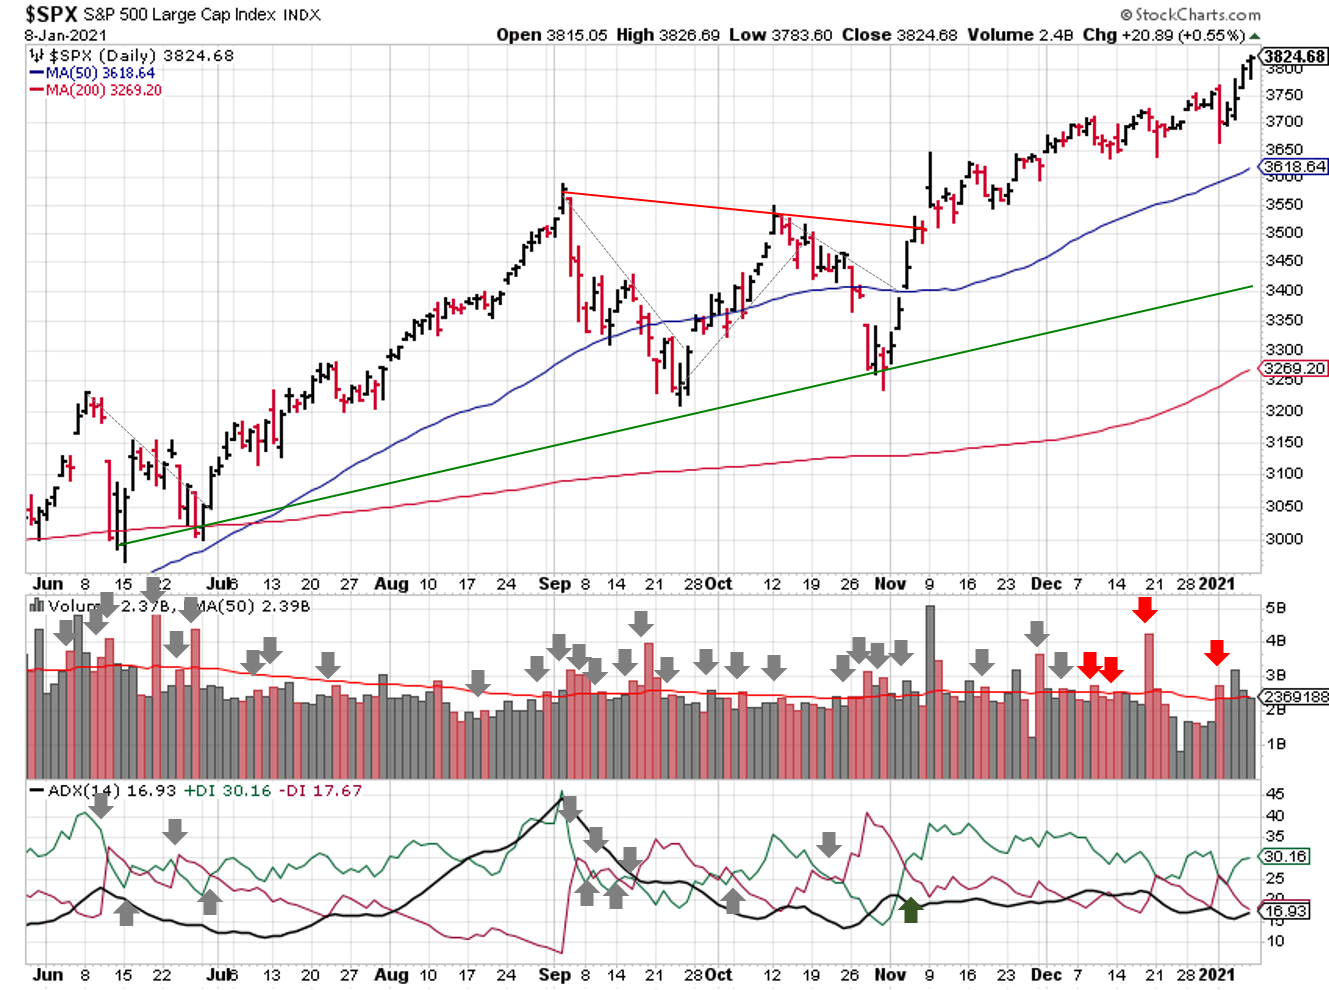
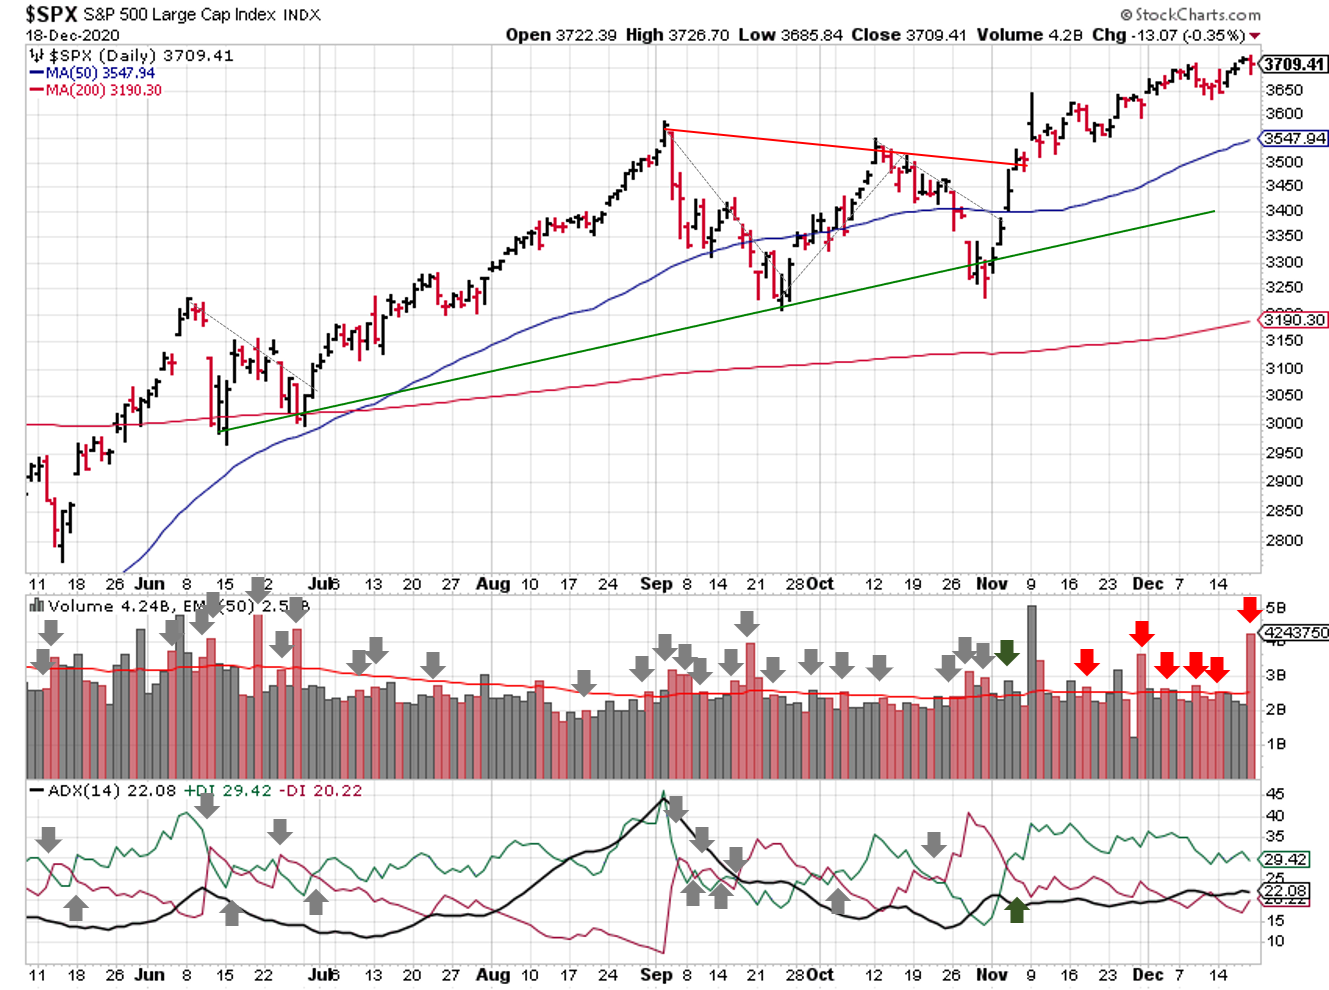
2021-01-31-SPX Trendline Analysis-Daily
The S&P500 ($SPX) price channel broke down last week, and price now rests right on the 50-day moving average. Breaking that level next week would shift the signal AND the overall market outlook, so stay frosty. And price is ~10% above the 200-day, which is still on the high side, historically.
The ADX directional indicators crossed over Wednesday, but the trend is still weak. Two distribution days were added to the count, but the price/volume signal hasn’t flipped just yet.
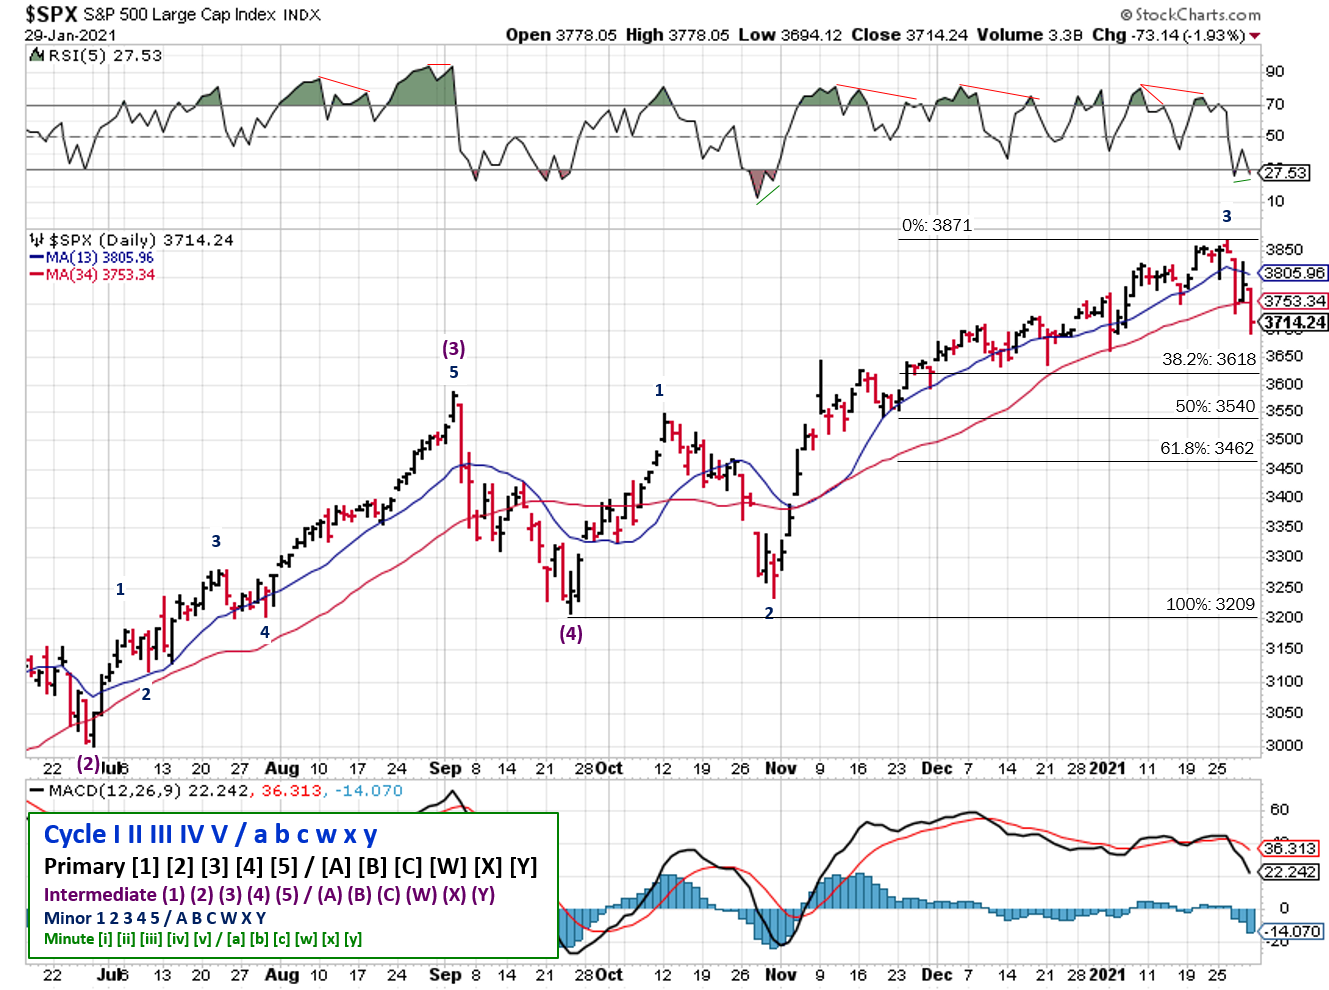
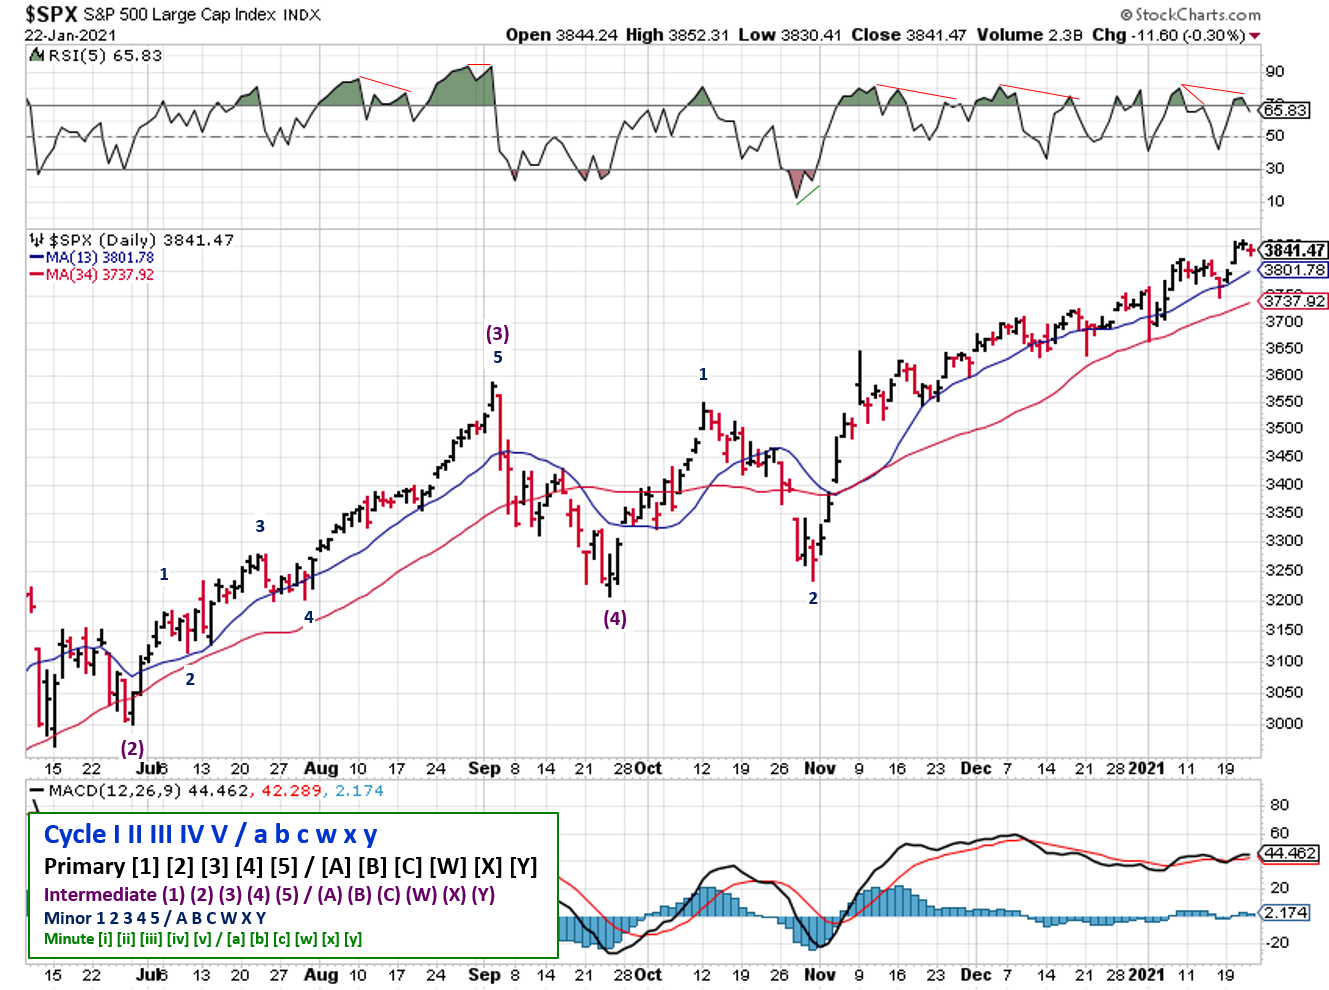
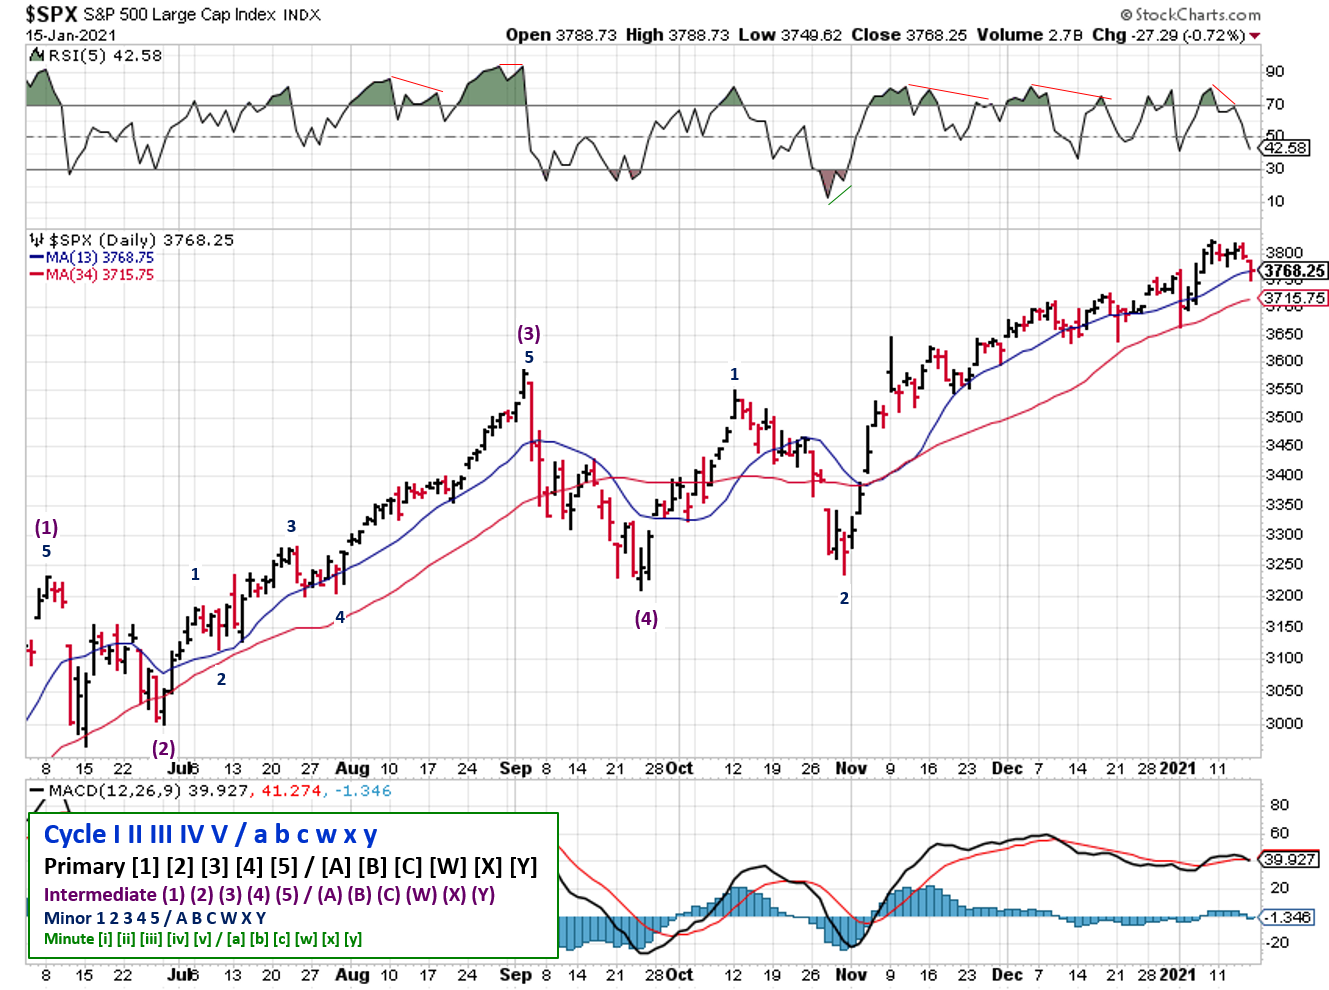
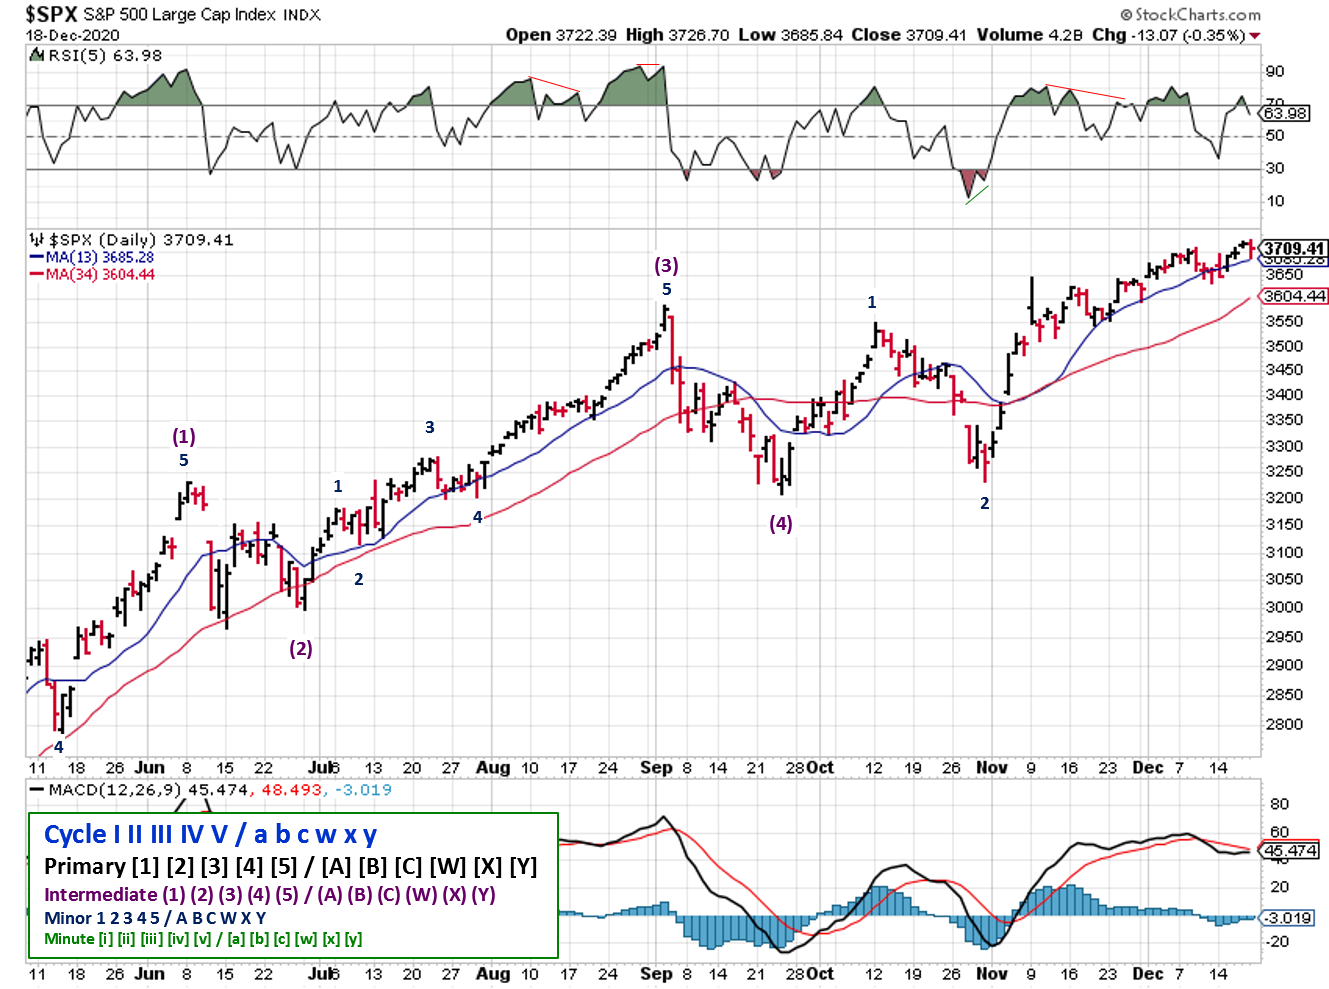
2021-01-31-SPX Elliott Wave Analysis-Daily-Primary 1
Elliott Wave shows a near term downtrend in place i.e. 4th wave), There was a slight divergence in the RSI at Friday’s low (a positive sign), but the 38% retracement level of the most recent wave is near 3,620, suggesting further downside next week.
The limit for the 4th wave would be the high of the first wave (3,550). Anything further south and the longer-term count needs adjustment. That would also be the point where the signal would flip.
COMMENTARY
So…anything interesting happen in the markets this week?

I feel like I’ve had an entire year’s worth of market-related discussions in the past 5 days. Unless you’ve been under a rock, you’ve heard something about:
- Retail traders using online message boards (i.e. Reddit & r/Wallstreetbets) to discuss stocks that were being “shorted” by hedge funds (e.g. Gamestop).
- Those retail traders bought large amounts of stock and/or options, driving the stock price higher.
- This forced hedge funds to cover their short positions (e.g. buy more stock and/or options) creating a feedback loop of higher prices (e.g. short/gamma squeezes).
But investors who’ve been around awhile have heard this all before; similar games were played back in 2000:
- Traders used online message boards (i.e. Yahoo message boards) to highlight stocks that were extremely cheap and had very low trading volumes (OTC and “Penny Stocks”).
- Those traders had already accumulated large positions. Uninformed investors then bought massive amounts of stock, driving the stock price higher.
- Those with initial positions would sell into the rally, and then prices would return to their original levels (i.e. pump and dump schemes).
What’s new this time around? The scale of the activity, thanks in part to:
- A pervasive “versus” mentality
- Haves vs Have Nots, Protected vs Unprotected, Institutional vs. Retail, Wall St. vs Main St.
- The K-shaped economic recovery (Essential vs Non-essential Businesses)
- Access to leverage (i.e. options, margin, low interest rate debt)
- Access to financial data and information
- Access and usage of social media
Whether or not Gamestop ($GME) should be priced at $1,000, $500, or $0.50 isn’t the point; it’s worth whatever people will pay for it, and that price will change over time.
Price change from trading isn’t limited to Gamestop. Similar price action occurred last summer in shares of Kodak ($KODK), or during 2018 in shares of Tilray ($TLRY). Lets not forget the prior or current run in Bitcoin. It could be in gold or silver at some point.
Many traders and investors will see profits. Many traders and investors will see losses; that’s the nature of speculation. The size of those changes are all relative to their personal financial situation; your small losses may be huge for me or visa versa.
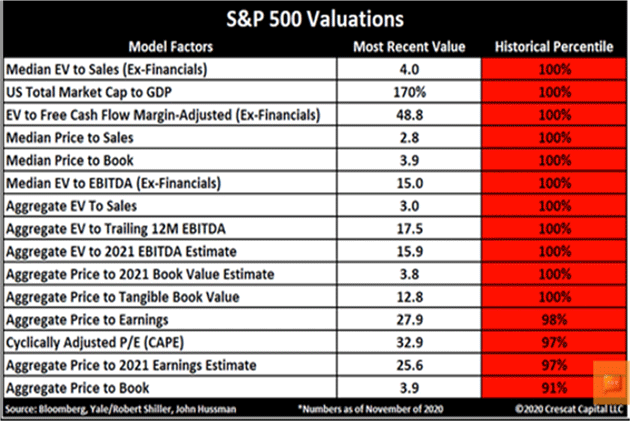
Of more concern is the potential for a broad shift in asset allocation towards de-risking portfolios. We know that the market is overvalued by almost every measure (see last week’s post). These moves take longer to play out (think a cruise liner turning around), and we’re just along for the ride. Billion dollar losses by hedge funds and market makers tend to cause changes.
Several market commentators have noted that many stocks are besting analyst estimates, then selling off (or at least not rallying). That’s not the behavior of strong bull markets, and suggests this news is already reflected at current price levels.
Coincidentally, some investors I greatly respect say that the market top is in and we’re going to see a major correction. We’ll only know if they’re right in hindsight, and even they acknowledge that they’re probably early. But the fact that they’ve coming out publicly and saying that it’s time to cash out is worth noting.
The stock market has had a good run since November, so don’t be shy about taking some money off the table (e.g. recover your initial investment). Keep your losses small no matter what. You can always buy back in if/when price action improves.
Best to Your Week!