Weekend Stock Market Outlook

Stock Market Outlook entering the Week of October 25th = Uptrend

    • ADX Directional Indicators: Mixed
    • Price & Volume Action: Uptrend
    • Elliott Wave Analysis: Uptrend

ANALYSIS

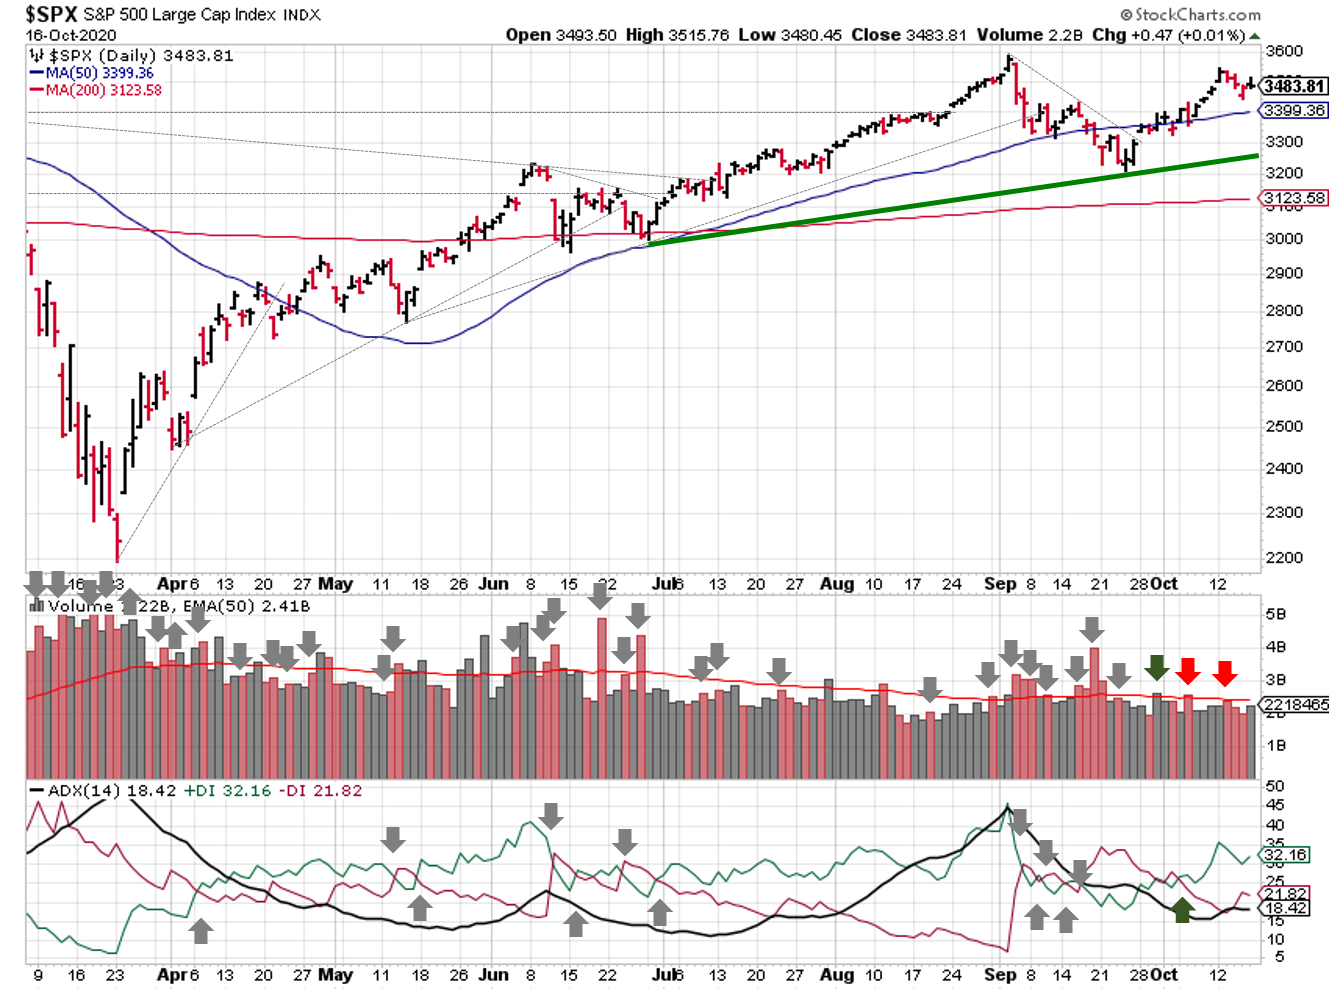
The stock market outlook remains in an uptrend, despite last week’s weak price action.

The S&P500 ($SPX) continued to decline last week, but found support near the 50-day moving average.

Technical analysis of daily SPX prices

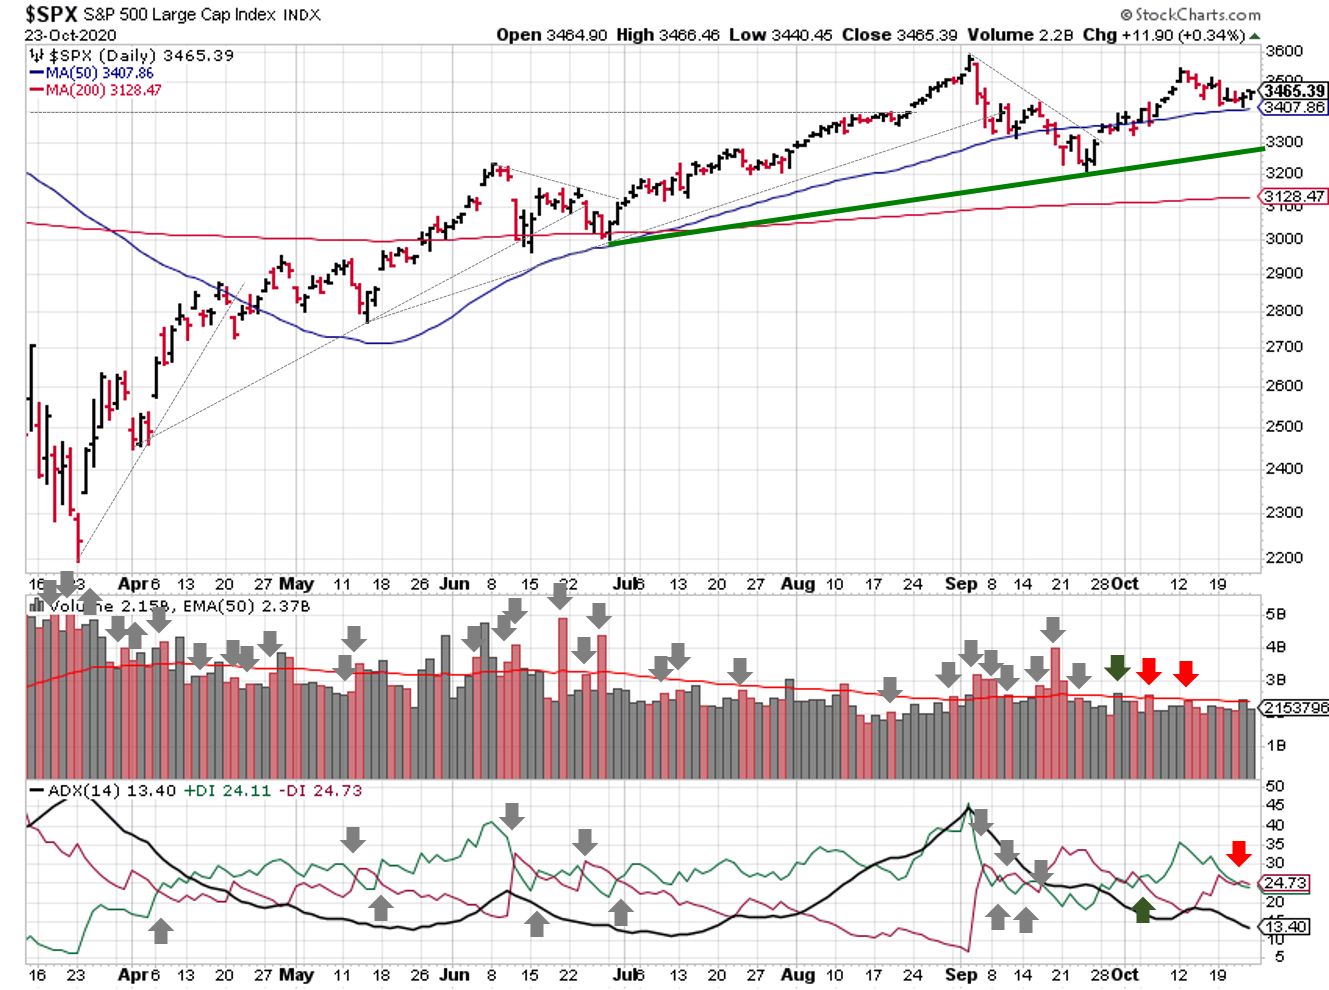
2020-10-25-SPX Trendline Analysis-Daily

The ADX flipped to a bearish trend ever so slightly (+DI = 24.11 / -DI = 24.73). That’s not enough to change the signal to a downtrend, but mixed is fair game. And it’s definitely something to watch early next week.

Price/volume is still green, and the recent declines haven’t been accompanied by distribution days. And a day or two of price increases on higher than average trading volume couldn’t hurt. Many technology stocks have good looking technical set-ups (think cups w/ handles), so it is a possibility.

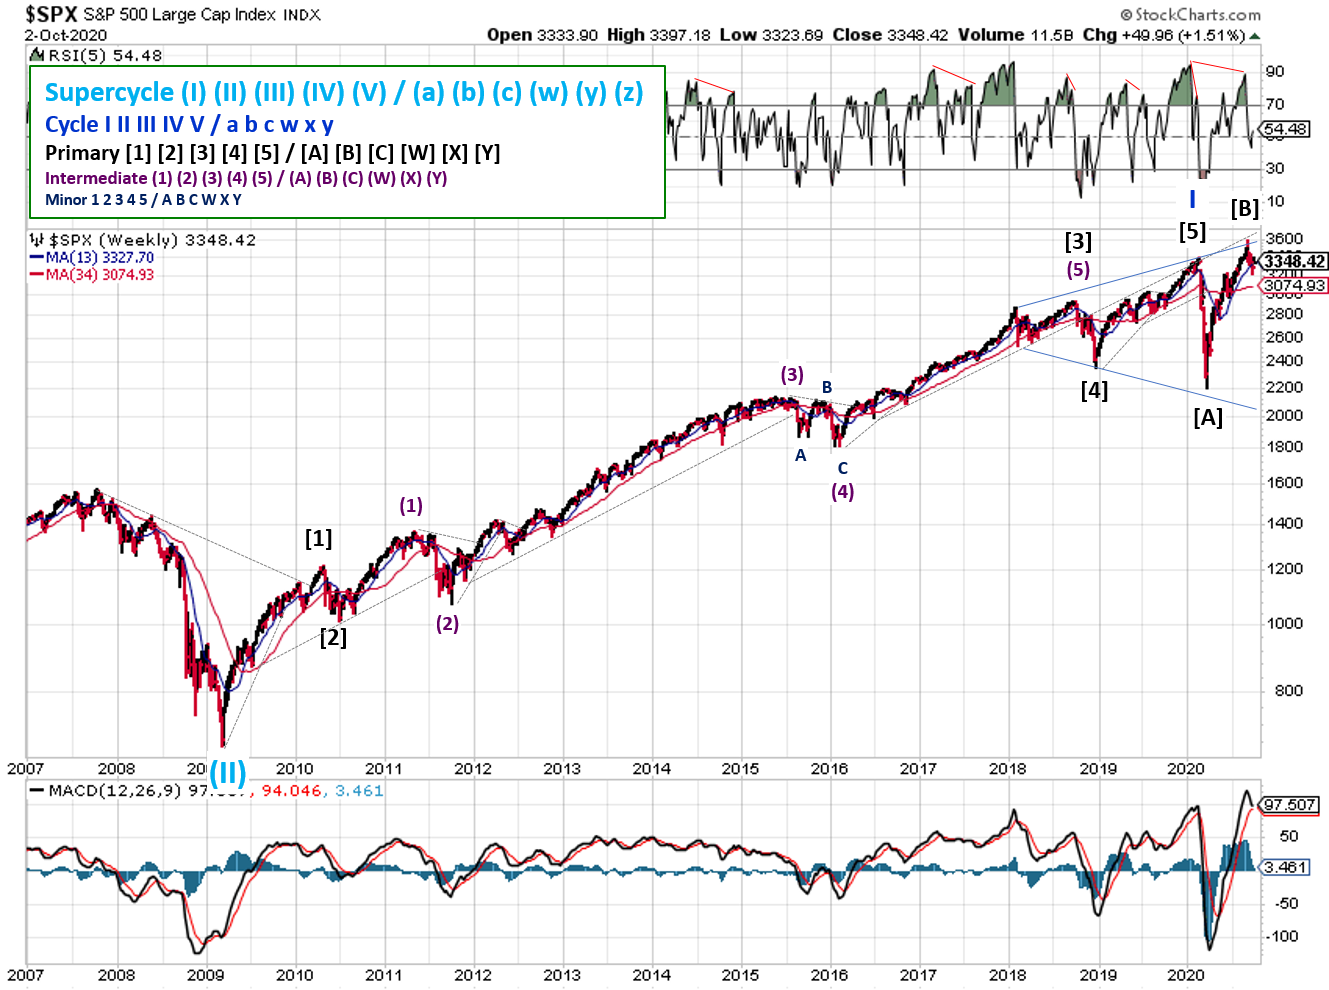
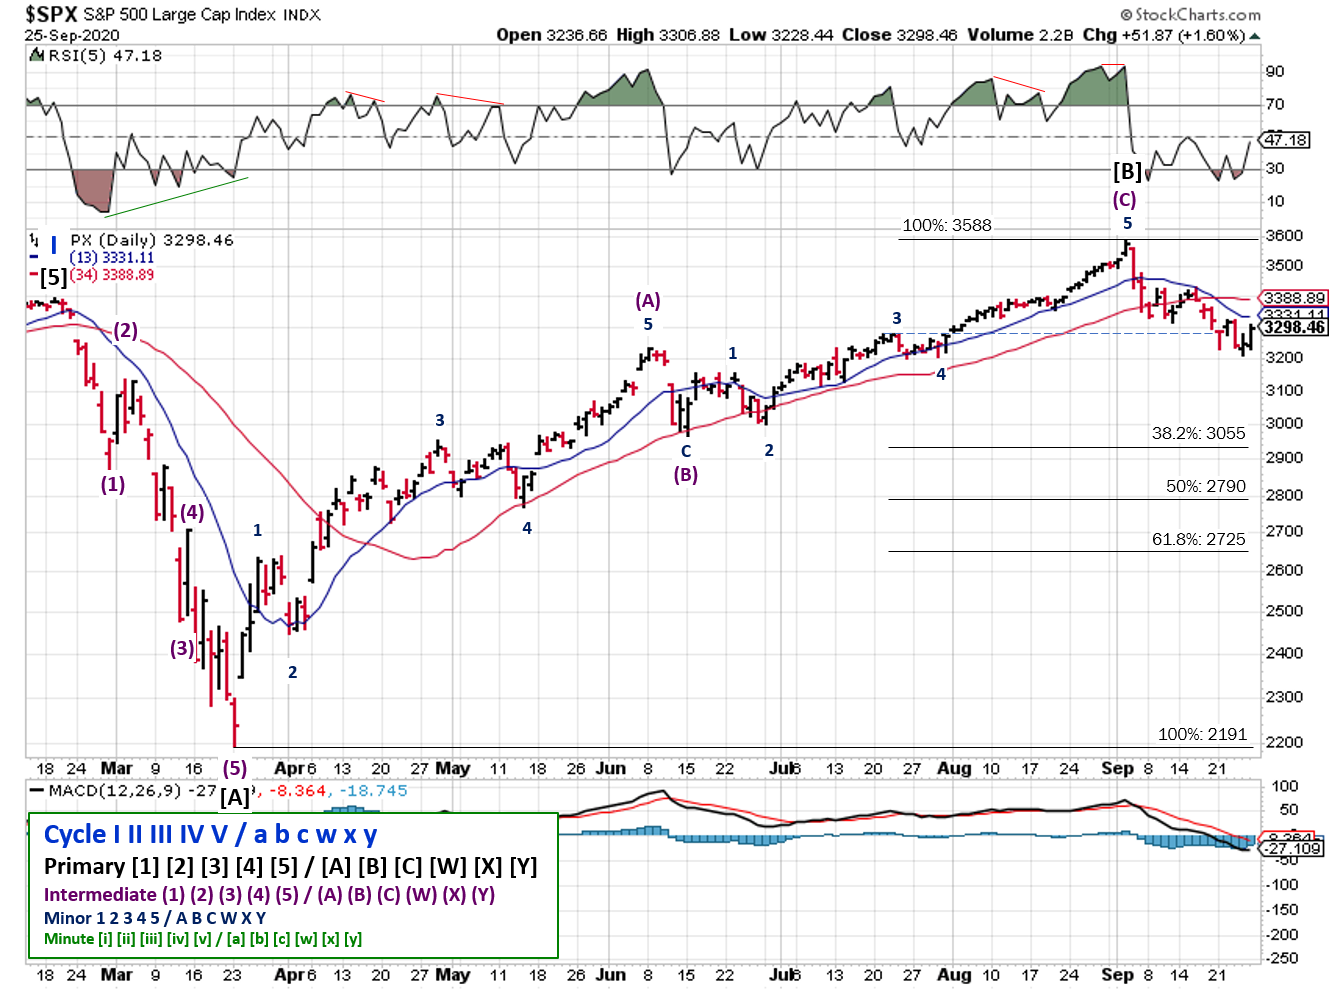
Bearish and bullish Elliott Wave charts below. We’ll stick with the prevailing trend until one or there other is invalidated.

Technical analysis of daily SPX prices

2020-10-25-SPX Elliott Wave Analysis-Daily-Primary C

Technical analysis of daily SPX prices

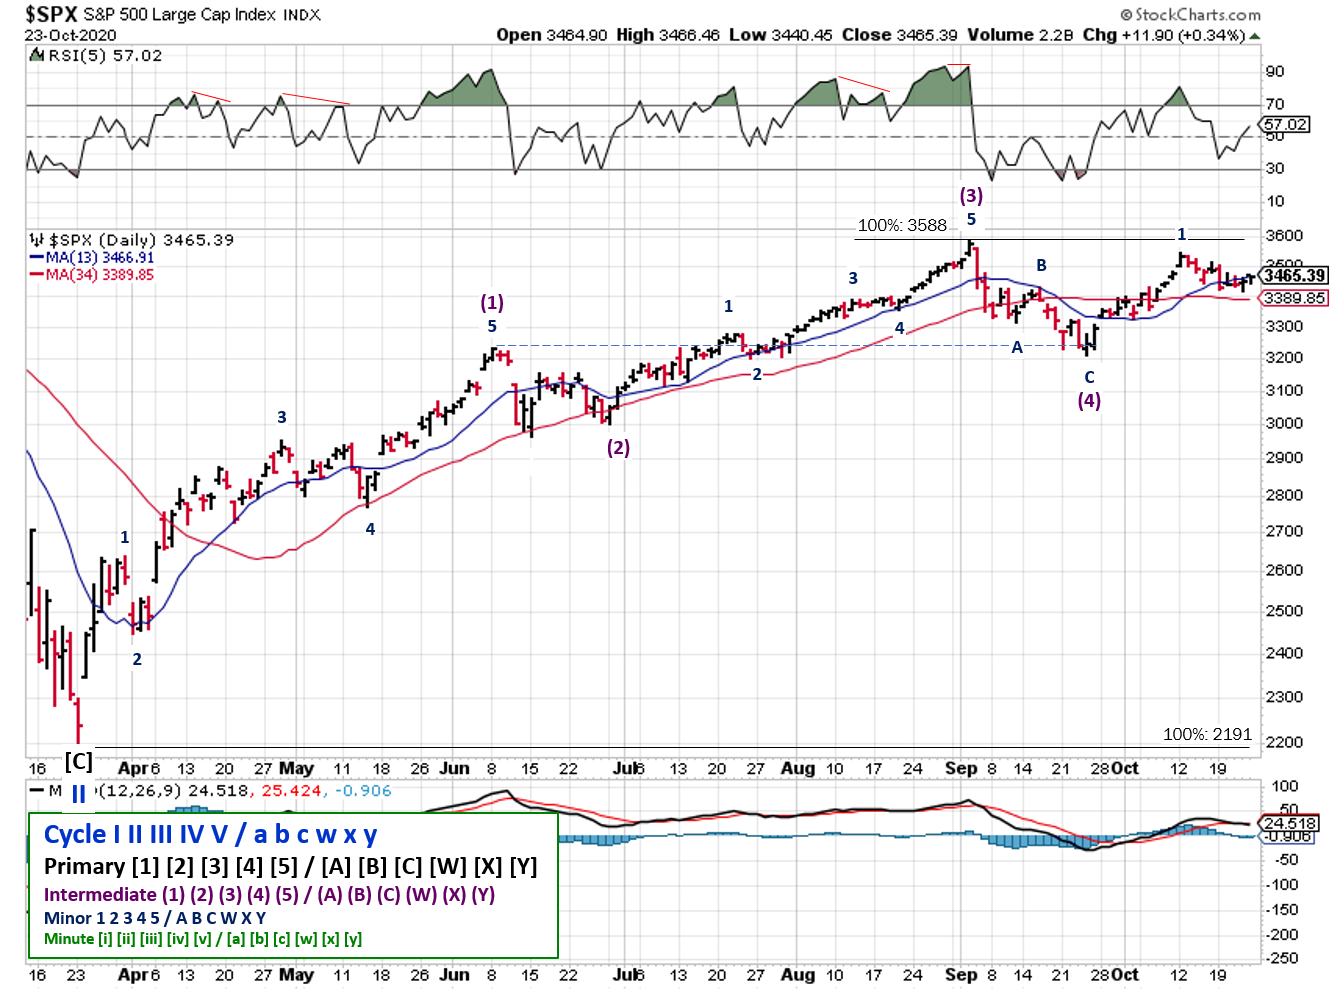
2020-10-25-SPX Elliott Wave Analysis-Daily-Primary 1

COMMENTARY
With just over a week until elections in the U.S., the stage is set for a lot of volatility. On tap this week are earnings for almost 40% of the S&P 500, ongoing stimulus talks, and ever present coronavirus issues.

Global coronavirus cases continue to rise, with many countries hitting daily records. While that’s partly a result of more testing, the percentage of positive results also increased as have hospitalizations. Failure to pass a stimulus package (or a passing something that’s poorly received) and COVID shutdowns would be catalysts to the downside.

From a market perspective, there are fewer unknowns in terms of business and earnings impact versus February. We have better procedures and treatments in place, with several vaccine candidates in final stage trials. Passing a good package, a manageable case count, or positive vaccine trials should push the markets back to new highs.

Even though the signals are relatively bullish, it wouldn’t take much price movement for the outlook to get really bearish. So be prepared for volatility, and adjust your expectations accordingly. It’s unlikely we’ll know the results of the election on election night, but prices will tell you want to do.

Best to your week!

Posted in Historical Data, Market Trends | Tagged , , , , | Comments Off on Weekend Stock Market Outlook

Weekend Stock Market Outlook

Stock Market Outlook entering the Week of October 18th = Uptrend

    • ADX Directional Indicators: Uptrend
    • Price & Volume Action: Uptrend
    • Elliott Wave Analysis: Uptrend

ANALYSIS

The stock market outlook remains in an uptrend to start this week.

The S&P500 ($SPX) took a a break last week, finding support at the 13 day moving average. That said, price sits ~10% above the 200-day moving average, so we’re getting extended again.

Technical analysis of daily SPX prices

2020-10-18-SPX Trendline Analysis-Daily

The ADX continues to signal bullish price action to start the week. Price/volume picked up a distribution day, but the tally is still low.

Technical analysis of daily SPX prices

2020-10-18-SPX Elliott Wave Analysis-Daily-PrimaryC

I didn’t get a chance to research potential bull counts last week, so I’ve updated the prior charts.

Technical analysis of daily SPX prices

2020-10-18-SPX Elliott Wave Analysis-Daily-Primary1

The only hope for the bears is that prices fall past the 3200 level. If the S&P gets back to all time highs, it’s game over!

COMMENTARY

U.S. retail sales were unexpectedly higher last month, in spite of higher unemployment, lower hiring, and no stimulus package. On the downside, the second wave of the pandemic appears to be upon us, as cases throughout Europe and the US rise. A few vaccine trials have been paused due to health concerns, decreasing the likelihood that a vaccine will be available this year.

Best to your week!

Posted in Historical Data, Market Trends | Tagged , , , , | Comments Off on Weekend Stock Market Outlook

Weekend Stock Market Outlook

Stock Market Outlook entering the Week of October 11th = Uptrend

    • ADX Directional Indicators: Uptrend
    • Price & Volume Action: Uptrend
    • Elliott Wave Analysis: Uptrend

ANALYSIS

The stock market outlook flipped over early last week, and starts this week in an uptrend.

Technical analysis of daily SPX prices

2020-10-11-SPX Trendline Analysis-Daily

The S&P500 ($SPX) experienced a really good week, finding support at the 50-day moving average and rallying from there. The ADX and price/volume flipped to an uptrend on Monday. And since price rose above 3429, Elliott Wave also shows an uptrend, and more than likely a switch to a bullish count like the one mentioned last week.

COMMENTARY

Stimulus remains the driving force behind the U.S. markets. Only right now, it’s the negotiations, not the actual money. It doesn’t appear to be a “will they / won’t they” decision. Both political parties seem to recognize that government assistance is still required to keep the economy afloat while the pandemic continues to play out. The question is how much will be approved (converging around 2 trillion), and when it will get passed (pre or post-election).

The Fed is also pushing for renewed fiscal support from the legislature, and remains ready to keep policy “accommodating” (i.e. expect interest rates to remain low for a while).

Best to your week!

Posted in Historical Data, Market Trends | Tagged , , , , | Comments Off on Weekend Stock Market Outlook

Weekend Stock Market Outlook

Stock Market Outlook entering the Week of October 4th = Downtrend

    • ADX Directional Indicators: Downtrend
    • Price & Volume Action: Mixed
    • Elliott Wave Analysis: Downtrend

ANALYSIS

The stock market outlook continues show a downtrend to start this week, with the ADX and Elliott Wave in downtrends.  Price/volume is mixed.

The S&P500 ($SPX) gapped up to start last week, breaking through the bearish trendline. 

Technical analysis of daily SPX prices

2020-10-04-SPX Trendline Analysis-Daily

The ADX starts this week in a downtrend, while the price/volume moved to mixed. The S&P registered a follow-through day (>1% move on higher volume) on Wednesday, but sold-off into the close.  Price starts the week below the 50-day moving average, so I’m calling this signal mixed for now.

Technical analysis of daily SPX prices

2020-10-04-SPX Elliott Wave Analysis-Daily-PrimaryC

Elliott Wave is still showing a downtrend, and it’s easy to see three waves down…you can make 5 if you squint.  The S&P breached 3310, which was the first sign that the current leg of the downtrend was completed. 

I mentioned seeing a bunch of different counts last week, and someone asked for my “bullish” view (i.e. the Feb to Mar sell-off was the complete downtrend and now we’re back in an uptrend).  Here it is:

Technical analysis of daily SPX prices

2020-10-04-SPX Elliott Wave Analysis-Daily-Primary1

The bullish view appears to show we’re in the 5th wave of a Primary 1 uptrend (verses the 1st wave of a Primary C downtrend in my bearish count).  The problem with this count is the overlap of (1) and (4).  It’s not a lot, but it’s there.

Either way, getting above 3429 would confirm an uptrend, while falling below 3200 reconfirms a larger downtrend.

Technical analysis of weekly SPX prices

2020-10-04-SPX Trendline Analysis-Weekly

In the weekly view, the negative RSI divergence shows up, which is why it’s possible we ended a 5th wave.  And I’m still showing the bearish count here.

COMMENTARY

Well, I guess we didn’t have to wait long for an October surprise; the U.S. president tested positive for COVID-19. Then again, there are a lot of people that don’t think that is surprising. The Presidents health will dominate the news cycle this week, at a minimum, so expect volatility.

The U.S. unemployment rate is running around 8%, but job creation slowed. Fiscal stimulus, which many believe to have been the catalyst for the market recovery, is still being negotiated.

A while back, there was a debate about the “shape” of the recovery: U-shaped, V-shaped, L-shaped. As far as stocks are concerned, everyone was wrong…it was K-shaped! Technology and stay-at-home stocks (e.g. Amazon) experienced the V-shape, while more traditional/value stocks (e.g. Chevron or Glaxo-Smith) experienced something like the L-shape.

Best to your week!

Posted in Historical Data, Market Trends | Tagged , , , , | 1 Comment

Market Insights from JP Morgan for 2020 Q4

Each quarter, JP Morgan Asset Management provides a ton of useful information via its “Guide to the Markets”:

“a comprehensive array of market and economic histories, trends and statistics through clear, compelling charts and graphs you can share with your clients.”

You can find this little gem on JP Morgan’s Asset management website, including the “Guide to the Markets” PDF and audio commentary.  Topics include Equities, Fixed Income, International markets, the U.S. economy, as well as alternative investments and investor behavior.


Source (PDF): JP Morgan Guide to the Markets: Q4 2020
https://am.jpmorgan.com/us/en/asset-management/gim/adv/insights/guide-to-the-markets/viewer

Posted in Current Events, Historical Data, Investing, Market Trends, Uncategorized | Tagged , , , , , , , | Comments Off on Market Insights from JP Morgan for 2020 Q4

Weekend Stock Market Outlook

Stock Market Outlook entering the Week of September 27th = Downtrend

    • ADX Directional Indicators: Downtrend
    • Price & Volume Action: Downtrend
    • Elliott Wave Analysis: Downtrend

ANALYSIS
The stock market outlook continues show a downtrend to start this week, with the ADX, price/volume, and Elliott Wave in downtrends.

Technical analysis of daily SPX prices

2020-09-27-SPX Trendline Analysis-Daily

The S&P500 ($SPX) continues correcting towards the 200-day moving average. The ADX and price/volume remain bearish; price remains below the 50-day moving average with a high level of institutional selling.

If the bearish trendline holds, prices should retreat early this week. On the bullish side, look for a large advanced on high trading volume as a signal that a new rally is taking shape.

Technical analysis of daily SPX prices

2020-09-27-SPX Elliott Wave Analysis-Daily-Intermediate 1

For the Elliott Wave signal, price fell below 3279 during the week, invalidating the 3rd wave count shown previously and confirming the near term downtrend.

I’ve researched a few different viewpoints, and settled on Intermediate 1 of the Primary C wave.  It’s a very bearish count and suggests the S&P will retest the March low.  I only think that’s possible if we have a very gradual, slow moving decline.  Any kind of volatility, and expect the Fed to step in to support the market.  If/when that occurs, the count likely shifts to a bull count (e.g. Primary [A] shifts to a Primary 2, Primary [B] shifts to a Intermediate 1, etc.)

Either way, the Elliott Wave signal is in a downtrend to start the week. If the S&P can get above 3310, then the current leg of the downtrend is probably over, since the current wave shouldn’t overlap with the prior wave peak from Sept 11.

COMMENTARY
As expected, September wasn’t a great month for U.S. stocks. But that doesn’t mean we’re out of the woods yet. It’s an election year, so next month we’ve got the “October surprise”. And if that last election is any indication, stocks could be in for a wild ride in November.

Best to your week!

Posted in Historical Data, Market Trends | Tagged , , , , | Comments Off on Weekend Stock Market Outlook

Weekend Stock Market Outlook

Stock Market Outlook entering the Week of September 20th = Downtrend

    • ADX Directional Indicators: Downtrend
    • Price & Volume Action: Downtrend
    • Elliott Wave Analysis: Uptrend

ANALYSIS
The stock market outlook switches to a downtrend to start the week. The ADX signal was joined by the price/volume signal in bearish territory, while Elliott Wave isn’t too far away from a switch either.

Technical analysis of daily SPX prices

2020-09-20-SPX Trendline Analysis-Daily

The S&P500 ($SPX) is still ~7% away from the 200-day moving average. More concerning was Friday’s drop below the 50-day moving average on higher than average trading volume.

The ADX flip flopped again last week, and again starts the current week showing a bearish environment.  A couple of heavily selling days and a drop below the 50-day landed the price/volume signal in downtrend territory, as mentioned in last week’s post.

Friday was a quadruple witching day, so option expiration skewed price movements somewhat. Still, it’s better to protect your capital; be safe not sorry. Look for a rebound from the 50-day on strong volume to confirm that the correction is complete.

Technical analysis of daily SPX prices

2020-09-20-SPX Elliott Wave Analysis-Daily-Intermediate C

For the Elliott Wave signal, price only fell to 3292, so the current count remains in place. If the S&P falls below 3279, then the count will need to be adjusted and this signal will likely flips to a downtrend as well. Otherwise, we should start the 5th wave shortly and head higher.

COMMENTARY
In Europe, we could be seeing the start of a second coronavirus wave.

If you’ve been trading this uptrend and recently entered positions, remember to keep your losses small and sell if your 7-8% below your buy price. The big tech names that were driving the indexes higher are near their 50-day moving averages, so don’t fight the market. You can always buy back in when and if prices recover.

When planning your trades, keep in mind that September isn’t great for stocks historically, and we typically see a sell off during the second half of the month.

Best to your week!

Posted in Historical Data, Market Trends | Tagged , , , , | Comments Off on Weekend Stock Market Outlook