Weekend Stock Market Outlook – May 29 2022

Stock Market Outlook entering the Week of May 29th = Downtrend

    • ADX Directional Indicators: Downtrend
    • Price & Volume Action: Mixed
    • Elliott Wave Analysis: Mixed

ANALYSIS
The stock market outlook shows a downtrend is still in place, despite the bear market rally.

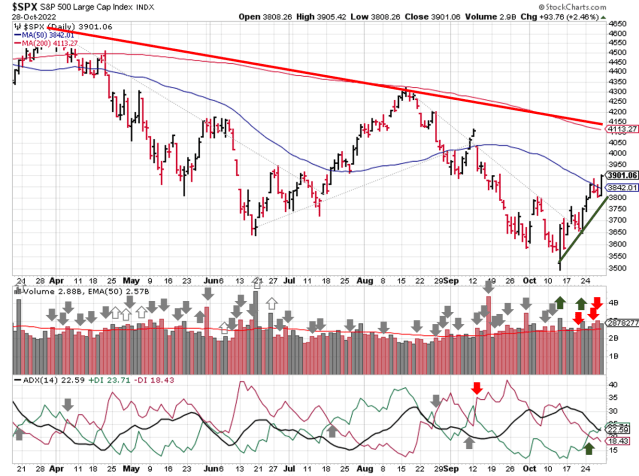
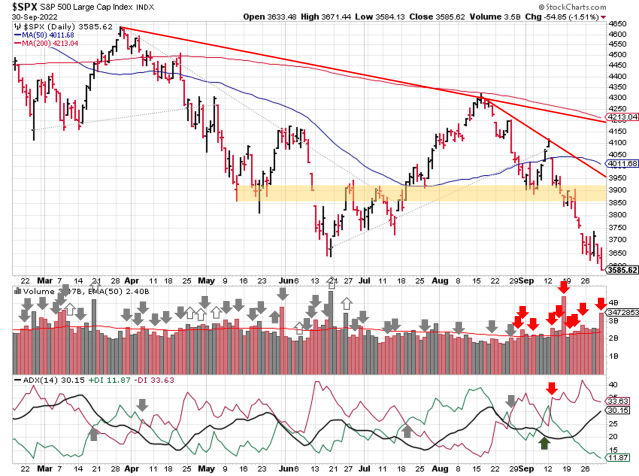
The S&P500 ($SPX) jumped 6.6% last week, erasing almost a third of its total loss for the year.  The index now sits ~13% off it’s high for the year, 7% below the 200-day moving average and only 3% below the 50-day.  It closed in a critical zone, in terms of support and resistance, with the start of the March rally (support) creating a solid resistance level.

Technical analysis of daily SPX prices

SPX Price & Volume Chart for the Week of May 29 2022

The ADX signal remains in downtrend, but could flip if we see a more up days this week.

The S&P 500 showed a small amount of accumulation last week, so the price & volume signal shifts to mixed.  The index picked up a follow-through day on Thursday, four days after the May 20th bounce, which is the earliest possible confirmation of a rally.  That said, it’s a weak set-up based on below average trading volume and remaining below the 50-day.  A high volume follow-through this week would be a better signal.

Technical analysis of daily SPX prices

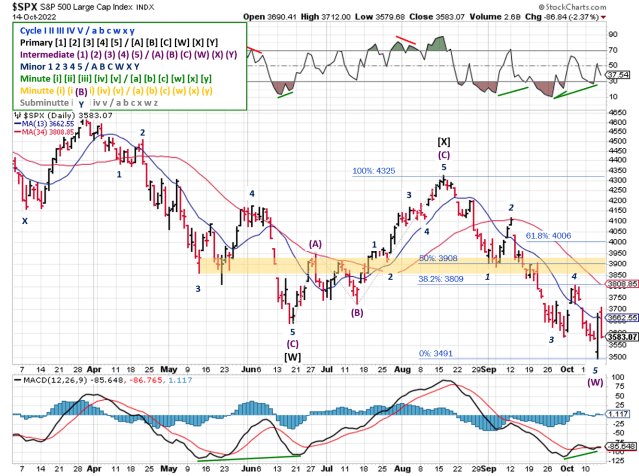
SPX Elliott Wave Analysis for the Week of May 29 2022

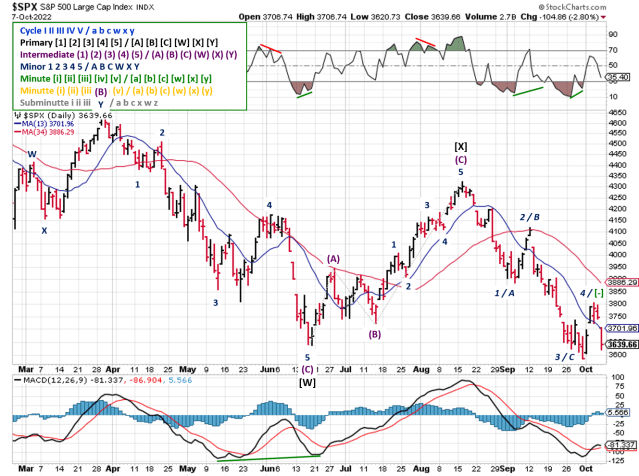
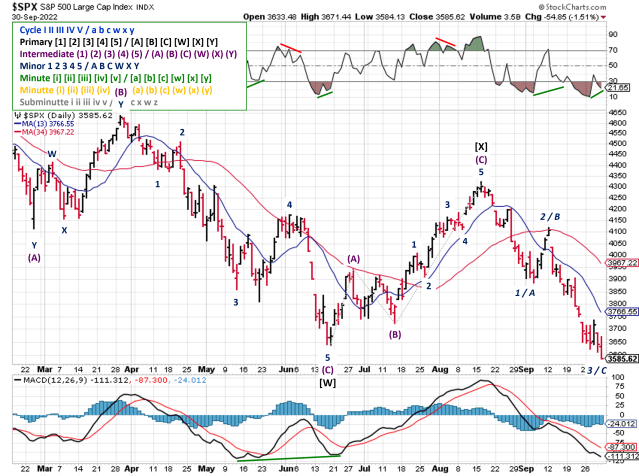
Elliott Wave also shifts to mixed, and gets a new count/wave structure to go along with it  (more analysis below, per the usual for the past few weeks).

COMMENTARY
A short week on tap; U.S. markets are closed Monday in observance of Memorial Day.

You’ve heard a lot of commentary about whether or not we’re in a bear market.  Historically, a bear market begins after falling 20% a peak.  But really that’s an arbitrary number; a talking point.

Does something radically change in your process when a market is down 20% vs 19%?  What about when the Nasdaq is down more than 20% but the S&P500 isn’t?  I’m guessing that’s a negative in both cases. 

What does impact your process?  Data.  Like the VIX remaining above 20 during the March rally. Down 20% or not, that’s bear market territory and requires changes.

Speaking of data, what about consumer spending, credit card balances, or savings rates?  After downbeat forecasts from Target and Walmart, many talking heads are seizing the relatively upbeat reports from Macy’s, Nordstrom, and Ralph Lauren as a sign the consumer is still strong, along with spending levels and “high” savings rates. Unfortunately, the difference between the two types of retailers is actually a sign of weakness.

Target and Walmart serve consumers in lower-income brackets, and their reports show a change in spending behavior likely caused by high inflation.  Their customers are also the ones that began tapping credit card balances (with ridiculously high interest rates) to maintain their spending when inflation first began to pick up.

Nordstrom and Ralph Lauren cater to higher-income brackets; the last consumers to feel the sting of inflation and change their spending habits.  Their customers have the highest savings rates, which allows them to maintain spending in spite of higher inflation.

Best To Your Week!


P.S.
Based on the analysis shared last week, I updated the waves to show Cycle I ending at the beginning of the year.

Technical analysis of daily SPX prices

SPX Elliott Wave Analysis for the Week of May 29 2022

Something about the wave structure of Intermediate (1) has seemed wrong from the start, especially when zooming out to the weekly view (like we’ve been doing the past few weeks). Maybe it’s just the symmetry of the whole thing, who knows. The pattern that kept popping out to me was 3 waves down, then 3 waves up, then 5 waves down. After last weeks bounce, it made even more sense.

Technical analysis of weekly SPX prices

SPX Elliott Wave Analysis for the Week of May 29 2022

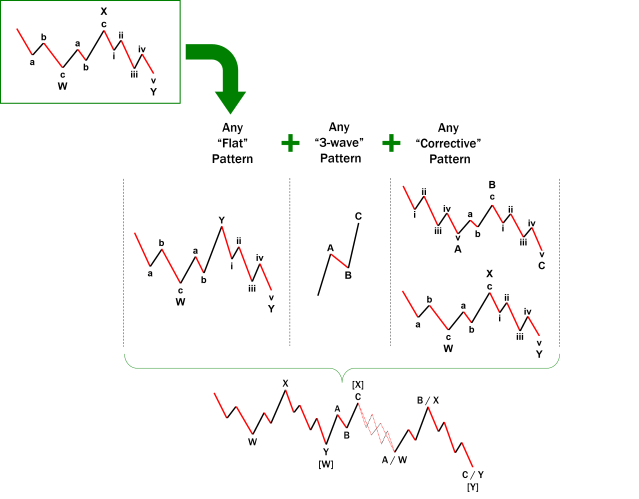
That’s actually another type of corrective pattern, called a “flat” (verses a zigzag).  In this case, it looks like an irregular or expanded flat.  It looks like a much better match to the price action and technical indicators.

Technical analysis of daily SPX prices

SPX Elliott Wave Analysis for the Week of May 29 2022

All good right?  Not quite.  Thanks to last week’s rally, this new flat pattern is already complete, implying the whole downtrend is over.  That’s wishful thinking, since the Fed’s quantitative tightening program hasn’t even started yet.  Given the current economic backdrop, a longer-term correction is likely, and a flat pattern enables this type of extended move, called a “double-three” (or even triple if it comes to that).

Double Three Corrective Pattern

Double Three Corrective Pattern

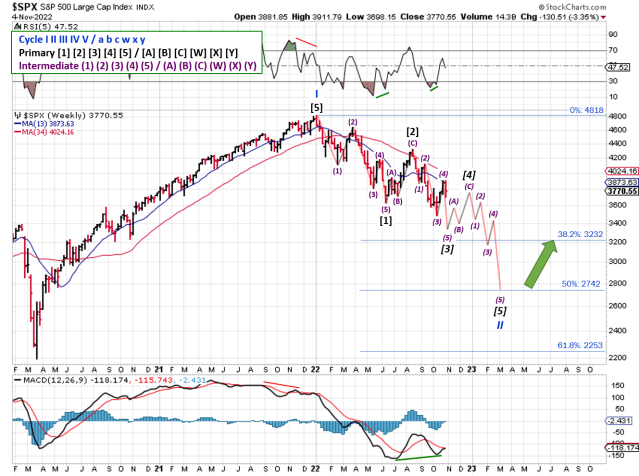
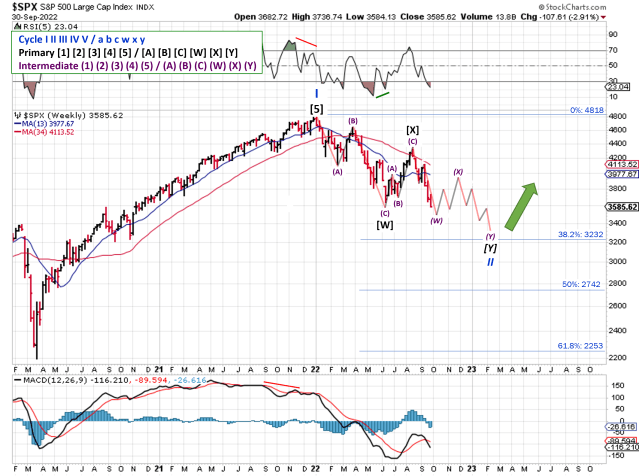
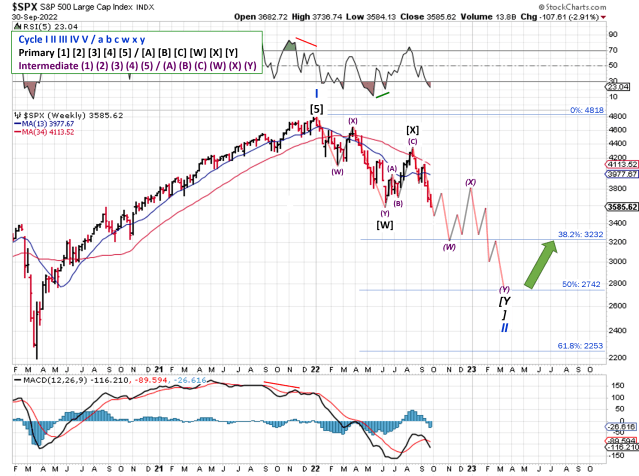
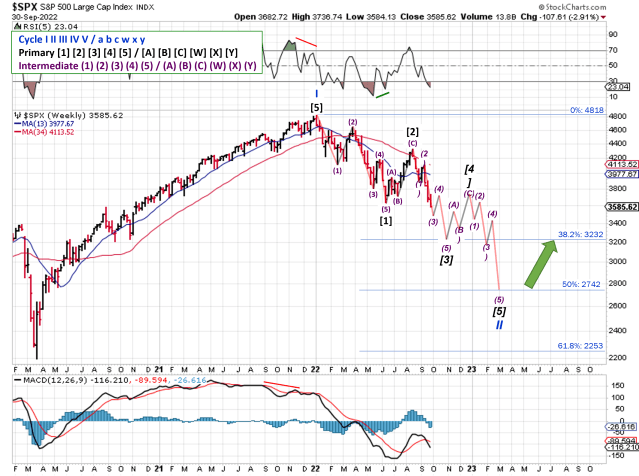
Laying in those patterns on the weekly view provides more likely alternatives for the overall bear market.

Technical analysis of weekly SPX prices

SPX Elliott Wave Analysis for the Week of May 29 2022

Technical analysis of weekly SPX prices

SPX Elliott Wave Analysis for the Week of May 29 2022


Invest Safely, LLC is an independent investment research and online financial media company.  Use of Invest Safely, LLC and any other products available through invest-safely.com are subject to our Terms of Service and Privacy Policy. Not a recommendation to buy or sell any security.
Posted in Historical Data, Market Trends | Tagged , , , , | Comments Off on Weekend Stock Market Outlook – May 29 2022

Weekend Stock Market Outlook – May 22 2022

Stock Market Outlook entering the Week of May 22nd = Downtrend

    • ADX Directional Indicators: Downtrend
    • Price & Volume Action: Downtrend
    • Elliott Wave Analysis: Downtrend

ANALYSIS
The stock market outlook still shows a downtrend in place, with the S&P500 flirting with a 20% drawdown drop from its all time high. So far, sell in May and go away was the right call!

Technical analysis of daily SPX prices

SPX Price & Volume Chart for the Week of May 22 2022

The S&P500 ($SPX) fell ~3% last week, and now sits 10% and 15% below the 50 and 200 day moving averages, respectively. All three signals continue to show bearish trends in place.  Price/volume shows most accumulation days are quickly followed by sell offs on above average volume, but Elliott Wave indicates a relief rally may be in the cards near term.

Technical analysis of daily SPX prices

SPX Elliott Wave Analysis for the Week of May 22 2022

The current Elliott Wave count shows Minute [v] wave of Minor 3 should end soon (if not already), giving the SPX a chance to rally back towards the Minor 1 low (~4380).  Note that there was another positive divergence in the RSI(5), but not the MACD; similar to the set-up at the end of April.   See below for additional EW analysis that indicates the bear market may be longer and deeper than previously thought…

COMMENTARY
Another wild week. A couple of hedge funds closed their books, and a more hawkish Fed caught option traders by surprise. Then there were the earnings reports: Target and Walmart reported lower than expected margins and their stock prices were punished…as was most of the retail sector.

Many taking heads and so-called experts are pointing to a “strong” consumer as a reason to discount weakness in earnings reports. Don’t be fooled. Consumers across the globe are struggling with high inflation, and that struggle won’t show up in corporate earnings until the back half of this year.

“Sub-prime” credit data (which lags by a couple of months) shows that consumer credit card balances have already started to increase. This category of borrower is the first to feel the impact of higher inflation, and credit card can only prop up spending levels for so long. Next, expect to see delayed payments to increase (they’re already beginning to inch higher).

Best To Your Week!

P.S. After “zooming out” last week, I was asked to “zoom out” even further.  The result was “not good”, and opens the possibility that the SPX has a longer and deeper correction than most investors anticipate.  The specific question concerned Cycle I and II labels; is it possible the January peak 2022 was end of Cycle I?

Previously, the count showed the Cycle I wave ending in mid-February 2020 when COVID-19 hit, Cycle II wave ending in late March, Primary [1] of Cycle III ending in January 2022.

Technical analysis of weekly SPX prices

SPX Elliott Wave Analysis for the Week of May 22 2022

But the bull market from 2009 (i.e. Cycle I wave) was courtesy of quantitative easing and low interest rates, and those conditions didn’t end until this year.  While correlation is not causation, it does make a convincing argument.  Anecdotally, it makes sense that all of Cycle I would have a common backdrop.

Technical analysis of weekly SPX prices

SPX Elliott Wave Analysis for the Week of May 22 2022

Looking back, a new count hinges on Primary [3] and Primary [4]; between 2018 and 2020.  That period threw a lot of people off, and I STILL haven’t seen a lot of agreement on the labeling.  So it’s definitely possible that Primary [4] was some type of “flat” or “combination” wave structure, paving the way for the post-COVID rally as Primary [5], and the January peak ending Cycle I. If Cycle I did end in January, then the wave structure I’m using for the outlook is off by one level.

Technical analysis of weekly SPX prices

SPX Elliott Wave Analysis for the Week of May 22 2022

The implications are:

  1. The SPX is only halfway through the first downward wave a large bear market (Intermediate (3) wave of the Primary [A] of the Cycle II downtrend, rather than the Rather than being in the final leg of the correction/downtrend (Minor 3 of an Intermediate (C) Wave) ).
  2. When Primary [A] completes, the SPX will see a substantial bear market rally
  3. Then the SPX drops back towards pandemic lows and we’ve got another Crying Jordan on our hands

Invest Safely, LLC is an independent investment research and online financial media company.  Use of Invest Safely, LLC and any other products available through invest-safely.com are subject to our Terms of Service and Privacy Policy. Not a recommendation to buy or sell any security.
Posted in Historical Data, Market Trends | Tagged , , , , | 2 Comments

Weekend Stock Market Outlook – May 15 2022

Stock Market Outlook entering the Week of May 15th = Downtrend

    • ADX Directional Indicators: Downtrend
    • Price & Volume Action: Downtrend
    • Elliott Wave Analysis: Downtrend

ANALYSIS
The stock market outlook remains in a downtrend, with shock-waves from cryptocurrency spilling over into stocks last week.

The S&P500 ($SPX) dropped ~2.5% last week, thanks to a big reversal on Thursday and Friday. As of the close, the index needs to climb another 7.5% and 11% to reach the 50 and 200 day moving averages, respectively.

Technical analysis of daily SPX prices

SPX Price & Volume Chart for the Week of May 15 2022

The ADX remains bearish, and so does price/volume. Friday’s rally came on lower than average volume, which isn’t bullish.

Technical analysis of daily SPX prices

SPX Elliott Wave Analysis for the Week of May 15 2022

Elliott Wave still shows a bearish trend.  Big rallies in a short amount of time, like the one last week, are typical of an ongoing bear market, not a bottom.  Bottoming is a process and takes time.  We’ve noted and positive RSI divergence, so I’m watching for a confirmation from the MACD over the next few weeks, similar to the price action seen in February.

COMMENTARY
Another week, another round of volatile price movements.  And not just stocks!  It takes a steady hand and a little luck to navigate this type of market environment.  Traditional safe havens (i.e. bonds) have underperformed, while utilities and the energy sector seemingly the only game in town.

Many highly shorted companies saw their stock prices rally sharply on Thursday and Friday.  Movement like that is typical when a hedge fund unwinds an account or closes out it’s books completely.

Or, funds may have been forced to raise capital in response to the carnage in crypto.  Without diving into specifics, one of the currencies blew up.  One of the associated coins (LUNA) fell from the mid-$60’s to less than $0.01 over a few days.  That’s wealth destruction of the highest order, especially for those who went all in and ignored the concept of position and/or portfolio sizing.

On the economic front, inflation numbers (U.S. CPI) came in higher than expected…again (+8.3% YoY  vs. +8.1% expectation).  During the week, Fed Chair Powell referenced Paul Volcker when discussing his plans the fight inflation.  Paul Volcker was Fed Chair in the early 80s when the Fed raised rates to a peak of 20%.

What he didn’t mention that Volcker wasn’t on anyone’s Christmas card list.  Unemployment rose above 10% and the economy went through back to back recessions, not to mention a nasty bear market.

Eventually, market turbulence will subside and a bull market will return.  Your task is to minimize risks until that time comes (i.e. $VIX<20 for more than a few days).

Best To Your Week!

P.S. I mentioned “zooming out” on Elliott Wave last week, and added a longer-term chart below.  I’ve seen a few analysts showing the ABC zigzag pattern completing the Primary [2] wave already.  While that’s possible, it’s a low probability right now, since there’s no divergence in either the RSI or MACD to support it yet.

Technical analysis of weekly SPX prices

SPX Elliott Wave Analysis for the Week of May 15 2022


Invest Safely, LLC is an independent investment research and online financial media company.  Use of Invest Safely, LLC and any other products available through invest-safely.com are subject to our Terms of Service and Privacy Policy. Not a recommendation to buy or sell any security.
Posted in Historical Data, Market Trends | Tagged , , , , | Comments Off on Weekend Stock Market Outlook – May 15 2022

Weekend Stock Market Outlook – May 8 2022

Stock Market Outlook entering the Week of May 8th = Downtrend

    • ADX Directional Indicators: Downtrend
    • Price & Volume Action: Downtrend
    • Elliott Wave Analysis: Downtrend

ANALYSIS
The stock market outlook remains in a downtrend, with many investors experiencing bear market volatility for the first time.

From open to close, the S&P500 ($SPX) only fell 0.2% last week.  But that number fails to capture the volatility most investors felt, as the index rose 6% from Monday’s low to Wednesday’s high and then dropped almost the same amount from Thursday’s open to Friday’s session low.

Technical analysis of daily SPX prices

SPX Price & Volume Chart for the Week of May 08 2022

The ADX remains bearish, as does price/volume.

The price/volume signal remains bearish.  Last week saw elevated trading volumes across the board, but the new low on Friday eliminated any possibility of a new rally.

Technical analysis of daily SPX prices

SPX Elliott Wave Analysis for the Week of May 08 2022

Elliott Wave shows the SPX in a corrective wave pattern.  The RSI’s positive divergence continues (good), but there isn’t a confirmation from the MACD (bad). The past two weeks have a lot of volatility, so checking the counts on different time scales (e.g. weekly) is a good idea going forward.

COMMENTARY
The Fed raised rates 0.50%, as expected. At the press conference, Powell stated that 0.75% rate hikes were off the table, and stocks skyrocketed.

The question of a 0.75% rate hike seemed suspect from the beginning, since the Fed continues to provide early warnings for all moves to avoid surprises. And a 0.75% hike would have been a nasty surprise.

Then a big rally in response to squashing a rumor?  Also suspect.  Seems more like market makers and instantiations moving their hedges around, rather than a market bottom or economic data.  Sure enough, Thursday saw a massive sell-off, as whatever trade was “on” ahead of the announcement ran its course.

Regardless, this is the first bear market for many investors; basically anyone who started investing after the “Great Recession” ended.  Picking stocks is hard enough when volatility is low (i.e. VIX < 20), like it was for most of the past decade.  When volatility is high (i.e. VIX > 30), forget about it.  At those levels, it’s best to be in cash and or on the sidelines.

I don’t know when the market will turn around.  One metric I’m keeping an eye on is unemployment.  Since the Fed’s “dual mandate” is inflation and unemployment, and inflation is really high, you could assume that the Fed will continue to raise rates until either inflation comes down or unemployment goes up.

As rates rise, stock markets correct because earnings are squeezed.  When earnings are squeezed, companies cut costs (i.e. headcount).

Since there’s a high probability that unemployment will go up before inflation is reigned in, I’m watching that number (among others) as a sign that the tightening cycle has ended or at least been paused.

Happy Mother’s Day and Best To Your Week!

P.S. Be on the lookout for April inflation (CPI) numbers being released on Wednesday.


Invest Safely, LLC is an independent investment research and online financial media company.  Use of Invest Safely, LLC and any other products available through invest-safely.com are subject to our Terms of Service and Privacy Policy. Not a recommendation to buy or sell any security.
Posted in Historical Data, Market Trends | Tagged , , , , | Comments Off on Weekend Stock Market Outlook – May 8 2022

Weekend Stock Market Outlook – May 01 2022

Stock Market Outlook entering the Week of May 1st = Downtrend

    • ADX Directional Indicators: Downtrend
    • Price & Volume Action: Downtrend
    • Elliott Wave Analysis: Downtrend

ANALYSIS
The stock market outlook shows a downtrend firmly in place for the first week of May. With the Fed set to hike interest rates this week, will it be the year of “sell in May and go away”?

The S&P500 ($SPX) dropped a little more than 3% last week.  The ADX shows a strengthening trend, and the directional indicators are bearish.

Technical analysis of daily SPX prices

SPX Price & Volume Chart for the Week of May 01 2022

The price/volume signal remains bearish.  Last week saw elevated trading volumes across the board, but the new low on Friday eliminated any possibility of a new rally.

Technical analysis of daily SPX prices

SPX Elliott Wave Analysis for the Week of May 01 2022

Elliott Wave shows the SPX in a corrective wave pattern.  A positive divergence developed in the RSI on Friday, but there’s more downside risk than upside potential at this point.

COMMENTARY
As expected, the stock markets experienced a lot of volatility. Perhaps “a lot” is an understatement, considering the Volatility Index ($VIX) spent most of the week around 30.

More than 30% of the S&P500 has reported Q1 results so far, including mega-cap names like Google (Alphabet), Amazon, Apple, Facebook (Meta) and Microsoft.  Out of that group, only Facebook was able to survive their earnings release without a big sell-off.  That’s probably because the stock already had a massive sell-off in February.

The initial GDP estimate for Q1 didn’t get as much airtime as earnings, inflation, the Fed, or “Markets in Turmoil”, but it should have.  The figure came in at -1.4%:  yes…negative, as in a contraction! The expectation was growth of 1.1% verses last quarter. The year over year comparison looks even worse, considering Q1 2021 GDP grew more than 6%! I don’t care how you slice that data, it’s bad.

This week, we get another Fed meeting.  A rate hike of 0.5% is the most likely scenario at the moment.  We’ll have to see what they say about the pace of balance sheet adjustments.

Speaking of the Fed, after seeing Q1 inflation data, we know that the “transitory” label was wrong.  Now the U.S. Fed will try “catch-up” via interest rate policy and stopping bond purchases. Their plan is that higher interest rates will create financial conditions that slow down demand for goods and services, which reduces the rate of price increases, which reduces inflation readings.

Right now, the market expects that catch-up plan to include ~10 quarter-point hikes, on top of the quantitative tightening. An economy growing at ~6%, like last year (Q1 2021 GDP), could handle it. But an economy that’s already contracting? Not so much.  Many people think something will break long before than happens, and force the Fed to reverse course and cut rates again.

Remember, inflation and GDP are the two data points that you need to get right when looking for places to invest your hard earned capital.  In Q1, we had stagflation: slowing growth with rising inflation.  If inflation slows, were in for slowing growth and inflation or “disinflation”.  Historically, stocks get crushed when GDP growth and inflation are slowing down at the same time.

Hopefully you used the bear market bounce in late March to book profits and rearrange your portfolio. Or at least shifting some things around in early April.  With the Fed on a mission to squash inflation, it will be a challenging summer for investors.  One more quarter of slowing GDP and we have a recession on our hands.

Best To Your Week!


Invest Safely, LLC is an independent investment research and online financial media company.  Use of Invest Safely, LLC and any other products available through invest-safely.com are subject to our Terms of Service and Privacy Policy. Not a recommendation to buy or sell any security.
Posted in Historical Data, Market Trends | Tagged , , , , | Comments Off on Weekend Stock Market Outlook – May 01 2022

Weekend Stock Market Outlook – April 24 2022

Stock Market Outlook entering the Week of April 24th = Downtrend

    • ADX Directional Indicators: Downtrend
    • Price & Volume Action: Downtrend
    • Elliott Wave Analysis: Downtrend

ANALYSIS
As you might have guessed, the stock market outlook shifted back to a downtrend on Thursday last week.

The S&P500 ($SPX) dropped 2.7%…that’s just short of 5% in the past two weeks. The index started off well, rallying from support at the 50-day moving average to 200-day. From there, the index fell back to the 50-day on higher volume and then kept falling into the close on Friday.

Technical analysis of daily SPX prices

SPX Price & Volume Chart for the Week of April 24 2022

The ADX is still below 20, so the trend is weak, but the directional indicators are bearish.

The price/volume signal shows a downtrend in place. Institutional investors sold after late-March rally, evidenced by many distributions days during the past 5 weeks. Thursday’s session ticked the box mentioned last week, in terms of distribution days and price action needed to shift the signal.

Technical analysis of daily SPX prices

SPX Elliott Wave Analysis for the Week of April 24 2022

Elliott Wave confirmed the downtrend as well, although the Minor 2 was shorter than expected. Overall, Primary 2 is acting like zigzag corrective wave (5 waves down, 3 waves up, 5 waves down). We’ll have to see what price action is like this week, but the current Minor 3 kicked off with a lot of volatility, just like the past Minor 3 in mid-January.

COMMENTARY
The Fed continues to talk about its inflation fight, and Powell confirmed a 0.5% rate hike is on the table for May.  Based on the last announcement, he’s probably telling everyone that the Fed will hike rates 0.5%, without actually saying it.

There is a growing expectation that the Fed will hike rates until “something breaks”, and the 2022 Fed Funds Futures is pricing in 10 rate hikes.  I expect something to break before we get there, but stranger things have happened.

As you can see above, this week is jam packed with the earnings releases of companies that are widely held by all sorts of investors.  There are several names from the Dividend Aristocrats and Dividend Kings lists, as well as 4 of the 5 largest components of the S&P reporting:

  • Apple = ~7% of the index’s total value
  • Microsoft = ~6%
  • Alphabet = ~4% (Class A + Class C Shares)
  • Amazon = ~4%

If last week was any indication, we’re in for a lot of volatility this week.  Weak earnings are one thing, but lowering guidance or mentioning headwinds and slow downs will cause investors to press the sell button;  HCA Healthcare ($HCA) and Verizon ($VZ) come to mind.

If you’re looking for shelter from the inflation storm, energy, utilities, and consumer staples will probably be the “least bad”, while technology and consumer discretionary get hurt the most.

Several readers emailed me last week, commenting that their signaling process had already shifted to a downtrend and/or bearish outlook.  I think that’s fantastic! One, because they made some moves that saved them from losing money. And two, because they created a process and executed it!

This stock market outlook is just an example of how to evaluate market conditions, as well as how to make improvements over time.  It’s better than nothing, but use it as a tool to get you started.  Every investor has a different situation and different needs, so every investor needs their own process with their own signal(s) for the things they are trading.

Best To Your Week!


Invest Safely, LLC is an independent investment research and online financial media company.  Use of Invest Safely, LLC and any other products available through invest-safely.com are subject to our Terms of Service and Privacy Policy. Not a recommendation to buy or sell any security.
Posted in Historical Data, Market Trends | Tagged , , , , | Comments Off on Weekend Stock Market Outlook – April 24 2022

Weekend Stock Market Outlook – April 17 2022

Stock Market Outlook entering the Week of April 17th = Uptrend

    • ADX Directional Indicators: Downtrend
    • Price & Volume Action: Mixed
    • Elliott Wave Analysis: Mixed

ANALYSIS
The stock market outlook remains unchanged from last week; an uptrend while we wait for confirmation of a change. Short update this week, on account of the Easter Holiday.

The S&P500 ($SPX) fell 2.1% for the week, unable to break free from the pull of the 50-day moving average.

Technical analysis of daily SPX prices

SPX Price & Volume Chart for the Week of April 17 2022

The ADX remains continues to signal a downtrend with the directional indicators growing more bearish over the week.

The price/volume signal shifts from an uptrend to mixed. SPX dropped below the 50-day moving average, and also closed below the April 18 follow-through day.  Distribution days are also piling up (5), so a down day this week on elevated volume would put this signal into a downtrend, as well as the overall outlook.

Technical analysis of daily SPX prices

SPX Elliott Wave Analysis for the Week of April 17 2022

For Elliott Wave, the count remains mixed.  The bounce back to 4650 didn’t happen.  Instead, the SPX added a 5th wave down, and appears to have completed an impulse wave (rather than a corrective wave).  Which means the March 29th high was the likely end of our bear market rally.  If so, Minor Wave 2 should now take the market back towards 4650.

COMMENTARY
We got Consumer Price Index (CPI) data last week, and it showed that inflation remains high (duh).

Not to be outdone, the Producer Price Index numbers (PPI) came in at an all time high: 11.2% year-over-year!  Those increases haven’t hit consumers yet.

The “good” news, if you can call it that, is inflation has probably peaked unless there’s a massive shock. For y-o-y figures to continue rising, the price of oil needs to reach 180+.  If that happens, we’ll have things other than inflation to worry about.

Q1 earnings continue this week, with Bank of America, Tesla, and Netflix reporting.

Last week, Taiwan Semiconductor Manufacturing (TSM) crushed their numbers for the first quarter AND guided higher for Q2.  TSM gapped up at the open, and then sold off throughout the day, ending down ~3%.  If we were in a strong bull market, that wouldn’t have happened.

Best To Your Week!


Invest Safely, LLC is an independent investment research and online financial media company.  Use of Invest Safely, LLC and any other products available through invest-safely.com are subject to our Terms of Service and Privacy Policy. Not a recommendation to buy or sell any security.
Posted in Historical Data, Market Trends | Tagged , , , , | Comments Off on Weekend Stock Market Outlook – April 17 2022