Weekend Stock Market Outlook – February 12 2023

Stock Market Outlook entering the Week of February 12th = Uptrend

    • ADX Directional Indicators: Uptrend
    • Price & Volume Signals: Uptrend
    • Elliott Wave Analysis: Mixed

ANALYSIS
The stock market outlook continues in an uptrend, while looking for technical and economic support this week.

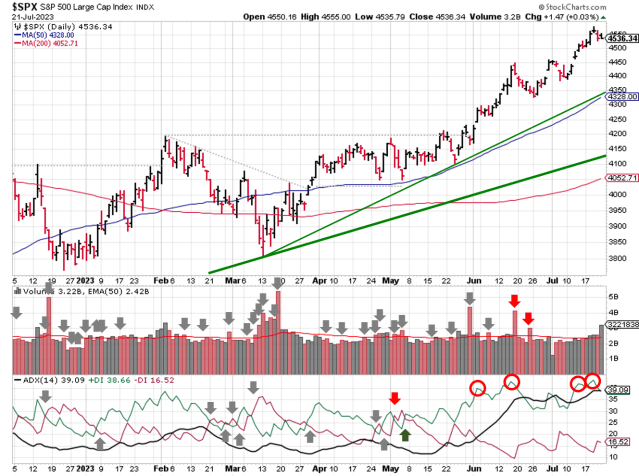
The S&P500 ($SPX) fell 1.1% last week.  The 4080 level provided a key support and resistance battleground for closing prices, going all the way back to August of 2022.  After breaking above that level early this month, the index now needs its support.  A corresponding increase in SPX volatility has the $VIX testing resistance at its 50-day moving average as well.

Technical analysis of daily SPX prices

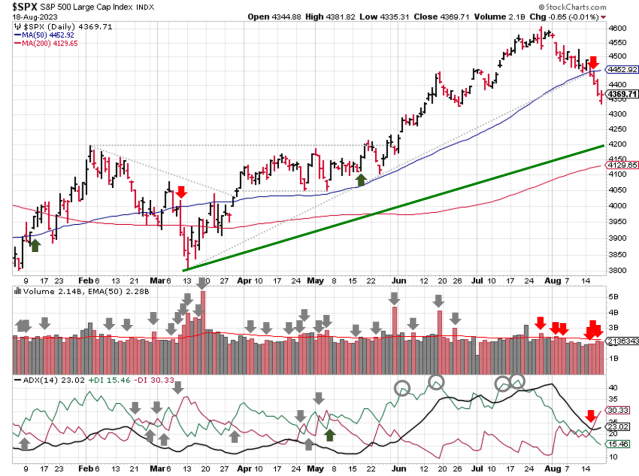
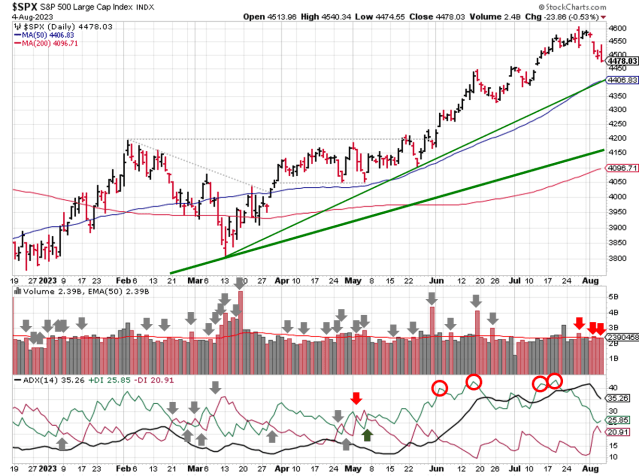
SPX Price & Volume Chart for the Week of February 12 2023

The ADX and price/volume action remains bullish despite last week’s losses.

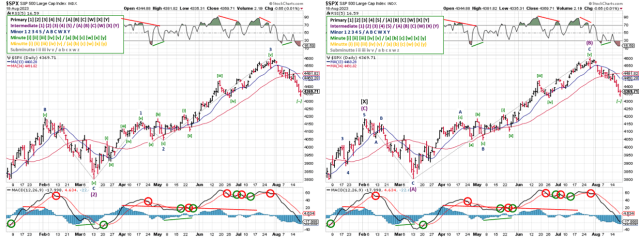
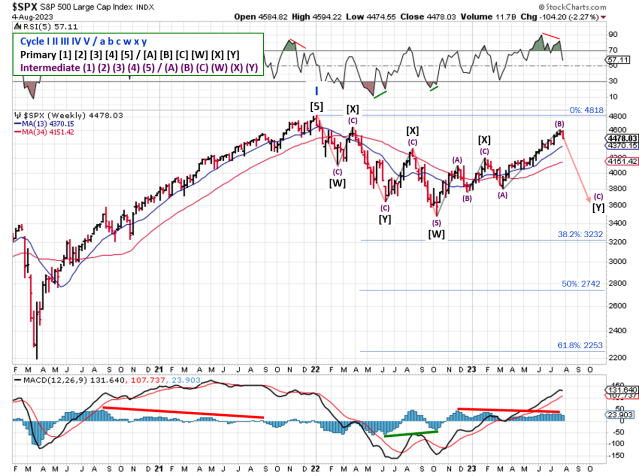
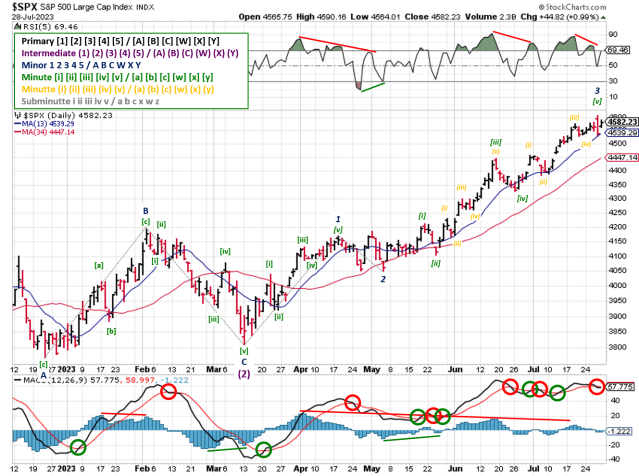
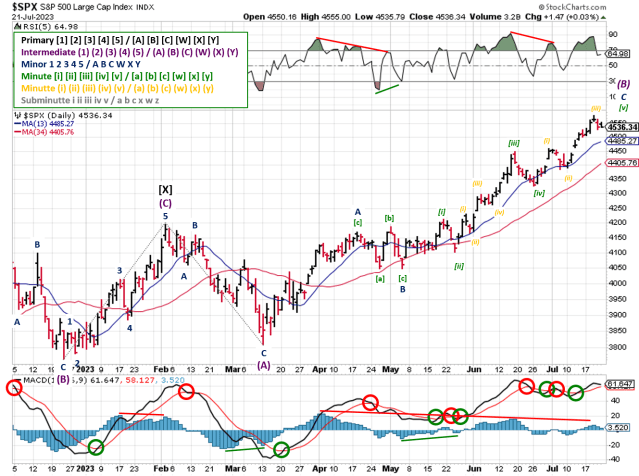
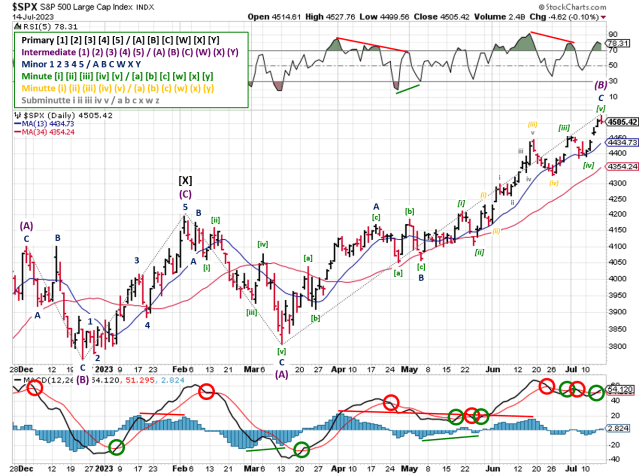
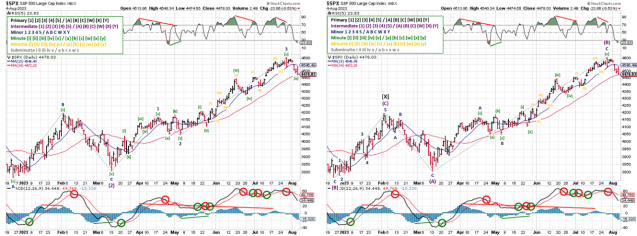
The Elliott Wave signal remains mixed, with 3 small waves clearly visible (Minutte or Subminutte).  A bearish MACD cross-over suggests further downside ahead, but less than a point of overlap isn’t enough to confirm anything.

Technical analysis of daily SPX prices

SPX Elliott Wave Analysis for the Week of February 12 2023

Key levels remain 3765 and 4325, although a move above 4195 requires another relabeling of the bearish count.

COMMENTARY
Powell’s Tuesday speech generated a bit of intraday volatility, but otherwise 0DTE options trading and earnings announcements pushed prices around.  Even within a given sector, earnings continue to be a mixed bag.  Some firms outperform ($UBER), others not so much ($LYFT).

Looking ahead to this week, on Tuesday at 8:30am, Cupid delivers the January CPI report.  If data comes in higher than estimates, equities probably head lower as the market reprices the possibility of a higher rate hike at the next Fed meeting (0.5% instead of 0.25%), and begins accepting there won’t be any rate cuts this year.  If data is lower than expected, equities ramp higher as markets price in a pause in rate hikes at the next meeting.

For what it’s worth, treasury yields (particularly the 3 month & 2 year) spiked last week, indicating that someone is betting on higher for longer.

And last but not least, another round of earnings followed by monthly options expiration on Friday.

The most anticipated earnings releases for the week are Palantir Technologies #PLTR, Coca-Cola #KO, Shopify #SHOP, Cleveland-Cliffs #CLF, Devon Energy #DVN, Airbnb #ABNB, monday.com #MNDY, Scorpio Tankers #STNG, Roblox #RBLX, and Roku #ROKU.

Earnings for the Week of February 13 2023 – Source: earningswhispers.com

Best To Your Week!

P.S. If you find this research helpful, please tell a friend.
If you don’t, tell an enemy.

Sources: Bloomberg, CNBC, Federal Reserve Bank of St. Louis, Hedgeye, T1 Alpha, U.S. Bureau of Economic Analysis, U.S. Bureau of Labor Statistics

Invest Safely, LLC is an independent investment research and online financial media company.  Use of Invest Safely, LLC and any other products available through invest-safely.com is subject to our Terms of Service and Privacy Policy.
Not a recommendation to buy or sell any security.
Posted in Historical Data, Market Trends | Tagged , , , , | Comments Off on Weekend Stock Market Outlook – February 12 2023

Weekend Stock Market Outlook – February 05 2023

Stock Market Outlook entering the Week of February 5th = Uptrend

    • ADX Directional Indicators: Uptrend
    • Price & Volume Signals: Uptrend
    • Elliott Wave Analysis: Mixed

ANALYSIS
The stock market outlook starts February with an uptrend signal.

The S&P500 ($SPX) rose 1.6% for the week.  The index sits 4.5% above the 50-day and 4.7% above the 200-day, with those moving averages putting in a golden-cross midweek.

Technical analysis of daily SPX prices

SPX Price & Volume Chart for the Week of February 05 2023

The ADX shows a strengthening bullish trend, and price/volume action indicates a high level of institutional buying last week.

The Elliott Wave signal moves to mixed, after the SPX rallied above 4100 and invalidated the prior, bearish wave count.  The two alternative counts from last week (one bearish, one bullish) are now the primary candidates.

Technical analysis of daily SPX prices

SPX Elliott Wave Analysis – Week of February 05 2023 – Bearish Count

Technical analysis of daily SPX prices

SPX Elliott Wave Analysis Week of February 05 2023 – Bullish Count

Clearly a bullish trend since October, but no confirmation of a new bull market or a continuing bear-market bounce.  Within the criteria of the example process for these blog posts, Elliott Wave isn’t providing much guidance…and serves as another of why multiple signals/duration are beneficial.  Looking ahead, a drop below 3765 is needed to invalidate the bullish Minor 3 and validate the bearish count.  Conversely, rising above 4325 invalidates the bearish Minor C.

COMMENTARY
Tuesday’s 0.25% rate hike and FOMC press conference had something for doves and hawks, bulls and bears.  The bears and hawks heard “higher for longer” and the potential for future increases. But U.S. stocks responded to Powell’s dovish statement that “financial conditions had tightened considerably”, and prices rallied on a bullish view that statement corresponded to future easing of interest rates and qualitative tightening.

Powell has another chance to manage his message this Tuesday, when he sits down for a discussion David Rubenstein at the Economic Club of Washington, D.C. (12:40pm)

Friday’s non-farm payrolls report surprised everyone to the upside; +517K jobs versus estimates of +185k.  Unemployment fell to the lowest level since 1969 (3.4%)!  Media used the numbers as proof the labor market is strong and we’re headed for a soft-landing and/or no recession.  They neglected to mention all of the adjustments that were made to the NFP data, including: the annual benchmarking process, the NAICS 2022 conversion, the updating of seasonal adjustment factors, and updated population estimates.

Underneath the economic data, market participants witnessed another record level of trading in equity options.  Thursday’s trading session, in particular, was the highest volume EVER.  As in never seen before…not during the tech bubble, not during the great recession…that kind of ever!

Without getting too technical, option activity doesn’t normally influence market pricing in a major way.  As liquidity is withdrawn from the financial system, institutional investors use leverage to compensate.  Currently, they’re exploiting a loophole in brokerage rules to add leverage to their option strategies (and options are already leveraged instruments).  The added leverage forces dealers to buy and sell an abnormally large amount of the underlying stocks and indexes, thereby abnormally influencing market volumes and pricing.  T1 Alpha has been all over the 0DTE phenomenon since October-November of 2022, and their free daily newsletter the source material for the above summary.

Meta/Facebook earnings were the star of the show last week, while Apple and Alphabet underperformed.  A similar divergence occurred in the automotive space, with GM crushing estimates and Ford missing the mark. More earnings are on the way this week, including:

The most anticipated earnings releases scheduled for the week are Enphase Energy #ENPH, PayPal #PYPL, onsemi #ON, Uber Technologies #UBER, Wal Disney #DIS, Tyson Foods #TSN, Royal Caribbean Cruises #RCL, CVS Health #CVS, Pinterest #PINS, and BP #BP.

Best To Your Week!

P.S. If you find this research helpful, please tell a friend.
If you don’t, tell an enemy.
Sources: Bloomberg, CNBC, Federal Reserve Bank of St. Louis, Hedgeye, T1 Alpha, U.S. Bureau of Economic Analysis, U.S. Bureau of Labor Statistics

Invest Safely, LLC is an independent investment research and online financial media company.  Use of Invest Safely, LLC and any other products available through invest-safely.com is subject to our Terms of Service and Privacy Policy.
Not a recommendation to buy or sell any security.
Posted in Historical Data, Market Trends | Tagged , , , , | Comments Off on Weekend Stock Market Outlook – February 05 2023

Weekend Stock Market Outlook – January 29 2023

Stock Market Outlook entering the Week of January 29th = Uptrend

    • ADX Directional Indicators: Uptrend
    • Price & Volume Signals: Uptrend
    • Elliott Wave Analysis: Downtrend

ANALYSIS
No change in the stock market outlook; an uptrend signal remains in place as we close out January.

The S&P500 ($SPX) rose 2.5%, and broke above the long-term trendline that’s acted as resistance since January 2022 (~16% decline).  The index is up 6% for the month/year, with 2 trading days left in January.  The NASDAQ was up 4.3% for the week, and sites 11% higher this month.

Technical analysis of daily SPX prices

SPX Price & Volume Chart for the Week of January 29 2023

The index found support at both the 50 and 200 day moving averages last week. The ADX and price volume signals continue to show bullish trends, and we’re seeing a low level of institutional selling (only 3 distribution days over the past 5 weeks).

Technical analysis of daily SPX prices

SPX Elliott Wave Analysis for the Week of January 29 2023

The Elliott Wave signal remains bearish; though rising above 4100 invalidates the current Minor 2 wave count.  The SPX wasn’t quite ready to head back toward the October low, putting in a head-fake 2 weeks ago and heading higher.  A second wave can retrace 100% of a Wave 1 advance, so no relabeling of the waves just yet.  Instead, two alternative counts (one bearish, one bullish) are presented at the end of the post for consideration.

COMMENTARY
So…GAME OVER bears? Sure feels that way…but feelings have no place in your investing process. So let’s look at the data.

2022 Q4 GDP showed an annualized increase of 2.9% (BEA”s “advanced” estimate). On a year-over-year basis, GDP rose +1.0% vs. 2021 Q4, which is the smallest Y/Y increase this year.

December data for Consumption Expenditures (PCE) “dropped” to +5.0% Y/Y (vs. +5.5% in November). Core PCE came in at +4.4% Y/Y, down from +4.7% in November. For some perspective, 1989 was the last time Core PCE was at these levels. Care to guess how high the interest rates were? The Fed Funds Rate averaged 9.2% in 1989 (HT Hedgeye).

So U.S. economic data releases were middle of the road; nothing REALLY good or bad. Market participants took this as a sign that the Fed will be dovish at their meeting this week, in terms of their interest rate policy, and the broader indexes rallied.

That said, a ridiculous amount of option volume didn’t hurt either; a quick look at U.S. Equity Options Volumes (NYSE), Friday’s session saw the third highest trading volume since late 2019…regardless of type (weekly, monthly, quarterly).  I suspect that the ranking applies even further back, but the data isn’t immediately available.  0DTE index options played an oversized role (again).  The takeaway is that leverage, via options, supports the recent rally, rather than underlying fundamental or economic changes.

Another big earnings week coming up.  So far, ~25% of the S&P500 has reported Q4 earnings; Sales growth is up ~5%, earnings growth is down ~3%.

The most anticipated earnings releases scheduled for the week are Amazon #AMZN, Apple #AAPL, SoFi #SOFI, AMD #AMD, Meta Platforms #META, Alphabet #GOOGL, Exxon Mobil #XOM, UPS #UPS, GM #GM, and Pfizer #PFE.

More importantly, at least from a market perspective, is the FOMC meeting this week (Tuesday) and subsequent interest rate announcement and news conference (Wednesday).

Earnings don’t move the overall market; it’s the Federal Reserve Board… focus on the central banks, and focus on the movement of liquidity… most people in the market are looking for earnings and conventional measures. It’s liquidity that moves markets.
–Stanley Druckenmiller

In my opinion, the bear market isn’t over; it’s hibernating.  But as Ed Seykota said, “The trend is your friend…until the end when it bends.”  So far, the data from January says the trend is up.

Best To Your Week!

Extended Intermediate (X) Wave (Bearish Alternative)

Primary [1] In Progress (Bullish Alternative)

P.S. If you find this research helpful, please tell a friend.
If you don’t, tell an enemy.

Sources: Bloomberg, CNBC, Federal Reserve Bank of St. Louis, Hedgeye, U.S. Bureau of Economic Analysis, U.S. Bureau of Labor Statistics

Invest Safely, LLC is an independent investment research and online financial media company.  Use of Invest Safely, LLC and any other products available through invest-safely.com is subject to our Terms of Service and Privacy Policy.
Not a recommendation to buy or sell any security.
Posted in Historical Data, Market Trends | Tagged , , , , | Comments Off on Weekend Stock Market Outlook – January 29 2023

Weekend Stock Market Outlook – January 22 2023

Stock Market Outlook entering the Week of January 22nd = Uptrend

    • ADX Directional Indicators: Uptrend
    • Price & Volume Signals: Uptrend
    • Elliott Wave Analysis: Downtrend

ANALYSIS
The stock market outlook continues with an uptrend, with 2 of 3 signals showing bullish price action.

The S&P500 ($SPX) ended the week 0.7% lower, with the long-term downtrend continuing to act as resistance.  Thanks to year-end consolidation, the SPX now has a shallow uptrend as well.

Technical analysis of daily SPX prices

SPX Price & Volume Chart for the Week of January 22 2023

In terms of moving averages, the 200-day continues to provided resistance, while the 50-day moving average switched to a support role since November.

The ADX and price volume signals continue to show bullish trends.

Technical analysis of daily SPX prices

SPX Elliott Wave Analysis for the Week of January 22 2023

The Elliott Wave signal remains bearish.  The current count suggests the beginning of a Minor 3, which would take the SPX back to the October low.  On the flip side, rallying back above 4100 would be extremely bullish and require a relabeling.

COMMENTARY
Apologies for the short/late post last week. After a weekend trip, I returned to a cold home and a busted furnace. A good reminder that owning a home has a lot of positives, but it definitely meets the definition of a liability from a personal finance perspective.

The technical set-up (noted above) looks promising, but underlying economic data isn’t keeping pace. For instance, Wednesday’s sell-off coincided with the release of December retail data, which showed sales falling 1.1% month over month. Retailers like Macy’s ($M), Kohl’s ($KSS), Nordstrom ($JWN), etc., rely heavily on the holiday season for annual profitability; so much so that “Black Friday” gets its name from the expectation that it’s the day that puts retailers into the “black” for the year (i.e. negative numbers / losses in red ink, positive numbers / profits in black ink). This year, the hope was that holiday sales would eliminate high inventory levels…profitability would be a welcome bonus.

You probably heard something about the U.S. debt-ceiling last week as well. On Thursday, the Treasury announced that the U.S. exceeded its self-imposed debt limit of $31.4 trillion. Now, the Treasury will enact so-called “extraordinary measures,” to meet financial obligations. Per the Brookings Institute, the U.S. debt ceiling has been raised 20 times since 2001…basically once a year. Since the debt ceiling comes from Congress, there’s a lot of rhetoric and posturing until the very last minute and then a deal gets pushed through. With regard to investing, it’s basically a nothing-burger until the June/July timeframe.

And on Friday, monthly options expired.  Normally, quarterly option expiration is all that’s worth mentioning (i.e. triple/quadruple witching days), but over the past year, the influence of non-quarterly opex has increased. In fact, $1.3 trillion worth of options were in play on Friday, which is the biggest non-quarterly expiration EVER.  That’s a lot of leverage, and definitely impacts volume/price movements.

Behind the scenes, so to speak, YOLO option trading has gone from retail traders to institutions, from WallStreetBets to Wall Street.  Market makers and institutions are exploiting a loophole account financing using index options; specifically the daily contracts, which are called Zero Days ‘Til Expiration or “0DTE”.

Share of 0DTE SPX Options

Source: Rocky Fishman – Goldman Sachs

If an institution opens and closes a trade intraday, no additional collateral is required because the account balance doesn’t change at the end of the day when the books are closed.  In the end, it’s another form of leverage, used to buy a levered instrument, to exploit intraday price movement, which ultimately moves intraday prices thanks to the volume of trades…what could go wrong?

Earnings season is in full swing this week, after an underwhelming start.  So far, ~10% of the S&P500 reported Q4 results.  Sales are up ~7%, while earnings are down ~6%.  Those figures broadly align with the higher prices / higher costs theme resulting from inflation. On Friday, we get December data for Consumption Expenditures (PCE); the Fed’s preferred measure of inflation.

Best To Your Week!

P.S. If you find this research helpful, please tell a friend.
If you don’t, tell an enemy.
Sources: Bloomberg, CNBC, Federal Reserve Bank of St. Louis, Hedgeye, U.S. Bureau of Economic Analysis, U.S. Bureau of Labor Statistics

Invest Safely, LLC is an independent investment research and online financial media company.  Use of Invest Safely, LLC and any other products available through invest-safely.com is subject to our Terms of Service and Privacy Policy.
Not a recommendation to buy or sell any security.
Posted in Historical Data, Market Trends | Tagged , , , , | Comments Off on Weekend Stock Market Outlook – January 22 2023

Weekend Stock Market Outlook – January 15 2023

Stock Market Outlook entering the Week of January 15th = Uptrend

    • ADX Directional Indicators: Uptrend
    • Price & Volume Signals: Uptrend
    • Elliott Wave Analysis: Downtrend

ANALYSIS
The stock market outlook flipped to an uptrend last week.

The S&P500 ($SPX) rose 2.7%, climbing past the 50-day moving average and taking aim at the 200-day.

SPX Price & Volume Chart for the Week of January 15 2023

SPX Elliott Wave Analysis for the Week of January 15 2023

The ADX signal remained in bullish territory, while price and volume moved into an uptrend on Wednesday.

Technical analysis of daily SPX prices

SPX Elliott Wave Analysis for the Week of January 15 2023

Elliott Wave analysis remains bearish.  RSI(5) shows the index is overbought, and MACD crossover is less bullish than it would appear due to low volume consolidation over the holiday period.  Reclaiming 4100 would likely change to this indicator back to bullish.

COMMENTARY
Short week (markets closed Monday in honor of MLK), short post!

Best To Your Week!

P.S. If you find this research helpful, please tell a friend.
If you don’t, tell an enemy.

Sources: Bloomberg, CNBC, Federal Reserve Bank of St. Louis, Hedgeye, U.S. Bureau of Economic Analysis, U.S. Bureau of Labor Statistics

Invest Safely, LLC is an independent investment research and online financial media company.  Use of Invest Safely, LLC and any other products available through invest-safely.com is subject to our Terms of Service and Privacy Policy.
Not a recommendation to buy or sell any security.
Posted in Historical Data, Market Trends | Tagged , , , , | Comments Off on Weekend Stock Market Outlook – January 15 2023

Weekend Stock Market Outlook – January 08 2023

Stock Market Outlook entering the Week of January 8th = Downtrend

  • ADX Directional Indicators: Uptrend
  • Price & Volume Signals: Mixed
  • Elliott Wave Analysis: Downtrend

ANALYSIS
The stock market outlook starts the week in a downtrend, but could swing to an uptrend with a bit more positive momentum.

The S&P500 ($SPX) kicked off 2023 with a win, getting back to the 50-day moving average with a gain of 1.8% during its first week of trading.  Looking back to 2022, the index ended the year down a smidge over 18%.

Technical analysis of daily SPX prices

SPX Price & Volume Chart for the Week of January 08 2023

The ADX reading flipped to bullish and price/volume starts the year mixed, thanks to Friday’s strong price action.  The move qualified as a “follow-through” on the rally attempt that started December 29th. As a reminder, a “follow-through” is defined as:

  • >1.5% price increase
  • Higher than average trading volume
  • 4-10 days after a rally start

Why “mixed” and not an uptrend?  Because the index remains below the 50-day moving average.  A move above that level on heavy volume will change the signal, and could come as soon as Monday.

Technical analysis of daily SPX prices

SPX Elliott Wave Analysis for the Week of January 08 2023

Elliott Wave analysis received an update, but remains bearish.  The set-up looks similar to the late August / early September in terms of the indicators (i.e. counter-trend rally / Minor 2, price near the 34-day moving average, MACD approaching a cross-over).

Technical analysis of weekly SPX prices

SPX Elliott Wave Analysis for the Week of January 08 2023

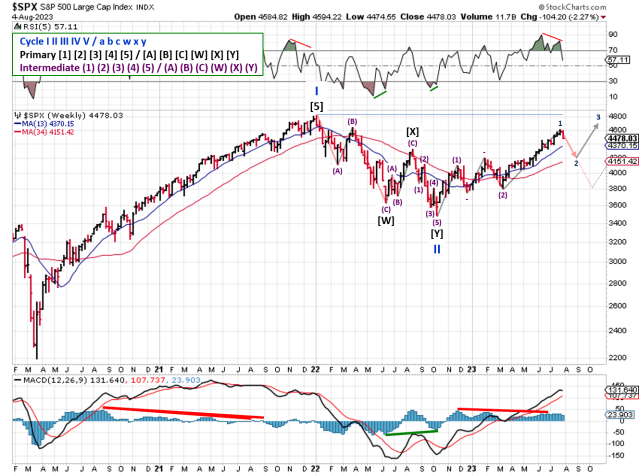
The longer-term view of Elliott Wave continues to match-up well with the wave count posted last May.

COMMENTARY
Happy New Year and a warm welcome to 2023!  We’re back in the saddle after some much needed time off.  Hopefully you used the weekly outlook to protect your capital in 2022, or at least limit the damage.  2023 promises to be a harder trading environment than last year, thanks to the coming earnings recession, elevated inflation, and reaction to Fed policy, so buckle up.

Recapping last week’s rally, Friday’s jump coincided with Non-Farm Payroll (NFP) and “ISM Services” reports. First, December Non-Farm Payrolls were higher than expected, with unemployment at a 50-year low, but down a bit from November. Sort of not too hot, not too cold.

Perhaps more importantly, December U.S. ISM Services showed a contraction in December! Per Hedgeye, one specific data point stood out: “New orders (a gauge for future demand) fell close to -20% to 45.2”! Why would a contraction be bullish? Because market participants interpreted that data as a sign the Fed will reverse interest rate hikes soon. Yes, they’re still hoping for a pivot.  And you already know hope is not an investing strategy.

If the Fed is to be believed, a pause is coming at some point this year. But one data point won’t shift the policy, even if it’s in the required direction.

Speaking of the Fed, we’ve got some event risk on tap this week, starting with Fed Chair Powell speaking at the Sveriges Riksbank International Symposium on Central Bank Independence, in Stockholm, Sweden on Tuesday.  Then on Thursday, December CPI data is released prior to market open.

And if that’s not enough, earnings season kicks off this week with heavyweights in the banking sectior: JPMorgan Chase (JPM), Bank of America (BAC), Wells Fargo (WFC) and Citigroup (C). Factset analysts expect S&P500 companies to report a combined earnings decline of -2.8% for Q4 2022 (i.e. the start of that earnings recession).

Best To Your Year!

P.S. If you find this research helpful, please tell a friend.
If you don’t, tell an enemy.

Sources: Bloomberg, CNBC, Federal Reserve Bank of St. Louis, Hedgeye, U.S. Bureau of Economic Analysis, U.S. Bureau of Labor Statistics

Invest Safely, LLC is an independent investment research and online financial media company.  Use of Invest Safely, LLC and any other products available through invest-safely.com is subject to our Terms of Service and Privacy Policy.
Not a recommendation to buy or sell any security.
Posted in Historical Data, Market Trends | Tagged , , , , | Comments Off on Weekend Stock Market Outlook – January 08 2023

Weekend Stock Market Outlook – December 18 2022

Stock Market Outlook entering the Week of December 18th = Downtrend

  • ADX Directional Indicators: Downtrend
  • Price & Volume Signals: Mixed
  • Elliott Wave Analysis: Downtrend

ANALYSIS
The stock market outlook slides back into downtrend with two weeks left in 2022. Two of the three signals are now bearish, and price/volume isn’t far behind. Considering how marginal the signal was the prior week, you probably took action already. Right?

The S&P500 ($SPX) fell ~2% last week, dropping back to the 50-day moving average, after moving above the 200-day moving average and challenging the long-term trendline earlier in the week.

Technical analysis of daily SPX prices

SPX Price & Volume Chart for the Week of December 18 2022

The ADX reading is back to bearish, after rebounding slightly.

Price and volume shifts to mixed, with the SPX looking for support at the 50-day moving average.  Friday’s trading volume comes with an asterisk, thanks to another “quadruple witching” day. 4 TRILLION dollars options expiration tends to have that effect.

Technical analysis of daily SPX prices

SPX Elliott Wave Analysis for the Week of December 18 2022

The bear market rally fell apart last week, confirming the end of the Intermediate (X), counter-trend rally. Elliott Wave analysis shows the SPX in a 3rd wave, tentatively labeled as Minute, with resistance at 3918 (Minute [i] low).

COMMENTARY
CPI data for November came in below expectations, continuing to show inflation peaked earlier this year and heading in the right direction.  Headline inflation increased 7.1% year-over-year, versus an expectation of 7.3%. Core inflation increased 6.0% , slightly below the forecast of 6.1%.  Definitely good news, but the year over year figures are still too high, opinions on Fed policy notwithstanding.

Speaking of the Fed, they raised rates by 0.50% (as did the Bank of England and the European Central Bank, in case you were wondering).  The FOMC press conference was more of the same; journalists STILL trying to tease out a timeline for the Fed to pivot (i.e. pause rate hikes or cut interest rates).

November retail sales fell more than expected, month-over-month (-0.6% vs -0.15%).  Black Friday and Cyber Monday weren’t as impactful this year, as many retailers started their sales early in an attempt to clear out inventory.  Regardless, that’s not indicative of a strong consumer, and won’t be kind to Q4 earnings.

A full week of trading this week, but expect lower trading volume as the weekend approaches.  Christmas falls on Sunday this year, so no market update next week.  The markets are closed the next day (Monday, December 26) in observance of the holiday. And New Year’s Day is the following Sunday (2 weeks from today), and the markets will be closed the following Monday (January 2) as well.

Merry Christmas, Happy Holidays, and Best To Your Week!

P.S. If you find this research helpful, please tell a friend.
If you don’t, tell an enemy.
Sources: Bloomberg, CNBC, Federal Reserve Bank of St. Louis, Hedgeye, U.S. Bureau of Economic Analysis, U.S. Bureau of Labor Statistics

Invest Safely, LLC is an independent investment research and online financial media company.  Use of Invest Safely, LLC and any other products available through invest-safely.com is subject to our Terms of Service and Privacy Policy.
Not a recommendation to buy or sell any security.
Posted in Historical Data, Market Trends | Tagged , , , , | Comments Off on Weekend Stock Market Outlook – December 18 2022