Stock Market Outlook entering the Week of June 4th = Uptrend
-
-
- ADX Directional Indicators: Uptrend
- Price & Volume Signals: Uptrend
- Elliott Wave Analysis: Mixed
-
ANALYSIS
The stock market outlook maintained an uptrend, as the S&P500 ($SPX) added 1.8% last week. That said, stocks are beginning to show overbought signals. Stay frosty, and watch your indicators for confirmation of any trend changes.

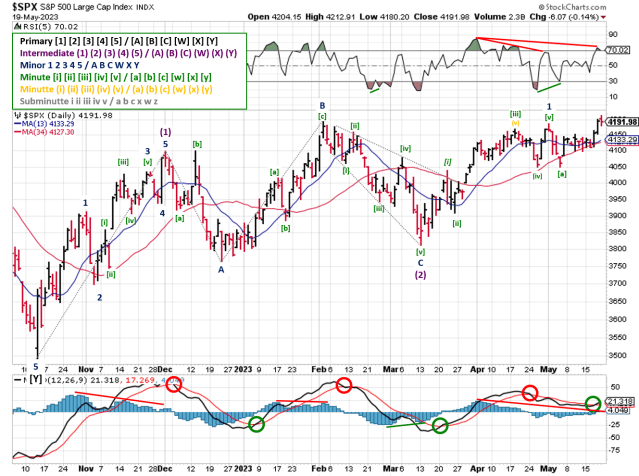
SPX Price & Volume Chart for the Week of June 4 2023
The ADX is bullish, inline with the end of May rally. The bullish directional indicator (DI+) nearing 40 is an overbought signal, and usually precedes a reversal or correction.
Price and volume remain continue to signal an uptrend as well. Index rebalancing contributed to last week’s distribution day, so it’s less impressive than the volume would suggest.3
Elliott Wave counts were in need of an overhaul in response to the push higher last month, but the signal remains mixed. Thanks to the range bound price action over the past 1.5 years, the overlapping waves made the analysis difficult at best.
One aspect of Elliott Wave that isn’t mixed is the RSI(5) indicator. Regardless of viewpoint, the RSI(5) is signaling overbought and suggests another pullback or correction is near.

SPX Elliott Wave Analysis for the Week of June 4 2023 – Bearish Count
Long term, the bearish wave count shows the SPX in the middle of a running or expanded flat pattern, which happens when price moves sideways and volatility declines. These patterns have B-wave that terminates higher than the start of the A-wave, which was the February 2nd peak at 4195. The target for Intermediate (B) is 123.6% of Intermediate (A), or 4286. For reference, a 161.8% retracement would be 4434, and the August 2022 peak was 4325.

SPX Elliott Wave Analysis for the Week of June 4 2023 – Bullish View
The long-term, bullish count shows a the market in the first Minor wave of Intermediate (3).
The daily views don’t show a negative divergence in the RSI(5) yet, suggesting that the SPX is in the middle or 3rd wave off the recent low (4100) rather than a final or 5th wave. Look for a negative divergence in the RSI to develop in the RSI as confirmation.

SPX Price & Volume Chart for the Week of June 4 2023 – Bearish View
For the bearish count, the Minute [iv] wave drops the SPX back to toward 4231 (Minute [i] peak), and then back towards 4300 to complete Minute [5] / Minor C. If the rally is truly complete, expect to that peak confirmed by a bearish MACD x-over with a week or so.

SPX Elliott Wave Analysis for the Week of June 4 2023
The price levels are the same for the bullish count, just with Minutte waves rather than Minute.
COMMENTARY
Headline employment data continues to show a relatively healthy labor market. JOLTS and NFP numbers were better than expected, although the overall unemployment was slightly higher than expected at 3.7% (+20 basis points or 0.2%). Keep in mind that employment data is a lagging indicator and typically starts to weaken AFTER the economy is already weakening. Leading indicators, such as the yield curve, are well into slowdown territory.
A light week for economic data releases, but there could be some issues below the surface of financial markets. Now that the debt ceiling is done and dusted, the U.S. Treasury should start reversing the extraordinary measures used to bridge the funding gap (i.e. drawing funds from the Treasury General Account). In other words, the government bonds need to be issued / sold, with those proceeds replenishing the TGA account balance.
Per the Financial Times, “restoring a healthy balance…will require about $750bn of Treasury bill issuance over the next 3 to 4 months”, with the total amount at ~$1 trillion. Money to buy these bonds will come out of other financial instruments, and the fear is that stocks, as an asset class, will be sold in order to fund the purchases.
Make no mistake; liquidity flows will change as a result of the offerings, and that creates volatility. The key questions are how quickly the balance sheet is restored (e.g. a few large offerings, or many small ones), and which institutions are buyers. The answers to those unknowns will determine just how much volatility our portfolio’s experience.
Best to Your Week!
P.S. If you find this research helpful, please tell a friend.
If you don’t, tell an enemy.