
Stock Market Outlook entering the Week of February 5th = Uptrend
-
- ADX Directional Indicators: Uptrend
- Price & Volume Signals: Uptrend
- Elliott Wave Analysis: Mixed
ANALYSIS
The stock market outlook starts February with an uptrend signal.
The S&P500 ($SPX) rose 1.6% for the week. The index sits 4.5% above the 50-day and 4.7% above the 200-day, with those moving averages putting in a golden-cross midweek.

SPX Price & Volume Chart for the Week of February 05 2023
The ADX shows a strengthening bullish trend, and price/volume action indicates a high level of institutional buying last week.
The Elliott Wave signal moves to mixed, after the SPX rallied above 4100 and invalidated the prior, bearish wave count. The two alternative counts from last week (one bearish, one bullish) are now the primary candidates.

SPX Elliott Wave Analysis – Week of February 05 2023 – Bearish Count

SPX Elliott Wave Analysis Week of February 05 2023 – Bullish Count
Clearly a bullish trend since October, but no confirmation of a new bull market or a continuing bear-market bounce. Within the criteria of the example process for these blog posts, Elliott Wave isn’t providing much guidance…and serves as another of why multiple signals/duration are beneficial. Looking ahead, a drop below 3765 is needed to invalidate the bullish Minor 3 and validate the bearish count. Conversely, rising above 4325 invalidates the bearish Minor C.
COMMENTARY
Tuesday’s 0.25% rate hike and FOMC press conference had something for doves and hawks, bulls and bears. The bears and hawks heard “higher for longer” and the potential for future increases. But U.S. stocks responded to Powell’s dovish statement that “financial conditions had tightened considerably”, and prices rallied on a bullish view that statement corresponded to future easing of interest rates and qualitative tightening.
Powell has another chance to manage his message this Tuesday, when he sits down for a discussion David Rubenstein at the Economic Club of Washington, D.C. (12:40pm)
Friday’s non-farm payrolls report surprised everyone to the upside; +517K jobs versus estimates of +185k. Unemployment fell to the lowest level since 1969 (3.4%)! Media used the numbers as proof the labor market is strong and we’re headed for a soft-landing and/or no recession. They neglected to mention all of the adjustments that were made to the NFP data, including: the annual benchmarking process, the NAICS 2022 conversion, the updating of seasonal adjustment factors, and updated population estimates.
Underneath the economic data, market participants witnessed another record level of trading in equity options. Thursday’s trading session, in particular, was the highest volume EVER. As in never seen before…not during the tech bubble, not during the great recession…that kind of ever!
Without getting too technical, option activity doesn’t normally influence market pricing in a major way. As liquidity is withdrawn from the financial system, institutional investors use leverage to compensate. Currently, they’re exploiting a loophole in brokerage rules to add leverage to their option strategies (and options are already leveraged instruments). The added leverage forces dealers to buy and sell an abnormally large amount of the underlying stocks and indexes, thereby abnormally influencing market volumes and pricing. T1 Alpha has been all over the 0DTE phenomenon since October-November of 2022, and their free daily newsletter the source material for the above summary.
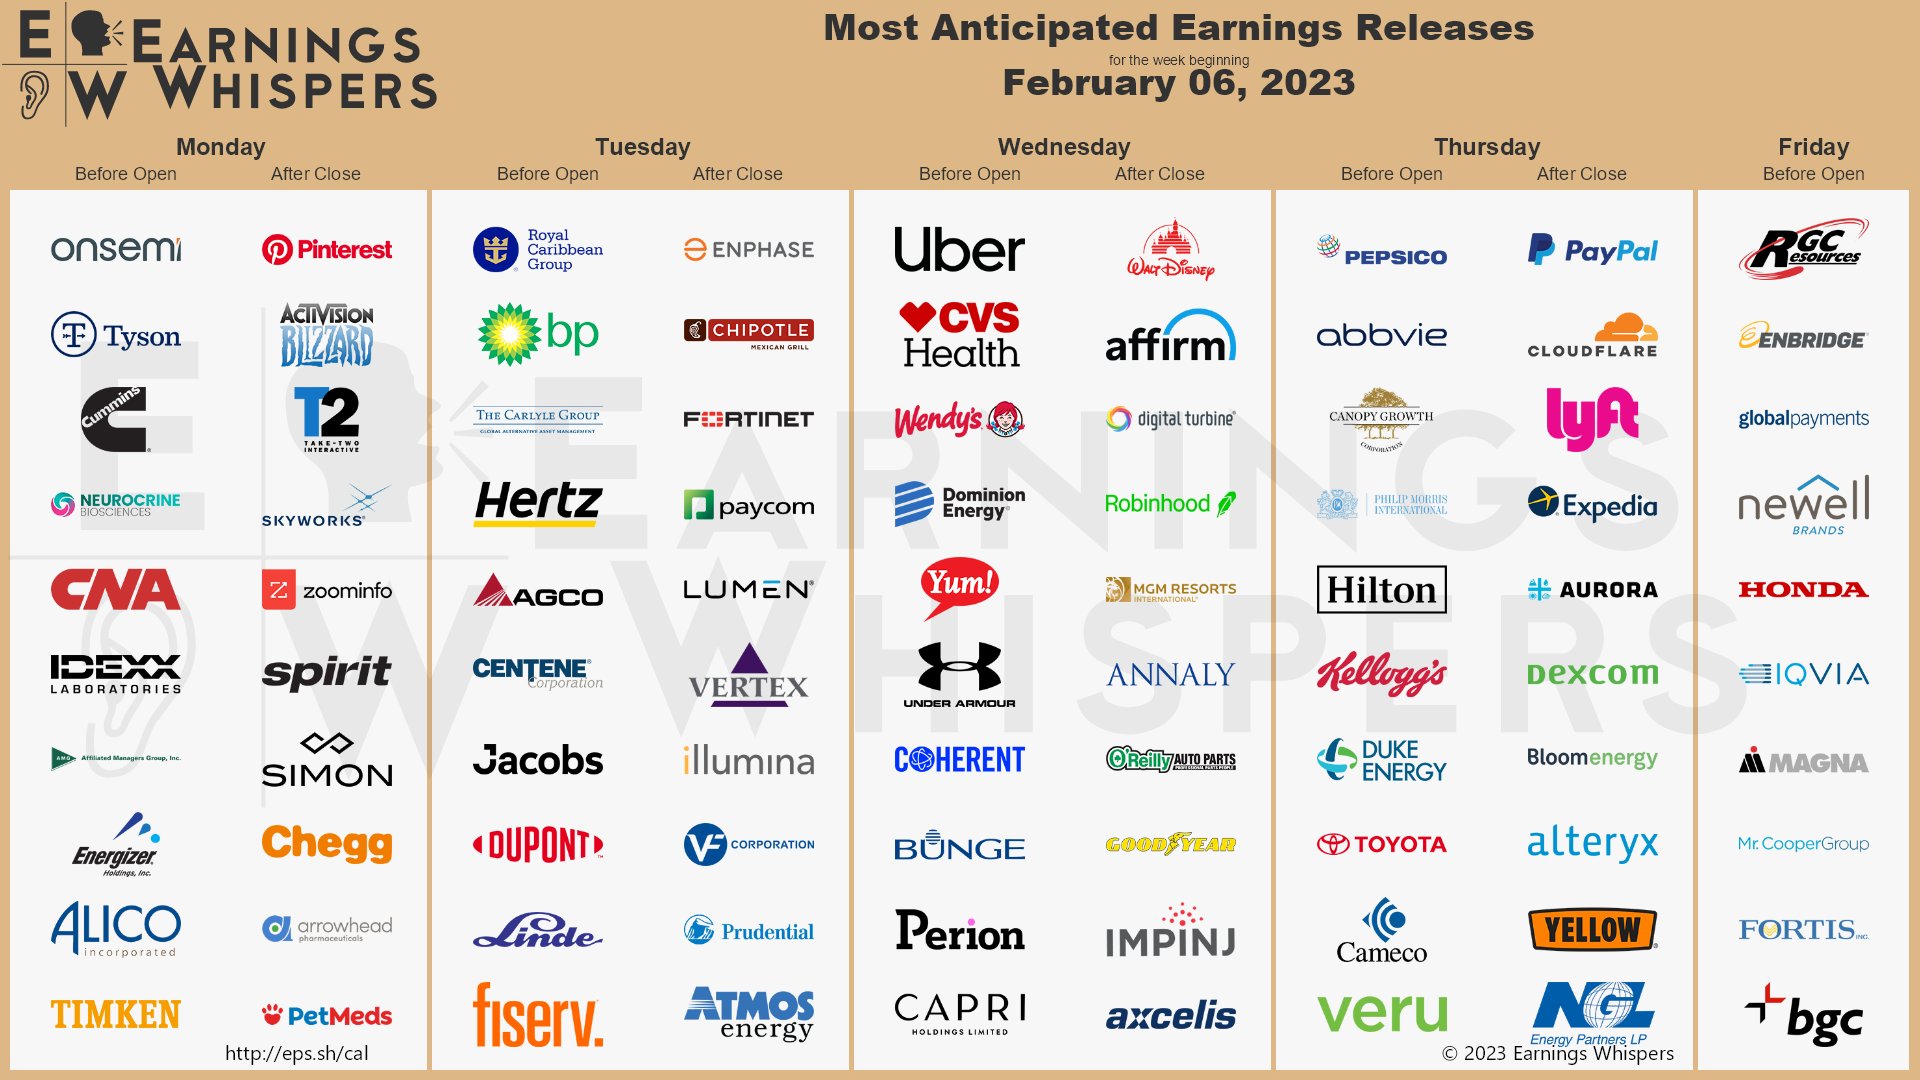
Meta/Facebook earnings were the star of the show last week, while Apple and Alphabet underperformed. A similar divergence occurred in the automotive space, with GM crushing estimates and Ford missing the mark. More earnings are on the way this week, including:
Best To Your Week!
P.S. If you find this research helpful, please tell a friend.
If you don’t, tell an enemy.


