
Stock Market Outlook entering the Week of May 21st = Uptrend
-
-
- ADX Directional Indicators: Uptrend
- Price & Volume Signals: Uptrend
- Elliott Wave Analysis: Mixed
-
ANALYSIS
The stock market outlook shifted to an uptrend last week, with the S&P rallying on talk of a U.S. debt ceiling resolution and dovish comments from the Fed chairman.
The S&P500 ($SPX) ended the week up 1.6%, after reaching a new high for the year at ~4213. Cycle to date (i.e. since the bear market began in January 2022), the index is:
-
- -13% since the cycle peak (Jan 2022)
- +20% from the cycle low (Oct 2022)

SPX Price & Volume Chart for the Week of May 21 2023
The ADX is bullish to start the week, with some signs of strengthening trend from the main indicator. Don’t read into that too much, since it’s coming off cycle lows, as well as lows for the year, and hasn’t surpassed April levels even though the index is higher (negative divergence).
Price/volume shifted to an uptrend thanks to Wednesday’s rally on “above-average” trading volume. The FFTY index continues to lag, struggling to move beyond the 50-day moving average.
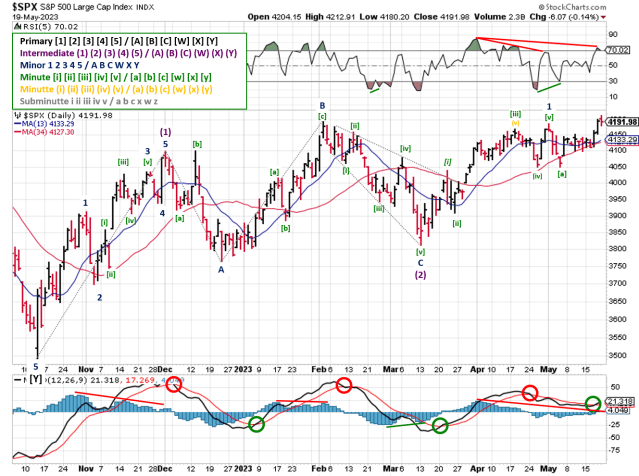
SPX Elliott Wave Analysis for the Week of May 21 2023 – Bullish Count
Elliott Wave remains mixed, but not for lack of trading action. The SPX broke the 4196 resistance level by a few points, invalidating the prior bearish count. And the MACD shows a bullish cross-over occurred mid-week. That would typically be enough to shift the signal. However, the recent consolidation / wave extensions forced updates to both the bullish and bearish counts, and neither has an edge. Even without adjustments, there’s a potential negative divergence in the MACD histogram despite the bullish cross-over, as well as the RSI(5). So the signal remains mixed.
COMMENTARY
The market signals FINALLY picked a side! Let’s see how long it lasts. The biggest concern for the stock market outlook is the index itself; specifically increasing concentration risk (i.e. a few really big companies accounting for all of the price movement).
Looking at the performance of the FFTY index (50 best “innovation”/”growth” companies) reveals that companies leading the market higher aren’t the typical “leading” stocks (i.e. small cap companies with cutting edge / innovative technology). This is mirrored in a general sense by the relative underperformance of a small cap index (i.e. Russell 2000) versus a large cap index (i.e. S&P500).
But even within large cap indexes like the S&P500, price action is driven by a handful of stocks, resulting from increasingly lopsided market cap weightings.
For instance, last week’s gains were driven by stocks within the Technology ($XLK), Communications ($XLC), and Consumer Discretionary ($XLY) sectors.
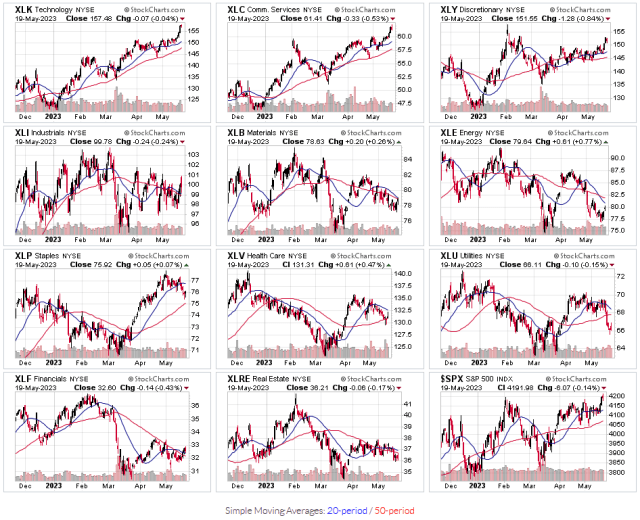
S&P Sector Price Charts for the Week of May 21 2023
Per Hedgeye, the two largest market cap stocks (Apple & Microsoft) account for 14% of $SPX’s weighting. Not to mention that Apple’s market capitalization is now greater than the entire Russell 2000 index!
And which sector is home to Apple and Microsoft? Technology ($XLK)…the best performer. In fact, 8 of the 10 largest companies in the $SPX drive performance in those 3 sectors:
- Technology ($XLK)
- Apple, Microsoft, & Nvidia ($AAPL, $MSFT, $NVDA)
- ~54% of the sector ETF
- Communications ($XLC)
- Google & Meta ($GOOG , $GOOGL, $META)
- ~51% of the sector ETF
- Consumer Discretionary ($XLY)
- Amazon & Tesla ($AMZN, $TSLA)
- ~40% of the sector ETF
Meanwhile the Energy ($XLE) and Industrial ($XLI) sectors have underperformed, price-wise, even though they’ve generated a majority of the $SPX earnings growth this year. Consumer discretionary is pulling it’s own weight so far.
But technology and communications? They’re firmly in an earnings contraction, and are where a majority of recent layoffs have been centered. Not exactly the “growth” engine you’d expect for a new bull market…
Best to Your Week!
P.S. If you find this research helpful, please tell a friend.
If you don’t, tell an enemy.


