Market Insight from JP Morgan – 2nd Quarter 2015

JP Morgan Asset Management updated their quarterly market outlook, as of March 31, 2015, for the latest installment of ‘Market Insights’.

JP Morgan Guide to the Markets

JP Morgan Guide to the Markets


Each quarter, you can find this little gem of a PDF on JP Morgan’s Asset management website, including a downloadable “Guide to the Markets” AND audio commentary.

Topics include US Equities, Economy and Fixed Income, along with an view of the International landscape and Asset Class performance.

Sources:


JP Morgan Guide to the Markets: Q2 2015
http://www.jpmorganfunds.com

Posted in Current Events, Historical Data, Investing, Market Trends, Uncategorized | Tagged , , , , , , , | Comments Off on Market Insight from JP Morgan – 2nd Quarter 2015

Weekend Market Outlook

Market Outlook entering the Week of April 5th = Uptrend @ Risk

MOVING AVERAGES

  • Short-term (20 DMA): Mixed
    With the exception of the Russell 2000, all the major stock market averages rose above, and then fell below their 20-day moving averages.
  • Intermediate (50 DMA): Mixed
    Only the Russell 2000 and NASDAQ remained above their 50-day moving averages.
  • Long-term (200 DMA): Uptrend
    All the major stock market averages remained above their 200-day moving averages

COMMENTARY
The markets struggled this week, failing to recover from last week’s losses.  That said, the shortened holiday week minimized the price movements enough to maintain last week’s Elliott Wave supporter/resistance levels for the S&P:

  • Resistance:  2,070 / 2,085
  • Support:  1,973 / 2,019
2015-04-05 - US Stock Market Averages

2015-04-05 – US Stock Market Averages

Sources:

For the detailed Elliott Wave Analysis, go to the ELLIOTT WAVE lives on by Tony Caldaro.  For price/volume data, head to stockcharts.com.

Moving Average Signals:

  • Uptrend=Market indexes remained above their moving average during the trading week
  • Downtrend=Market indexes remained below their moving average during the trading week
  • Buy signal=Market indexes fell below their moving averages during the trading week
  • Sell signal=Market indexes rose above their moving averages during the trading week
Posted in Historical Data, Market Trends, Other Blogs | Tagged , , , , , | Comments Off on Weekend Market Outlook

Weekend Reading – Personal Finance, Money Management, and Investing

Personal Finance

Money Management

  • How much cash is too much cash? (US News)

Investing

  • Income Investing – Taxable vs Tax-Deferred Accounts (DGI)
  • Growth Investing – Should I buy 1 share of Berkshire for my 401k? (Marketwatch)

Odds and Ends

  • Loves me some toggle switches – Subaru BRZ Sti Performance Concept (Jalopnik)
Interior of Subaru BRZ STI Performance Concept

Subaru BRZ STI Performance Concept

Posted in Investing, Money Management, Personal Finance | Tagged , , , , | Comments Off on Weekend Reading – Personal Finance, Money Management, and Investing

Weekend Market Outlook

Market Outlook entering the Week of March 29th = Uptrend @ Risk

MOVING AVERAGES

  • Short-term (20 DMA): Sell Signal
    All the major stock market averages fell below their 20-day moving averages
  • Intermediate (50 DMA): Sell Signal
    Three of the five major stock market averages fell below their 50-day moving averages
  • Long-term (200 DMA): Uptrend
    All the major stock market averages remained above their 200-day moving averages

COMMENTARY
Another week, another flip-flop; seems more like U.S. politics than U.S. stock market.  As discussed, the NYSE, DJIA, and S&P500 couldn’t rise above their February peaks, with those levels triggering high volume sell offs. With the reversal from last week’s uptrend outlook comes new supporter/resistance levels for the S&P:

  • Resistance:  2,070 / 2,085
  • Support:  1,973 / 2,019

March was a rough month for investing in U.S. stocks.  Remember to keep your losses small!

2015-03-29 - US Stock Market Average Candlestick Charts

2015-03-29 – US Stock Market Averages

Sources:

For the detailed Elliott Wave Analysis, go to the ELLIOTT WAVE lives on by Tony Caldaro.  For price/volume data, head to stockcharts.com.

Moving Average Signals:

  • Uptrend=Market indexes remained above their moving average during the trading week
  • Downtrend=Market indexes remained below their moving average during the trading week
  • Buy signal=Market indexes fell below their moving averages during the trading week
  • Sell signal=Market indexes rose above their moving averages during the trading week
Posted in Historical Data, Market Trends, Other Blogs | Tagged , , , , , | Comments Off on Weekend Market Outlook

Weekend Reading – Personal Finance, Money Management, and Investing

Personal Finance

  • Society of Grown-Ups – Couples Finance (Yahoo)

Money Management

  • Low Interest Rates?  Get Used to Them (Bloomberg)

Investing

  • Income Investing – Do stock charts help income investors? (DGI)
  • Growth Investing – Old age doesn’t kill bull markets (Dr. Yardeni.com)

Odds and Ends

  • Lamborghinis (Wired)


Blank and White Lamborghini Models

Every Lamborghini Model Ever in One Pic | PartCatalog.com


Posted in Investing, Money Management, Personal Finance | Tagged , , , , | Comments Off on Weekend Reading – Personal Finance, Money Management, and Investing

Weekend Market Outlook

Market Outlook entering the Week of March 22nd = Uptrend

MOVING AVERAGES

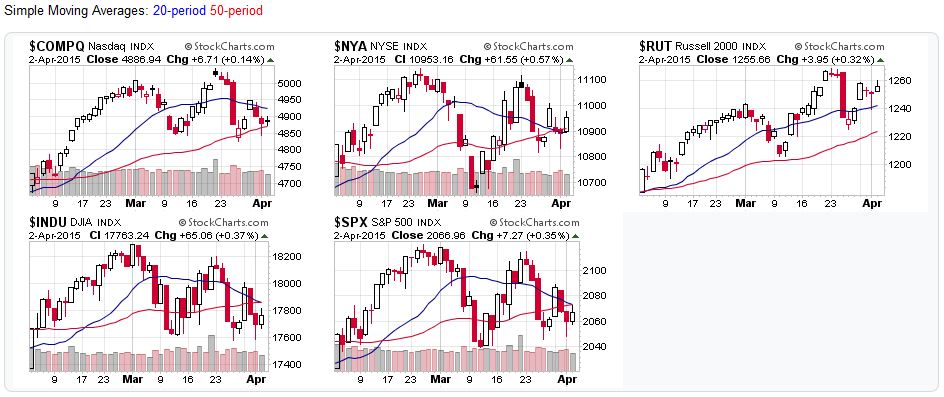
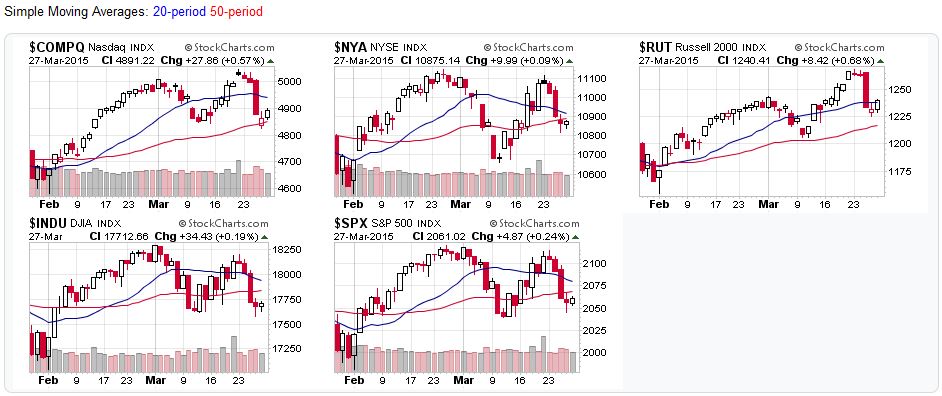
  • Short-term (20 DMA): Buy Signal
    All the major stock market averages rose above their 20-day moving averages, except for the Russell 2000 (remained above the 20 DMA)
  • Intermediate (50 DMA): Buy Signal / Uptrend
    All the major stock market averages either rose above or remained above their 50-day moving averages
  • Long-term (200 DMA): Uptrend
    All the major stock market averages remained above their 200-day moving averages

COMMENTARY
U.S. equities finally closed out a week with a strong performance.  All the indexes resumed their uptrends, despite all the recent, high-volume selling.  That said, I’m interesting in seeing next week’s price action for the NYSE, DJIA, and S&P500.  All three still have to rise above their late February peaks, which could provide some resistance to further price increases.

With the renewed uptrend, resistance levels from last week’s intermediate-term Elliott Wave Analysis became this week’s support:

  • Resistance: 2,131 / 2,198
  • Support:  2,070 / 2,085
2015-03-22 - US Stock Market Averages

2015-03-22 – US Stock Market Averages

Sources:

For the detailed Elliott Wave Analysis, go to the ELLIOTT WAVE lives on by Tony Caldaro.  For price/volume data, head to stockcharts.com.

Moving Average Signals:

  • Uptrend=Market indexes remained above their moving average during the trading week
  • Downtrend=Market indexes remained below their moving average during the trading week
  • Buy signal=Market indexes fell below their moving averages during the trading week
  • Sell signal=Market indexes rose above their moving averages during the trading week
Posted in Historical Data, Market Trends, Other Blogs | Tagged , , , , , | Comments Off on Weekend Market Outlook

Weekend Reading – Personal Finance, Money Management, and Investing

Personal Finance

Money Management

Investing

  • Income Investing – 39 Dividend Champions to Investigate (DGI)
  • Growth Investing – Cyclical Bear or Secular Bull Market? (The Big Picture)

Odds and Ends

  • Yes, please – Part 2 – 2016 Maserati Alfieri (C&D)
Silver 2016 Maserati Alfieri Concept Front Passenger Side

Maserati Alfieri Concept – Coming to a Showroom near you in 2016?!


Posted in Investing, Money Management, Personal Finance | Tagged , , , , | Comments Off on Weekend Reading – Personal Finance, Money Management, and Investing