
Market Outlook entering the Week of April 5th = Uptrend @ Risk
MOVING AVERAGES
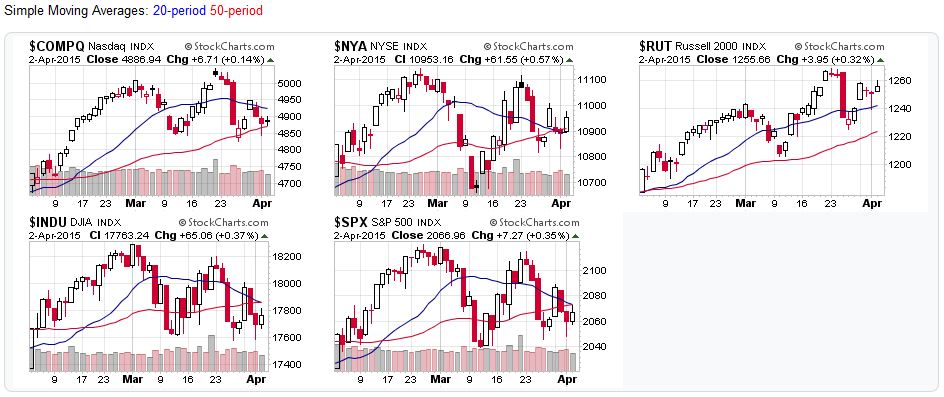
- Short-term (20 DMA): Mixed
With the exception of the Russell 2000, all the major stock market averages rose above, and then fell below their 20-day moving averages.
- Intermediate (50 DMA): Mixed
Only the Russell 2000 and NASDAQ remained above their 50-day moving averages.
- Long-term (200 DMA): Uptrend
All the major stock market averages remained above their 200-day moving averages
COMMENTARY
The markets struggled this week, failing to recover from last week’s losses. That said, the shortened holiday week minimized the price movements enough to maintain last week’s Elliott Wave supporter/resistance levels for the S&P:
- Resistance: 2,070 / 2,085
- Support: 1,973 / 2,019
2015-04-05 – US Stock Market Averages
Sources:
For the detailed Elliott Wave Analysis, go to the ELLIOTT WAVE lives on by Tony Caldaro. For price/volume data, head to stockcharts.com.
Moving Average Signals:
- Uptrend=Market indexes remained above their moving average during the trading week
- Downtrend=Market indexes remained below their moving average during the trading week
- Buy signal=Market indexes fell below their moving averages during the trading week
- Sell signal=Market indexes rose above their moving averages during the trading week


