
Market Outlook entering the Week of March 29th = Uptrend @ Risk
MOVING AVERAGES
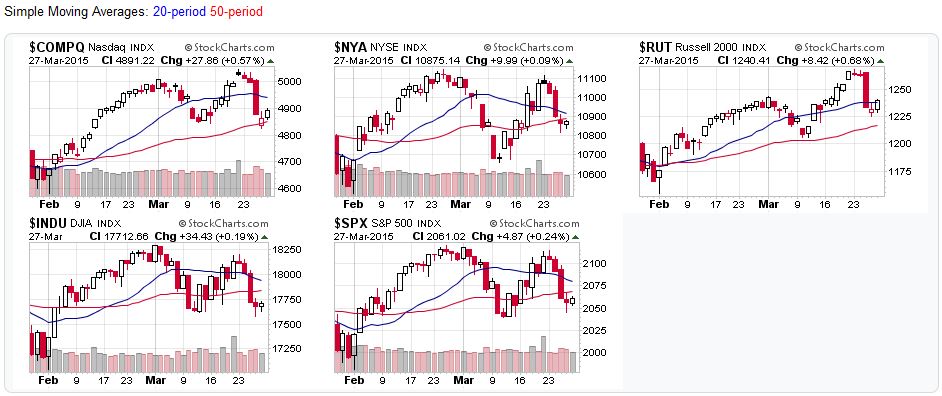
- Short-term (20 DMA): Sell Signal
All the major stock market averages fell below their 20-day moving averages
- Intermediate (50 DMA): Sell Signal
Three of the five major stock market averages fell below their 50-day moving averages
- Long-term (200 DMA): Uptrend
All the major stock market averages remained above their 200-day moving averages
COMMENTARY
Another week, another flip-flop; seems more like U.S. politics than U.S. stock market. As discussed, the NYSE, DJIA, and S&P500 couldn’t rise above their February peaks, with those levels triggering high volume sell offs. With the reversal from last week’s uptrend outlook comes new supporter/resistance levels for the S&P:
- Resistance: 2,070 / 2,085
- Support: 1,973 / 2,019
March was a rough month for investing in U.S. stocks. Remember to keep your losses small!
2015-03-29 – US Stock Market Averages
Sources:
For the detailed Elliott Wave Analysis, go to the ELLIOTT WAVE lives on by Tony Caldaro. For price/volume data, head to stockcharts.com.
Moving Average Signals:
- Uptrend=Market indexes remained above their moving average during the trading week
- Downtrend=Market indexes remained below their moving average during the trading week
- Buy signal=Market indexes fell below their moving averages during the trading week
- Sell signal=Market indexes rose above their moving averages during the trading week


