Weekend Market Outlook

Market Outlook entering the Week of June 7th = Mixed
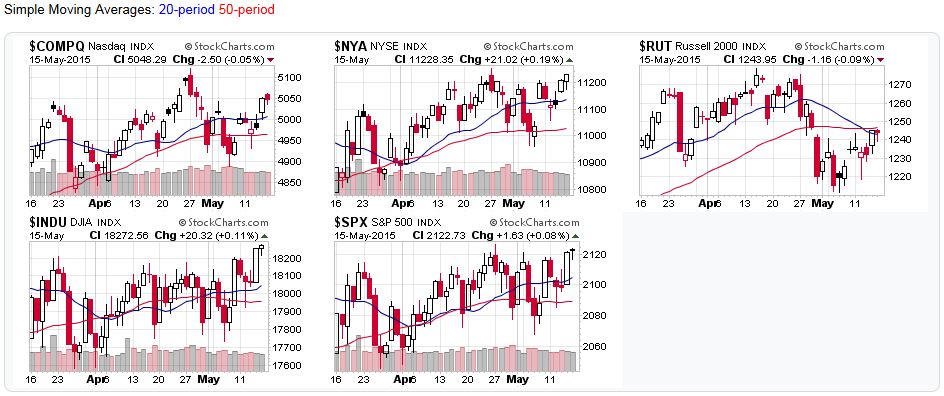
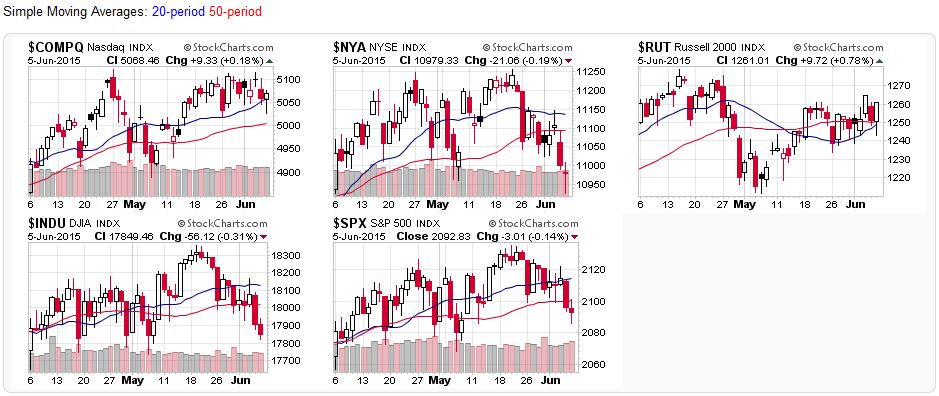
MOVING AVERAGES

  • Short-term (20 DMA): Downtrend
    3 of 5 major stock market averages remained below their 20-day moving averages.  Only the NASDAQ and Russell 2000 remained above this level.
  • Intermediate (50 DMA): Downtrend
    3 of 5 major stock market averages remained below their 50-day moving averages. Only the NASDAQ and S&P 500 remained above this level.
  • Long-term (200 DMA): Uptrend
    All the major stock market averages remained above their 200-day moving averages

COMMENTARY
Price-volume continues to show an uptrend, albeit a weak one, thanks to Friday’s positive performance.  That said, we’ve seen several days of high volume selling…one more large drop would be enough to move the markets into a correction.

Intermediate support/resistance levels from Objective Elliott Wave analysis remains unchanged for a 7th straight week!  Commentary suggests that we’ll be testing the support levels shortly.

  • Resistance:  2,131/ 2,198
  • Support:  2,070 / 2,085
2015-06-07 - US Stock Market Averages2015-06-07 - US Stock Market Averages

2015-06-07 – US Stock Market Averages

Sources:

For the detailed Elliott Wave Analysis, go to the ELLIOTT WAVE lives on by Tony Caldaro.  For price/volume data, head to stockcharts.com.

Moving Average Signals:

  • Uptrend=Market indexes remained above their moving average during the trading week
  • Downtrend=Market indexes remained below their moving average during the trading week
  • Buy signal=Market indexes fell below their moving averages during the trading week
  • Sell signal=Market indexes rose above their moving averages during the trading week
Posted in Historical Data, Market Trends, Other Blogs | Tagged , , , , , | Comments Off on Weekend Market Outlook

Weekend Reading – Personal Finance, Money Management, and Investing

Personal Finance

Money Management

Investing

  • Income Investing – Successful Dividend Investing (DGI)
  • Growth Investing – Markets remain Overvalued (Advisor Perspectives)

Odds and Ends

  • Noise from the Mustang GT350R will rip your face off (Jalopnik)
Silver 2015 Shelby GT350 Mustang

2015 Shelby GT350 Mustang | Source: Jalopnik.com


Posted in Investing, Money Management, Personal Finance | Tagged , , , , | Comments Off on Weekend Reading – Personal Finance, Money Management, and Investing

Weekend Market Outlook

Market Outlook entering the Week of May 31st = Mixed

MOVING AVERAGES

  • Short-term (20 DMA): Sell Signal
    3 of 5 major stock market averages fell below their 20-day moving averages.  Only the NASDAQ and Russell 2000 remained above this level.
  • Intermediate (50 DMA): Sell Signal
    3 of 5 major stock market averages fell below their 50-day moving averages. Only the NASDAQ and S&P 500 remained above this level.
  • Long-term (200 DMA): Uptrend
    All the major stock market averages remained above their 200-day moving averages

COMMENTARY
The market continues to vascillate in a fairly tight range.  Price-volume action shows some selling pressure, but not enough to warrant a change in market outlook.  Objective Elliott Wave analysis shows intermediate support/resistance levels for the S&P500 remain unchanged for a 6th straight week.

  • Resistance:  2,131/ 2,198
  • Support:  2,070 / 2,085

Tony C. summed of the recent price movements nicely:

For the past three months this market has been a day traders dream. It has spent three months within a 95 point trading range: mostly drifting to the upside with several larger pullbacks along the way. From an Elliott Wave perspective it has been somewhat of a nightmare.

2015-05-30 - US Stock Market Averages

2015-05-30 – US Stock Market Averages

Sources:

For the detailed Elliott Wave Analysis, go to the ELLIOTT WAVE lives on by Tony Caldaro.  For price/volume data, head to stockcharts.com.

Moving Average Signals:

  • Uptrend=Market indexes remained above their moving average during the trading week
  • Downtrend=Market indexes remained below their moving average during the trading week
  • Buy signal=Market indexes fell below their moving averages during the trading week
  • Sell signal=Market indexes rose above their moving averages during the trading week
Posted in Historical Data, Market Trends, Other Blogs | Tagged , , , , , | Comments Off on Weekend Market Outlook

Weekend Reading – Personal Finance, Money Management, and Investing

Personal Finance

  • American Net Worth by Age (Fool)

Money Management

  • The Ups and Downs of Personal Finance (JPMorgan)

Investing

Odds and Ends

Blue Ford GT

New Ford GT | Motorsport.com


Posted in Investing, Money Management, Personal Finance | Tagged , , , , | Comments Off on Weekend Reading – Personal Finance, Money Management, and Investing

Weekend Market Outlook

Market Outlook entering the Week of May 24th = Uptrend

MOVING AVERAGES

  • Short-term (20 DMA): Uptrend
    All the major stock market averages remained above their 20-day moving averages.
  • Intermediate (50 DMA): Uptrend
    All the major averages rose/remained above their 50-day moving averages.
  • Long-term (200 DMA): Uptrend
    All the major stock market averages remained above their 200-day moving averages

COMMENTARY
Price volume action remained positive, maintaining this week’s positive outlook.  The Russell 2000 retook the 50-day average, and the other indexes held the line, so to speak.

Objective Elliott Wave analysis shows intermediate support/resistance levels for the S&P500 remain unchanged for a 5th straight week.

  • Resistance:  2,131/ 2,198
  • Support:  2,070 / 2,085

Sources:

For the detailed Elliott Wave Analysis, go to the ELLIOTT WAVE lives on by Tony Caldaro.  For price/volume data, head to stockcharts.com.

Moving Average Signals:

  • Uptrend=Market indexes remained above their moving average during the trading week
  • Downtrend=Market indexes remained below their moving average during the trading week
  • Buy signal=Market indexes fell below their moving averages during the trading week
  • Sell signal=Market indexes rose above their moving averages during the trading week
Posted in Historical Data, Market Trends, Other Blogs | Tagged , , , , , | Comments Off on Weekend Market Outlook

Memorial Day Weekend Reading – Personal Finance, Money Management, and Investing

Personal Finance

  • Behind in your retirement savings?  Here’s what to do… (Alpha Baskets)

Money Management

Investing

  • Income Investing – Stock Analysis – TJX (DGI)
  • Growth Investing – Robo Rick Ferri (ETF.com)

Odds and Ends

Grey 2016 Camaro RS

2016 Camaro RS – Source: GM Authority


Posted in Investing, Money Management, Personal Finance | Tagged , , , , | Comments Off on Memorial Day Weekend Reading – Personal Finance, Money Management, and Investing

Weekend Market Outlook

Market Outlook entering the Week of May 17th = Uptrend

MOVING AVERAGES

  • Short-term (20 DMA): Buy Signal
    All the major stock market averages ended the week above their 20-day moving averages.
  • Intermediate (50 DMA): Uptrend
    Except for the Russell 2000, all the major averages remained above their 50-day moving averages.
  • Long-term (200 DMA): Uptrend
    All the major stock market averages remained above their 200-day moving averages

COMMENTARY
Price volume action was positive last week, indicating that a new uptrend started last week and switching the market outlook back to an uptrend.

Small caps (aka the Russell 2000) prices still lag, relative to other other indexes, but are recovering.

Objective Elliott Wave analysis shows intermediate support/resistance levels for the S&P500 remain unchanged for a 4th straight week.

  • Resistance:  2,131/ 2,198
  • Support:  2,070 / 2,085
2015-05-17 - US Stock Market Averages

2015-05-17 – US Stock Market Averages

Sources:

For the detailed Elliott Wave Analysis, go to the ELLIOTT WAVE lives on by Tony Caldaro.  For price/volume data, head to stockcharts.com.

Moving Average Signals:

  • Uptrend=Market indexes remained above their moving average during the trading week
  • Downtrend=Market indexes remained below their moving average during the trading week
  • Buy signal=Market indexes fell below their moving averages during the trading week
  • Sell signal=Market indexes rose above their moving averages during the trading week
Posted in Historical Data, Market Trends, Other Blogs | Tagged , , , , , | Comments Off on Weekend Market Outlook