
Market Outlook entering the Week of May 17th = Uptrend
MOVING AVERAGES
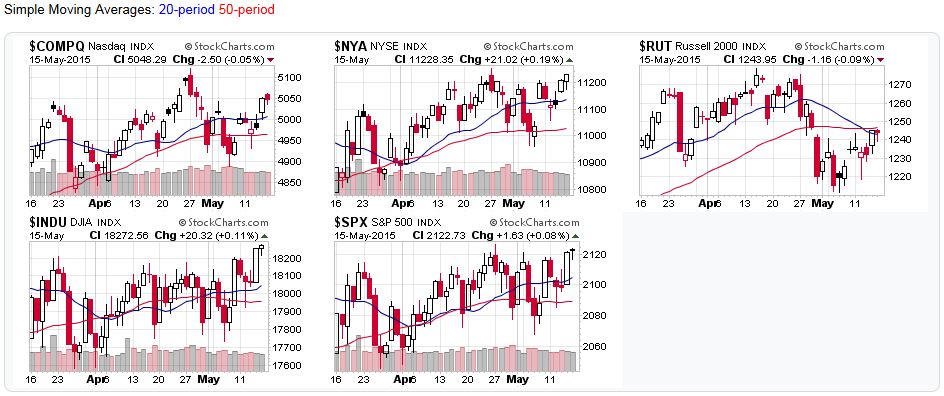
- Short-term (20 DMA): Buy Signal
All the major stock market averages ended the week above their 20-day moving averages.
- Intermediate (50 DMA): Uptrend
Except for the Russell 2000, all the major averages remained above their 50-day moving averages.
- Long-term (200 DMA): Uptrend
All the major stock market averages remained above their 200-day moving averages
COMMENTARY
Price volume action was positive last week, indicating that a new uptrend started last week and switching the market outlook back to an uptrend.
Small caps (aka the Russell 2000) prices still lag, relative to other other indexes, but are recovering.
Objective Elliott Wave analysis shows intermediate support/resistance levels for the S&P500 remain unchanged for a 4th straight week.
- Resistance: 2,131/ 2,198
- Support: 2,070 / 2,085
2015-05-17 – US Stock Market Averages
Sources:
For the detailed Elliott Wave Analysis, go to the ELLIOTT WAVE lives on by Tony Caldaro. For price/volume data, head to stockcharts.com.
Moving Average Signals:
- Uptrend=Market indexes remained above their moving average during the trading week
- Downtrend=Market indexes remained below their moving average during the trading week
- Buy signal=Market indexes fell below their moving averages during the trading week
- Sell signal=Market indexes rose above their moving averages during the trading week


