Weekend Stock Market Outlook

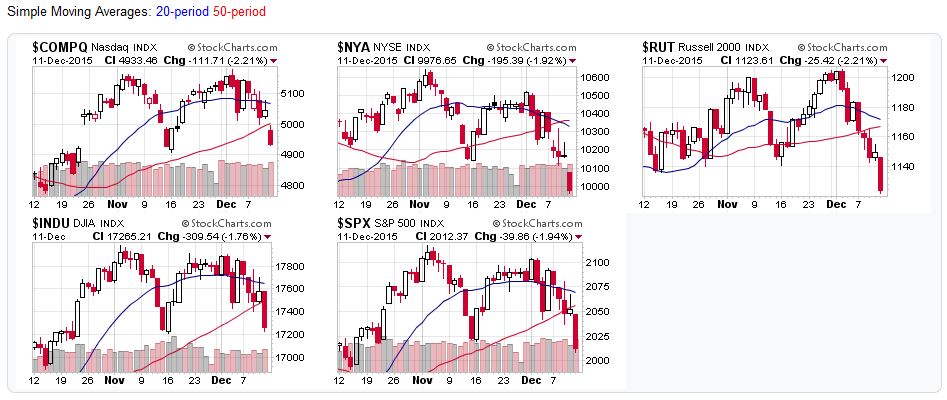
Stock Market Outlook entering the Week of December 20th = Downtrend

MOVING AVERAGES

  • Short-term (20 DMA): Downtrend
    All the major stock market averages ended the week below their 20-day moving averages.
  • Intermediate (50 DMA): Downtrend
    All the major stock market averages ended the week below their 50-day moving averages.
  • Long-term (200 DMA): Downtrend
    All major stock market averages ended the week below their 200-day moving averages.

COMMENTARY
Last Friday was a “quadruple witching day” for the US market.  With something like $1.1 trillion of S&P 500 options expiring, volatility was a given.  Unfortunately price movement was to the downside, and not even the mid-week, Fed rate hike rally could help.

Price/volume and OEW are both leaning towards a downtrend, but nothing is completely confirmed at this point.  Until the market shows some signs of strength, it’s best to remain cautious and protect your capital.

2015-12-20 - US Stock Market Averages

2015-12-20 – US Stock Market Averages

For the detailed Elliott Wave Analysis, go to the ELLIOTT WAVE lives on by Tony Caldaro.  For price/volume data, head to stockcharts.com.

Moving Average Signals:

  • Uptrend=Market indexes remained above their moving average during the trading week
  • Downtrend=Market indexes remained below their moving average during the trading week
  • Buy signal=Market indexes rose above their moving averages during the trading week
  • Sell signal=Market indexes fell below their moving averages during the trading week
Posted in Historical Data, Market Trends, Other Blogs | Tagged , , , , , | Comments Off on Weekend Stock Market Outlook

Weekend Stock Market Outlook

Stock Market Outlook entering the Week of December 13th = Downtrend

MOVING AVERAGES

  • Short-term (20 DMA): Downtrend
    All the major stock market averages fell below their 20-day moving averages.
  • Intermediate (50 DMA): Downtrend
    All the major stock market averages fell below their 50-day moving averages.
  • Long-term (200 DMA): Downtrend
    All major stock market averages fell or remained below their 200-day moving averages.

COMMENTARY
Last week saw a continuation of bearish market action, with stocks taking a major beating on Friday.  Price/volume action, as well as OEW both confirm that a correction has taken hold, which is the bad news.

The good news?  The bull market that won’t die will do just that, extending into 2016.

2015-12-13 - US Stock Market Averages

2015-12-13 – US Stock Market Averages

For the detailed Elliott Wave Analysis, go to the ELLIOTT WAVE lives on by Tony Caldaro.  For price/volume data, head to stockcharts.com.

Moving Average Signals:

  • Uptrend=Market indexes remained above their moving average during the trading week
  • Downtrend=Market indexes remained below their moving average during the trading week
  • Buy signal=Market indexes rose above their moving averages during the trading week
  • Sell signal=Market indexes fell below their moving averages during the trading week
Posted in Historical Data, Market Trends, Other Blogs | Tagged , , , , , | Comments Off on Weekend Stock Market Outlook

Weekend Stock Market Outlook

Stock Market Outlook entering the Week of December 6th = Medium-term uptrend

MOVING AVERAGES

  • Short-term (20 DMA): Uptrend 
    All the major stock market averages closed above their 20-day moving averages.
  • Intermediate (50 DMA): Uptrend
    4 of the 5 the major stock market averages remained above  their 50-day moving averages, and the NYSE closed above that mark by Friday.
  • Long-term (200 DMA): Mixed 
    3 of the 5 major stock market averages remained above their 200-day moving averages.

COMMENTARY
Last week had a lot of volatility, which has interesting implications on the length of the current uptrend.

Thursday saw a very bearish move, with the S&P500 taking out the 200-day moving average on high trading volume.  Friday answered with a bullish move, allowing the S&P500 to retake the 200-day moving average, albeit on slightly lower trading volume.

Per OEW, there are two likely scenarios:

  • If Thursdays action continues, we’re likely to see another correction, which would delay the end of the current bull market until we have another chance to test all-time highs (probably sometime in 2016).
  • If Friday’s action continues, we’re likely to see new highs in the next few weeks, which could spell the end of current bull market shortly thereafter.

Given the recent number of distribution days, the coming interest rate hike, and the normal, end-of-year tax loss harvesting, I think we’ll see a correction, and then the bull market extend into 2016.

But it doesn’t matter what I think.  Be prepared for either situation; update your watch list for good buying opportunities, and keep you losses small for current holdings.

2015-12-06 - US Stock Market Averages

2015-12-06 – US Stock Market Averages

For the detailed Elliott Wave Analysis, go to the ELLIOTT WAVE lives on by Tony Caldaro.  For price/volume data, head to stockcharts.com.

Moving Average Signals:

  • Uptrend=Market indexes remained above their moving average during the trading week
  • Downtrend=Market indexes remained below their moving average during the trading week
  • Buy signal=Market indexes rose above their moving averages during the trading week
  • Sell signal=Market indexes fell below their moving averages during the trading week
Posted in Historical Data, Market Trends, Other Blogs | Tagged , , , , , | Comments Off on Weekend Stock Market Outlook

Weekend Market Outlook

Market Outlook entering the Week of November 29th = Medium-term uptrend

MOVING AVERAGES

  • Short-term (20 DMA): Uptrend 
    All the major stock market averages remained above their 20-day moving averages.
  • Intermediate (50 DMA): Uptrend
    All the major stock market averages (NYSE & Russell 2000) remained above  their 50-day moving averages.
  • Long-term (200 DMA): Mixed 
    3 of the 5 major stock market averages remained above their 200-day moving averages.

COMMENTARY
A short, lightly traded week due to the Thanksgiving holiday.  Price/volume cues continue to indicate an uptrend.  And we’re still in an uptrend per OEW, although not without some storm clouds on the horizon:

Typically markets lose 45% to 50% of their value during these  [upcoming bear market] types of declines. With 55% of the world’s indices already in confirmed bear markets, and another 30% looking like they may already be in bear markets, [the current uptrend] will certainly run into some headwinds after it makes new highs.

Stock Market Candlestick charts

2015-11-29 – Stock Market Averages

For the detailed Elliott Wave Analysis, go to the ELLIOTT WAVE lives on by Tony Caldaro.  For price/volume data, head to stockcharts.com.

Moving Average Signals:

  • Uptrend=Market indexes remained above their moving average during the trading week
  • Downtrend=Market indexes remained below their moving average during the trading week
  • Buy signal=Market indexes rose above their moving averages during the trading week
  • Sell signal=Market indexes fell below their moving averages during the trading week
Posted in Historical Data, Market Trends, Other Blogs | Tagged , , , , , | Comments Off on Weekend Market Outlook

Weekend Market Outlook

Market Outlook entering the Week of November 22nd = Medium-term uptrend

MOVING AVERAGES

  • Short-term (20 DMA): Buy Signal 
    All the major stock market averages rose above their 20-day moving averages.
  • Intermediate (50 DMA): Uptrend
    All the major stock market averages (NYSE & Russell 2000) rose or remained above  their 50-day moving averages.
  • Long-term (200 DMA): Mixed 
    3 of the 5 major stock market averages rose above their 200-day moving averages.

COMMENTARY
US market prices rebounded last week, but volume was less than stellar.  The current uptrend contains a lot distribution days, and OEW continues to sound the alarm that we’re in the final stages of the current bull market.   So now is NOT time to initiate new or large positions unless you have a short-term time horizon.

I’ve continued to cut losses as needed, but now I’m also looking for signs of weakness in my more profitable positions (prices falling below key technical support levels, negative changes in financial performance, etc.)

2015-11-22 - US Stock Market Candlestick Charts

2015-11-22 – US Stock Market Averages

For the detailed Elliott Wave Analysis, go to the ELLIOTT WAVE lives on by Tony Caldaro.  For price/volume data, head to stockcharts.com.

Moving Average Signals:

  • Uptrend=Market indexes remained above their moving average during the trading week
  • Downtrend=Market indexes remained below their moving average during the trading week
  • Buy signal=Market indexes rose above their moving averages during the trading week
  • Sell signal=Market indexes fell below their moving averages during the trading week
Posted in Historical Data, Market Trends, Other Blogs | Tagged , , , , , | Comments Off on Weekend Market Outlook

Weekend Market Outlook

Market Outlook entering the Week of November 15th = Short-term downtrend/Medium-term uptrend

MOVING AVERAGES

  • Short-term (20 DMA): Sell Signal
    All the major stock market averages fell below their 20-day moving averages.
  • Intermediate (50 DMA): Mixed
    2 of the major stock market averages (NYSE & Russell 2000) fell below their 50-day moving averages.
  • Long-term (200 DMA): Sell Signal 
    All of the major stock market averages fell or remained below their 200-day moving averages.

COMMENTARY
US markets ran into some heavy selling last week, indicated by downward price action with higher trading volumes.  The updated market outlook has a lot of red in it, but that’s not surprising since we’re only a few weeks away from the start of the latest medium-term uptrend.  The 200-day moving averages are higher than then 50-day moving averages, which normally occurs after a heavy sell-off like the one the US markets encountered in late August and September.

That said, this latest sell-off means we’re one step closer to the end of the current bull market in US equities.  According to OEW, the markets have one more rally in them.  The S&P500 is expected to make new highs (2134+) before it’s over, which is ~5% from Friday’s close.  After that point, we’re on borrowed time.

Prepare accordingly!

2015-11-15 - US Stock Market Averages

2015-11-15 – US Stock Market Averages

For the detailed Elliott Wave Analysis, go to the ELLIOTT WAVE lives on by Tony Caldaro.  For price/volume data, head to stockcharts.com.

Moving Average Signals:

  • Uptrend=Market indexes remained above their moving average during the trading week
  • Downtrend=Market indexes remained below their moving average during the trading week
  • Buy signal=Market indexes rose above their moving averages during the trading week
  • Sell signal=Market indexes fell below their moving averages during the trading week
Posted in Historical Data, Market Trends, Other Blogs | Tagged , , , , , | Comments Off on Weekend Market Outlook

Weekend Market Outlook

Market Outlook entering the Week of November 8th = Medium-term uptrend

MOVING AVERAGES

  • Short-term (20 DMA): Uptrend
    All the major stock market averages remained above their 20-day moving averages.
  • Intermediate (50 DMA): Uptrend
    All the major stock market averages remained above their 50-day moving averages.
  • Long-term (200 DMA): Mixed
    3 of the 5 major stock market averages remained above their 200-day moving averages.

COMMENTARY
No major changes over the past week, so the outlook also remains unchanged.   I did notice that some of my dividend/income holdings got hammered last week.  I assume the selling was news-related, stemming from all the talk of a December interest rate hike by the US Federal Reserve.  Whatever the reasons, or your strategy for that matter, keep in mind the following estimates from Tony over at OEW:

The [next] bear market should last about two years and the market should lose between 45% and 50% of its value… After six years of rising prices it is time to prepare for a couple years of declining prices.

Prepare accordingly!

2015-11-08 - Stock Market Averages

2015-11-08 – Stock Market Averages

For the detailed Elliott Wave Analysis, go to the ELLIOTT WAVE lives on by Tony Caldaro.  For price/volume data, head to stockcharts.com.

Moving Average Signals:

  • Uptrend=Market indexes remained above their moving average during the trading week
  • Downtrend=Market indexes remained below their moving average during the trading week
  • Buy signal=Market indexes rose above their moving averages during the trading week
  • Sell signal=Market indexes fell below their moving averages during the trading week
Posted in Historical Data, Market Trends, Other Blogs | Tagged , , , , , | Comments Off on Weekend Market Outlook