Weekend Stock Market Outlook

Stock Market Outlook entering the Week of July 9th = Uptrend

  • 20/50 Day Moving Averages: Mixed
  • Price & Volume Action: Mixed
  • Objective Elliott Wave Analysis: Downtrend

COMMENTARY
The holiday shortened week wasn’t without its own fireworks, as volatility returned to the US markets in a major way.  Proceed with caution; the only thing keeping the market outlook in “uptrend” territory is price verses the 50 day moving average.  Had the trading week ended on Thursday, the outlook for this week would have changed to a downtrend!

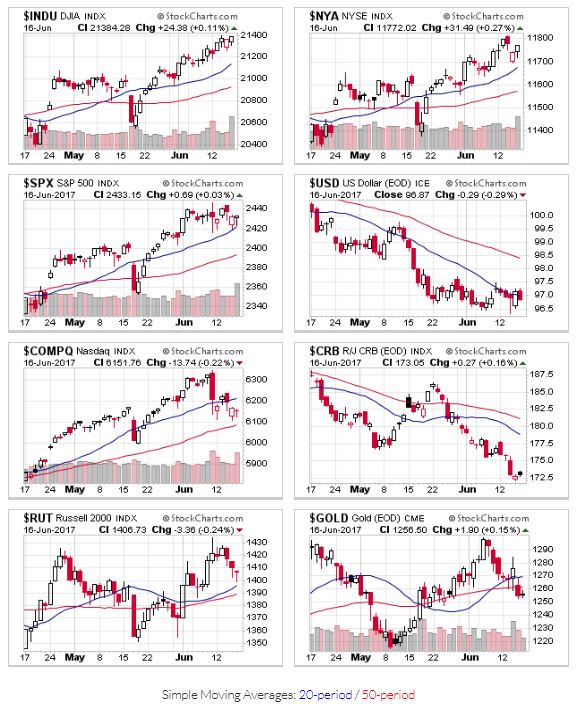
The Nasdaq continues to lead markets lower from a moving average standpoint.  Of more concern is fact that the S&P 500 and Russell 2000 also fell to their respective 50 day moving averages last Thursday.  Friday’s recovery postponed a change to a downtrend, putting the signal at mixed.

Price action for $INDU,$NYA,$SPX,$USD,$COMPQ,$CRB,$RUT,$GOLD

2017-07-09- US Stock Market Averages

The price/volume viewpoint is the same as last week, with price action supporting an uptrend, while volume action supporting a downtrend.  Friday’s rally came with reduced trading volume, which is the opposite of what you want to see when prices bounce off the 50-day.

OEW finally gave us a downtrend confirmation for all but the Dow, with the expectation that the Dow (being the leading index) will likely provide confirmation when the downtrend is almost complete.


If you find this research helpful, please tell a friend. I share articles and other news of interest via Twitter; you can follow me @investsafely. The weekly market outlook is also posted on Facebook and Linkedin.

You can check out how well (or poorly) the outlook has tracked the market using past performance estimates:

For the detailed Elliott Wave Analysis, go to the ELLIOTT WAVE lives on by Tony Caldaro.  Charts provided courtesy of stockcharts.com.


Posted in Historical Data, Market Trends, Other Blogs | Tagged , , , , , | Comments Off on Weekend Stock Market Outlook

Weekend Stock Market Outlook

Stock Market Outlook entering the Week of July 2nd = Uptrend

  • 20/50 Day Moving Averages: Uptrend
  • Price & Volume Action: Mixed
  • Objective Elliott Wave Analysis: Uptrend

COMMENTARY
Less rotation last week…more outright selling.  Was this the typical, pre-holiday trade, or the start of something larger and longer?   I’ve read a lot of commentary on both sides of this debate. It seems like there is a lot of uncertainty and limited conviction either way (lots of statements like “the markets could rally if we see a 5% correction”, or  “if these 15 things happen, then we “maybe” see…, etc.).  This week kicks off with a shortened session on Monday, then traders take the day off on Tuesday for in honor of Independence day.

The Nasdaq led markets lower last week, as technology names sold off, and closed below both its 20 and 50 day moving averages.  The S&P500 starts the week below its 20 day as well, while the Russell, DJIA, and NYSE are just barely above that level.  For now, the uptrend remains in place.

Price charts for $INDU,$NYA,$SPX,$USD,$COMPQ,$CRB,$RUT,$GOLD

2017-07-02- US Stock Market Averages

Through the price/volume lens, price action continues to support an uptrend (all but the Nasdaq are above the 50 day), but volume action shows a lot of high-volume selling.  The distribution day count has the Nasdaq at 6, Dow Jones Industrials at 7, NYSE at 7, and the S&P500 at 8).  The increase in distribution days changes this signal to mixed.

No change in midterm OEW signal;  the uptrend stays in place, but may have topped.


If you find this research helpful, please tell a friend. I share articles and other news of interest via Twitter; you can follow me @investsafely. The weekly market outlook is also posted on Facebook and Linkedin.

You can check out how well (or poorly) the outlook has tracked the market using past performance estimates:

For the detailed Elliott Wave Analysis, go to the ELLIOTT WAVE lives on by Tony Caldaro.  Charts provided courtesy of stockcharts.com.


Posted in Historical Data, Market Trends, Other Blogs | Tagged , , , , , | Comments Off on Weekend Stock Market Outlook

Weekend Stock Market Outlook

Stock Market Outlook entering the Week of June 25th = Uptrend

  • 20/50 Day Moving Averages: Uptrend
  • Price & Volume Action: Uptrend
  • Objective Elliott Wave Analysis: Uptrend

COMMENTARY
Another rotation last week, as the Dow Jones took a break and the Nasdaq recovered slightly, thanks in part to biotechs.  Will there be a different winning sector this week?

With the Nasdaq’s stronger showing last week, all the indexes start this week above key support levels (20 and 50 day moving averages), so no change in signal.

$INDU,$NYA,$SPX,$USD,$COMPQ,$CRB,$RUT,$GOLD

2017-06-25 – US Stock Market Averages

Price/volume action continues to support an uptrend, though distribution days remain elevated.

No change in midterm OEW signals;  the uptrend stays in place, but may have topped.

Best of luck this week.  Last Sunday, I mentioned some of my newer holdings had retreated to buy points.  During the week, those positions hit sell triggers (so I’m out), and my weekly scan shows that stocks with the best fundamentals are at profit taking levels (+20%) or are extended from proper technical buy points and bases.


If you find this research helpful, please tell a friend. I share articles and other news of interest via Twitter; you can follow me @investsafely. The weekly market outlook is also posted on Facebook and Linkedin.

You can check out how well (or poorly) the outlook has tracked the market using past performance estimates:

For the detailed Elliott Wave Analysis, go to the ELLIOTT WAVE lives on by Tony Caldaro.  Charts provided courtesy of stockcharts.com.


Posted in Historical Data, Market Trends, Other Blogs | Tagged , , , , , | Comments Off on Weekend Stock Market Outlook

Weekend Stock Market Outlook

Stock Market Outlook entering the Week of June 18th = Uptrend

  • 20/50 Day Moving Averages: Uptrend
  • Price & Volume Action: Uptrend
  • Objective Elliott Wave Analysis: Uptrend

COMMENTARY
As expected, the U.S. Federal Reserve raised short-term interest rates. Sector rotation continues, as the Dow Jones hit new price highs and the Nasdaq fell below short-term support levels.  The uptrend remains in place, but there are some warning signs.

The Dow Jones Industrials, S&P500, NYSE, and Russell 2000 start the week above key support levels (20 and 50 day moving averages).  The Nasdaq had another poor showing last week, and begins this week below its 20 day moving average.

Price Charts for $INDU,$NYA,$SPX,$USD,$COMPQ,$CRB,$RUT,$GOLD

2017-06-18 – US Stock Market Averages

The overall distribution count can now be considered elevated, with most of the indexes above 5 (the S&P500 is at 6). Further high volume selling will confirm a new downtrend.

OEW is signaling that the uptrend may have topped with a minor correction to follow.

Caution remains the order of the day.  Most of my recent trades have returned to their buy points, indicating a weak environment for growth stocks.


If you find this research helpful, please tell a friend. I share articles and other news of interest via Twitter; you can follow me @investsafely. The weekly market outlook is also posted on Facebook and Linkedin.

You can check out how well (or poorly) the outlook has tracked the market using past performance estimates:

For the detailed Elliott Wave Analysis, go to the ELLIOTT WAVE lives on by Tony Caldaro.  Charts provided courtesy of stockcharts.com.


Posted in Historical Data, Market Trends, Other Blogs | Tagged , , , , , | Comments Off on Weekend Stock Market Outlook

Weekend Stock Market Outlook

Stock Market Outlook entering the Week of June 11th = Uptrend

  • 20/50 Day Moving Averages: Uptrend
  • Price & Volume Action: Uptrend
  • Objective Elliott Wave Analysis: Uptrend

COMMENTARY
U.S. stocks continued their march higher last week, although Friday’s massive sell of in technology names (price and volume) is enough to give us pause as we start this week. Add to that this week’s Fed meeting and an expected rate hike…no one knows for sure how market prices will react.

All the major stock market averages start the week above key support levels (20 and 50 day moving averages).  The Nasdaq had quite the sell off on Friday, as investors appear to have rotated out of tech stocks and into industrials, banks, and energy.

Price trends for $INDU,$NYA,$SPX,$USD,$COMPQ,$CRB,$RUT,$GOLD

2017-06-11 – US Stock Market Averages

Although the overall distribution day count remains low, many leading stocks were crushed on Friday. Since many of the leading stocks are also technology plays (e.g. the so called FAANG stocks of Facebook, Apple, Amazon, Netflix, and Google), the price/volume action adds to the possibility of sector rotation.

OEW maintains an uptrend signal for now.

Following last week’s call to prune your holdings, tread carefully in the near term if you plan to initiate new positions.  We may be in an uptrend, but if the sectors are rotating, a new batch of leaders will emerge and your prior research may need to be revisited. 


If you find this research helpful, please tell a friend. I share articles and other news of interest via Twitter; you can follow me @investsafely. The weekly market outlook is also posted on Facebook and Linkedin.

You can check out how well (or poorly) the outlook has tracked the market using past performance estimates:

For the detailed Elliott Wave Analysis, go to the ELLIOTT WAVE lives on by Tony Caldaro.  Charts provided courtesy of stockcharts.com.


Posted in Historical Data, Market Trends, Other Blogs | Tagged , , , , , | Comments Off on Weekend Stock Market Outlook

Weekend Stock Market Outlook

Stock Market Outlook entering the Week of June 4th = Uptrend

  • 20/50 Day Moving Averages: Uptrend
  • Price & Volume Action: Uptrend
  • Objective Elliott Wave Analysis: Uptrend

COMMENTARY
U.S. stocks remain in rally mode as we enter the first full week of June trading.

All the major stock market averages start the week above key support levels (20 and 50 day moving averages).  The US dollar remains in a downtrend, as does the general commodity market, while gold is in a uptrend.

Price Action for $INDU,$NYA,$SPX,$USD,$COMPQ,$CRB,$RUT,$GOLD

2017-06-04 – US Stock Market Averages

Two new distribution days last week, but price and volume action remains positive and in rally mode.

OEW maintains an uptrend signal as well.

U.S. stocks have had quite a run since the November election; enough time for a rotation into and out of banks and oil firms.  Now is a great time to check your holdings, book some profits (>20% is one of my rules), and trim any laggards that haven’t kept up or have show weakness in the fundamentals (sales, earnings, etc.)


If you find this research helpful, please tell a friend. I share articles and other news of interest via Twitter; you can follow me @investsafely. The weekly market outlook is also posted on Facebook and Linkedin.

You can check out how well (or poorly) the outlook has tracked the market using past performance estimates:

For the detailed Elliott Wave Analysis, go to the ELLIOTT WAVE lives on by Tony Caldaro.  Charts provided courtesy of stockcharts.com.


Posted in Historical Data, Market Trends, Other Blogs | Tagged , , , , , | Comments Off on Weekend Stock Market Outlook

Weekend Stock Market Outlook

Stock Market Outlook entering the Week of May 28th = Uptrend

  • 20/50 Day Moving Averages: Uptrend
  • Price & Volume Action: Uptrend
  • Objective Elliott Wave Analysis: Uptrend

COMMENTARY
U.S. stocks continued to recover from the beating they took a week and a half ago, with most indexes reaching all time highs while the Russell 2000 continues to lag behind.  This week will be a shortened week, as U.S. markets are closed Monday in observance of Memorial Day.

The Russell 2000 regained the 50-day moving average, but still remains below the 20 day.  All the other market indexes are above both key levels.

$INDU,$NYA,$SPX,$USD,$COMPQ,$CRB,$RUT,$GOLD

2017-05-28 – US Stock Market Averages

Price/volume action improved last week, with no new distribution days and a few old ones falling off the count.

OEW analysis shows the continued uptrend as well, finally seeing at least a little bit that the Dow and S&P500 strength needed to continue the current rally.


If you find this research helpful, please tell a friend. I share articles and other news of interest via Twitter; you can follow me @investsafely. The weekly market outlook is also posted on Facebook and Linkedin.

You can check out how well (or poorly) the outlook has tracked the market using past performance estimates:

For the detailed Elliott Wave Analysis, go to the ELLIOTT WAVE lives on by Tony Caldaro.  Charts provided courtesy of stockcharts.com.


Posted in Historical Data, Market Trends, Other Blogs | Tagged , , , , , | Comments Off on Weekend Stock Market Outlook