Stock Market Outlook entering the Week of May 25th = Uptrend
- ADX Directional Indicators: Uptrend
- Institutional Activity (Price & Volume): Uptrend
- On Balance Volume Indicator: Uptrend
ANALYSIS
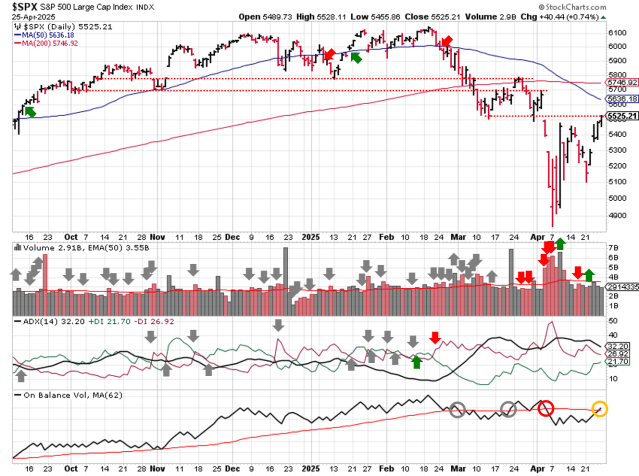
The stock market outlook stays in an uptrend, as equities retreated to the 200-day moving average.
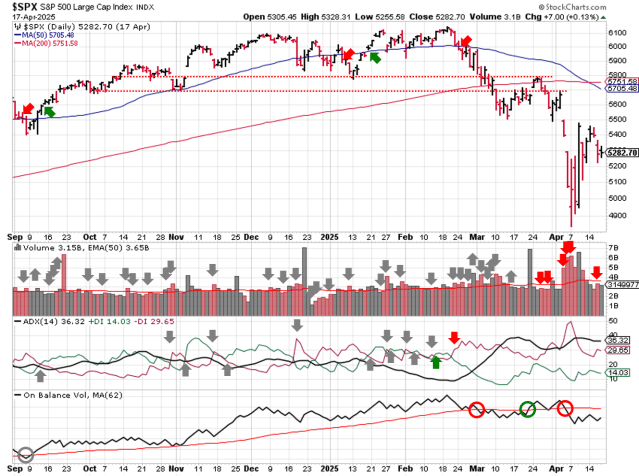
The S&P500 ( $SPX ) fell 2.6% last week. The index sits ~4% above the 50-day moving average and ~1% above the 200-day moving average.

SPX Price & Volume Chart for May 25 2025
All three technical indicators remain bullish. The Direction Indicator ( ADX ) could flip to bearish if price decides to head lower and fill the May 12 gap.

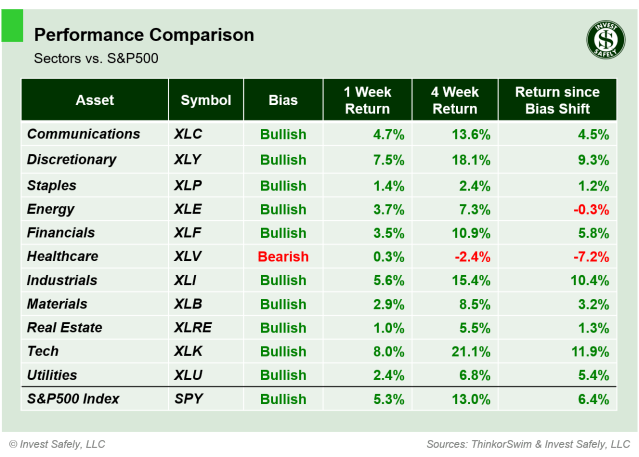
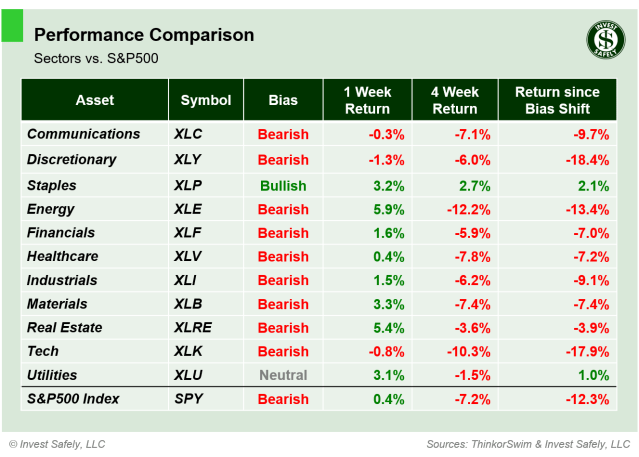
S&P Sector Performance for Week 22 of 2025
Consumer Staples ( $XLP ) held up the best last week, while Energy ( $XLE ) was the worst performer and fell back down to bearish bias. Real estate ( $XLRE ) slid to neutral on the rise in treasury yields.

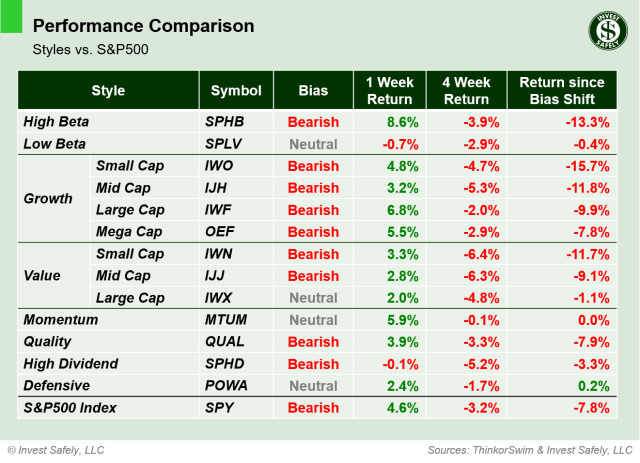
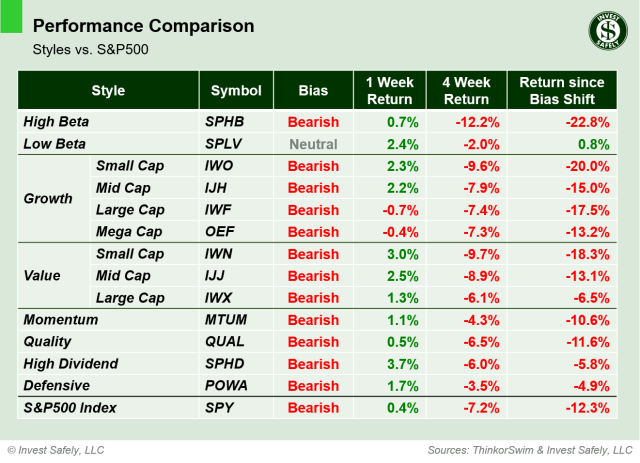
Sector Style Performance for Week 22 of 2025
Low Beta ( $SPLV ) was the best style last week, while High Beta ( $SPLV ) was the worst. High Dividend ( $SPHD ) fell to Bearish bias as well, hit by weak equity performance and interest rates.

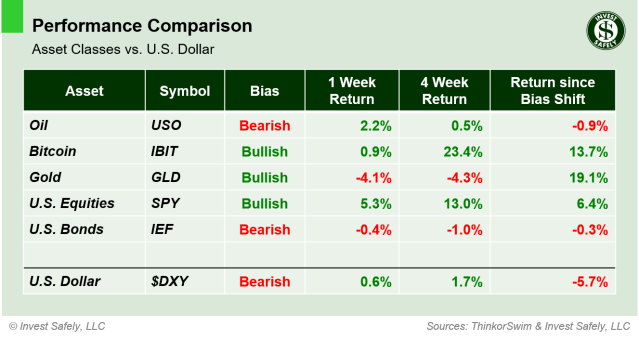
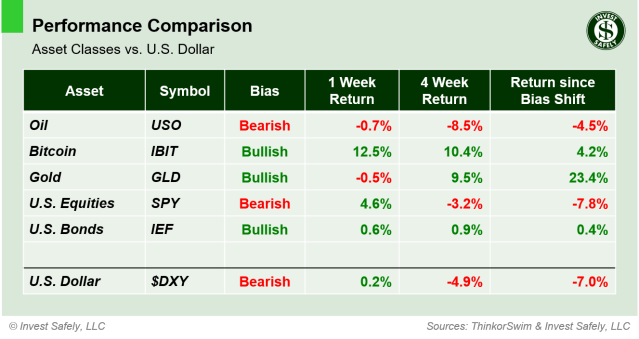
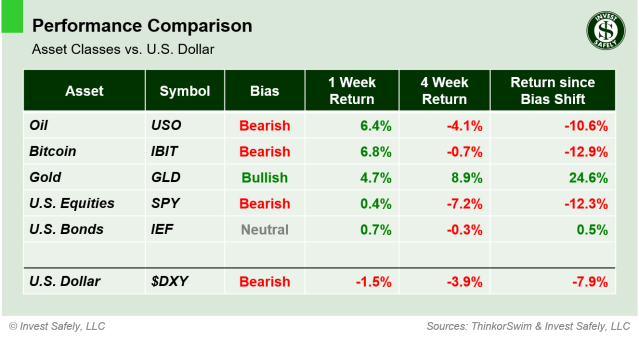
Asset Class Performance for Week 22 2025
Gold ( $GLD ) clawed back some gains last week, followed closely by Bitcoin ( $IBIT ), while equities led to the downside ( $SPY ) was the worst performer. No bias changes to report.
COMMENTARY
Equity indexes gave back some of their recent gains last week and tested support at the 50-day moving average. Headline volatility remains a risk, with markets hyper-fixated on tariff news.
On Thursday, the U.S. House of Representatives passed the “Big, Beautiful” tax bill, which is front loaded with tax cuts and back loaded with spending reductions. The Congressional Budget Office estimates that the bill would add ~$3 trillion to the deficit over the next ten years, but that’s also front loaded.
While the tax cuts and new spending are likely to have a stimulative effect in the short term, the bond market responded by sending the 10-year yield above 4.5% and the 30-year above 5%. Bond markets are paying attention to government debt and related costs. The interest paid by the U.S. government is already approaching historic levels, and financing this additional debt at higher rates will push the interest paid even higher, thereby putting more upward pressure on treasury yields.
Looking ahead, markets are closed tomorrow for Memorial Day. Data-wise, we get the latest Durable Goods Orders on Tuesday, FOMC minutes Wednesday, a revised GDP figure Thursday, and PCE on Friday.
Trading volume was below average last week, which should’ve created some decent entry points for long set-ups. Look for tickers with a bullish bias that break out of proper set-ups when trading resumes.
Best to Your Week!
P.S. If you find this research helpful, please tell a friend.
If you don’t, tell an enemy.