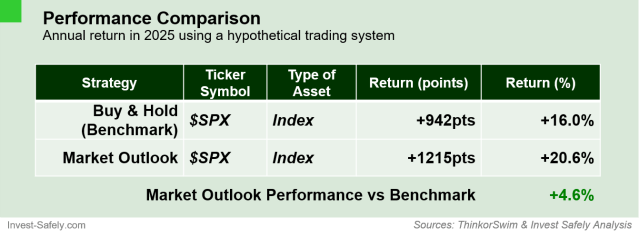
Stock Market Outlook – October 05 2025

Stock Market Outlook entering the Week of October 5th = Uptrend

ANALYSIS
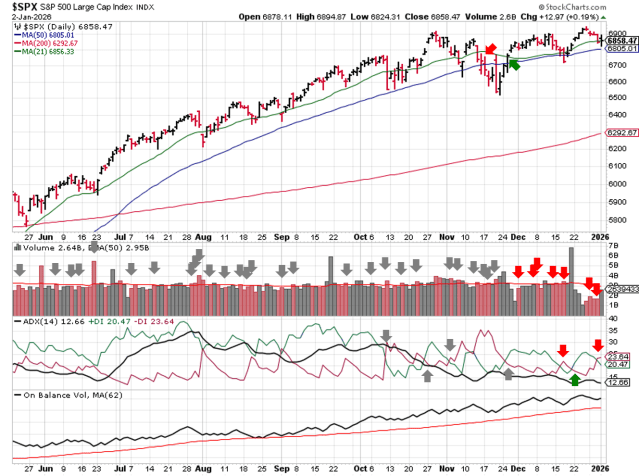
The stock market outlook continues to show an uptrend for U.S. equities.

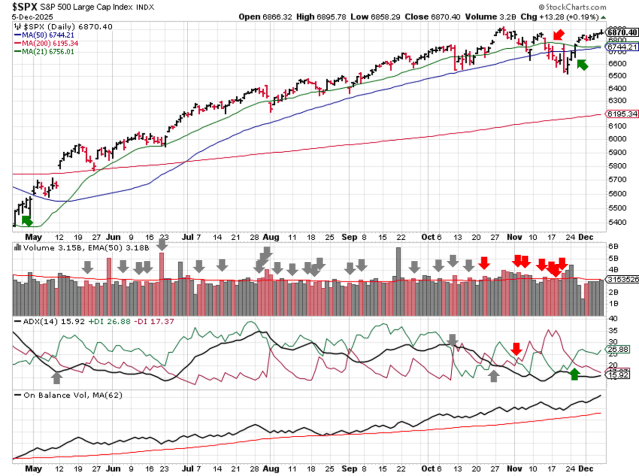
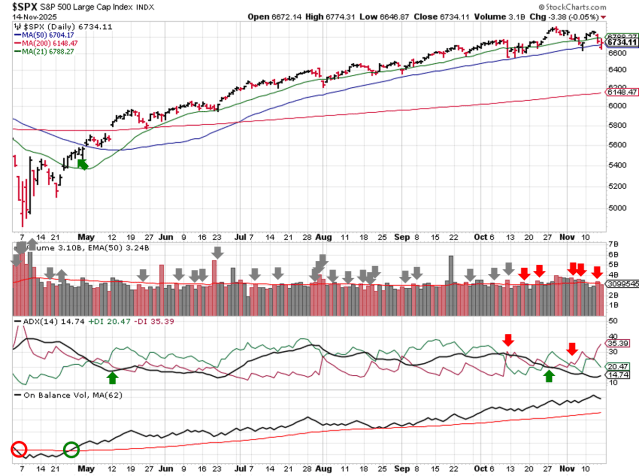
The S&P500 ( $SPX ) rose 1.1% last week.  The index sits ~3% above the 50-day moving average and ~11% above the 200-day moving average.

All three indicators are bullish.

Technical analysis of daily SPX prices

SPX Price & Volume Chart for Oct 05 2025

PERFORMANCE COMPARISONS
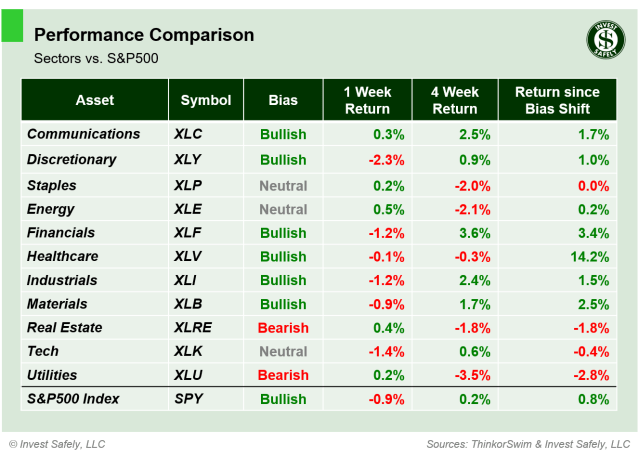
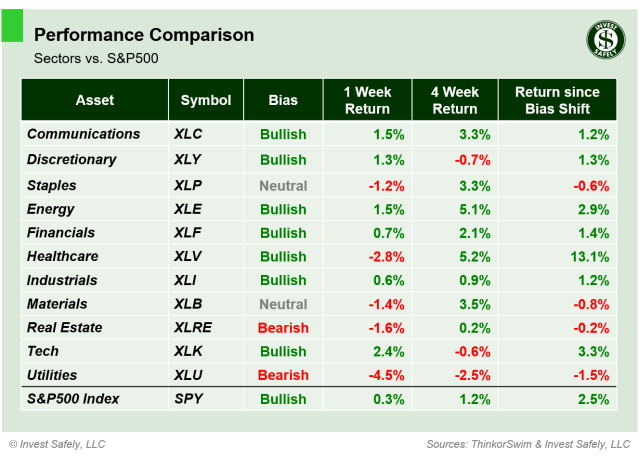
Healthcare ( $XLV ) was up ~7% last week(!), besting all other sectors by a wide margin.  After it’s recent run up, Energy ( $XLE ) lost some of it’s momentum, thanks in part to Crude Oil, and registered the weakest returns.  Healtcare and Real Estate ( $XLRE ) improved to Bullish bias, while Materials ( $XLB ) slipped to neutral.

Weekly price performance of S&P500 sector ETFs

S&P Sector Performance from Week 40 of 2025

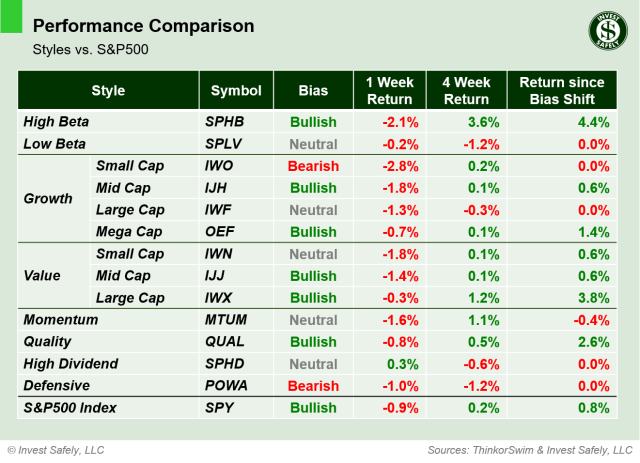
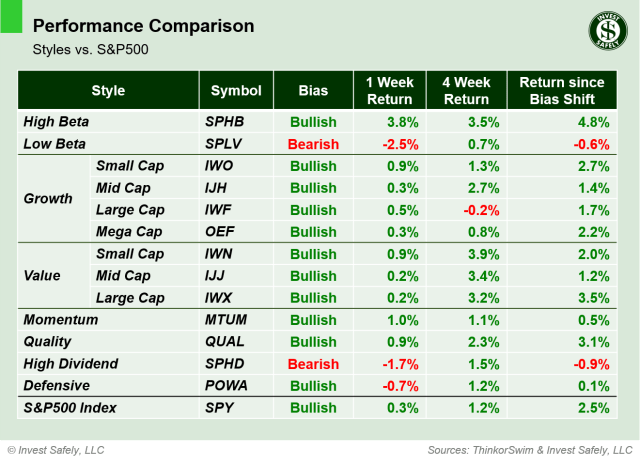
High Beta ( $SPHB ) outperformed last week, with Small Cap Growth and Quality ( $IWO & $QUAL ) right behind.  Momentum ( $MTUM ) was the only losing style.  High Dividend ( $SPHD ) moved back to bullish bias from neutral.

Weekly price performance by sector style

Sector Style Performance from Week 40 of 2025

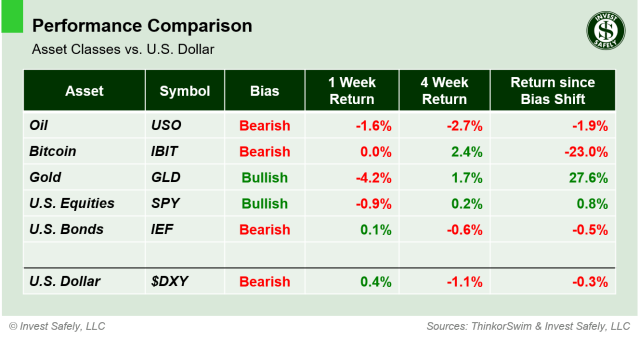
Bitcoin ( $IBIT ) got its mojo back, jumping ~13%, and reclaimed bullish bias.  On the other hand, Oil ( $USO ) dropped ~7% last week and returned to bearish bias…just one week after popping ~5% moving to bullish.

Weekly price performance by asset class

Asset Class Performance from Week 40 2025

COMMENTARY
Last week’s data releases showed August job openings ( JOLTs ) increased slightly.  The ISM Manufacturing survey show a small improvement as well, while services were a bit lower.  The main course, Non-Farm Payrolls, wasn’t released due to the U.S. government shutdown, so other tea leaves need reading prior to the next FOMC meeting.

While there’s been a lot of noise about interest rates and unemployment, the general indexes continue to march higher.  Even a bit of volatility below the surface of the market (in terms of sectors and styles) hasn’t done much to slow it’s advance.

Best to Your Week!

P.S. If you find this research helpful, please tell a friend.
If you don’t, tell an enemy.

Sources: Bloomberg, CNBC, Federal Reserve Bank of St. Louis, Hedgeye, Stockcharts.com, TradingEconomics.com, U.S. Bureau of Economic Analysis, U.S. Bureau of Labor Statistics, TradingEconomics.com

Invest Safely, LLC is an independent investment research and online financial media company.  Use of Invest Safely, LLC and any other products available through invest-safely.com is subject to our Terms of Service and Privacy Policy.
Not a recommendation to buy or sell any security
Posted in Historical Data, Market Trends | Tagged , , , | Comments Off on Stock Market Outlook – October 05 2025

Stock Market Outlook – September 28 2025

Stock Market Outlook entering the Week of September 28th = Uptrend

ANALYSIS
The stock market outlook continues to show an uptrend for U.S. equities.

The S&P500 ( $SPX ) fell 0.3% last week.  The index sits ~3% above the 50-day moving average and ~11% above the 200-day moving average.

All three indicators remain bullish.

Technical analysis of daily SPX prices

SPX Price & Volume Chart for Sept 28 2025

PERFORMANCE COMPARISONS
Energy ( $XLE ) outperformed last week, and it was Materials turn ( $XLB ) to lead on the downside.  Adding insult to injury, Materials also fell into bearish bias; Healthcare fell to neutral.

Weekly price performance of S&P500 sector ETFs

S&P Sector Performance from Week 39 of 2025

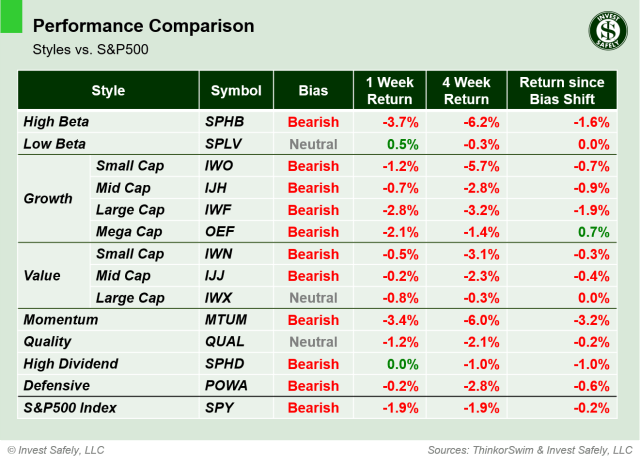
Low Beta ( $SPLV ) outperformed last week with a gain of 0.8%!  All other sector styles struggled, with High Beta ( $SPHB ) down the most.  Low beta climbed up to neutral bias, while High Dividend ( $SPHD ) stumbled down to neutral.

Weekly price performance by sector style

Sector Style Performance from Week 39 of 2025

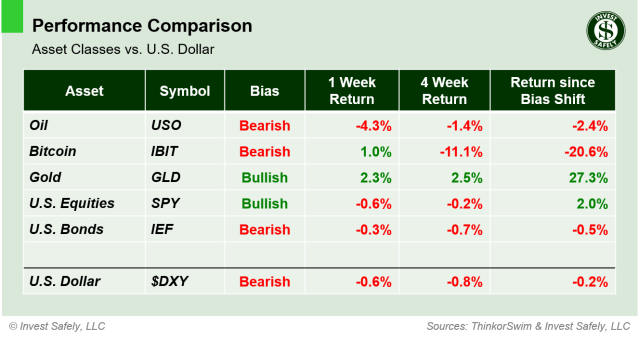
Oil ( $USO ) jumped almost 5% last week, while Bitcoin ( $IBIT ) underperformed again.  Those two assets also flipped their biases; Oil to bullish and Bitcoin to bearish.  The dollar showed signs of life last week; something to keep an eye on as a strengthening dollar will impact asset prices.

Weekly price performance by asset class

Asset Class Performance from Week 39 2025

COMMENTARY
U.S. equity indexes came into the week overbought, so last week’s downside volatility wasn’t too surprising.  Market participants quickly bought the dip, with the $SPX finding support at the 21-day moving average.

The third and final update for Q2 GDP came in at +3.8%, a full 50 basis points higher than the second estimate, thanks increases in consumption.

August PCE data was inline with estimates and remains “sticky”.

PCE (y/y) Actual Prior
Expected
Headline +2.7% +2.6% +2.7%
Core +2.9% +2.9% +2.9%

This week is employment data (JOLTS, NFP), and ISM data. And there’s the possible shutdown of the U.S. government, unless Congress can pass the necessary appropriations bills to keep federal agencies funded…which seems unlikely.

Best to Your Week!

P.S. If you find this research helpful, please tell a friend.
If you don’t, tell an enemy.

Sources: Bloomberg, CNBC, Federal Reserve Bank of St. Louis, Hedgeye, Stockcharts.com, TradingEconomics.com, U.S. Bureau of Economic Analysis, U.S. Bureau of Labor Statistics, TradingEconomics.com

Invest Safely, LLC is an independent investment research and online financial media company.  Use of Invest Safely, LLC and any other products available through invest-safely.com is subject to our Terms of Service and Privacy Policy.
Not a recommendation to buy or sell any security
Posted in Historical Data, Market Trends | Tagged , , , | Comments Off on Stock Market Outlook – September 28 2025

Stock Market Outlook – September 21 2025

Stock Market Outlook entering the Week of September 21st = Uptrend

ANALYSIS
The stock market outlook continues to show an uptrend for U.S. equities.

The S&P500 ( $SPX ) rose 1.2%.  The index sits ~4% above the 50-day moving average and ~11% above the 200-day moving average.

We made it through another week without institutional selling, meaning all three indicators are bullish once again.

Technical analysis of daily SPX prices

SPX Price & Volume Chart for Sept 21 2025

PERFORMANCE COMPARISONS
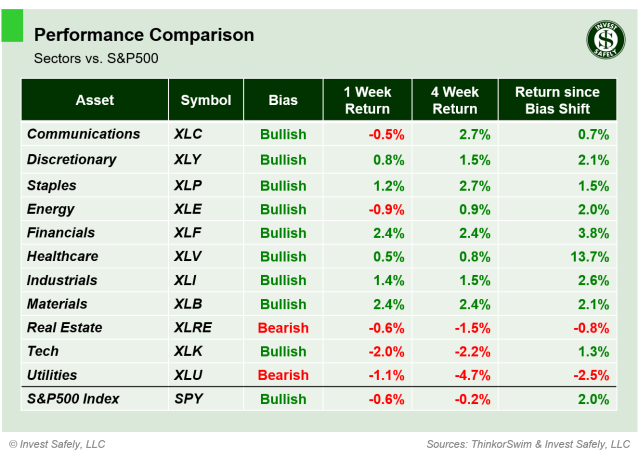
The Technology sector ( $XLK ) outperformed again last week, while Consumer Staples ( $XLP ) was the worst sector again, along with Real Estate ( $XLRE ).  Real Estate also fell back to neutral bias.

Weekly price performance of S&P500 sector ETFs

S&P Sector Performance from Week 38 of 2025

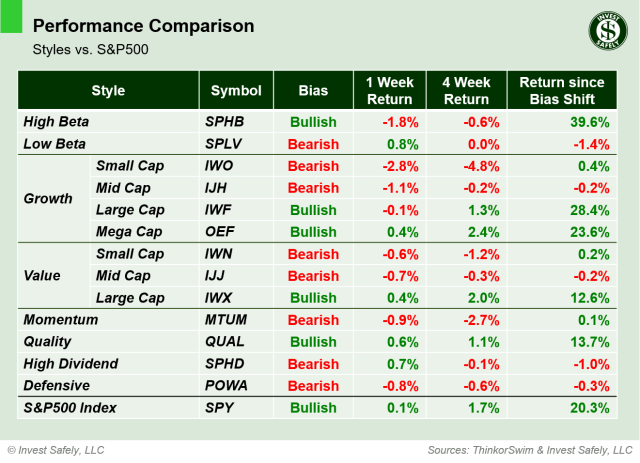
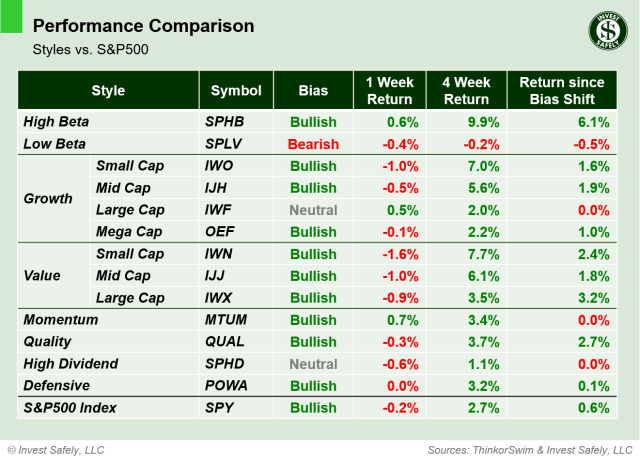
High Beta ( $SPHB ) outperformed last week, and Low Beta ( $SPLV ) underperformed and fell to bearish bias.

Weekly price performance by sector style

Sector Style Performance from Week 38 of 2025

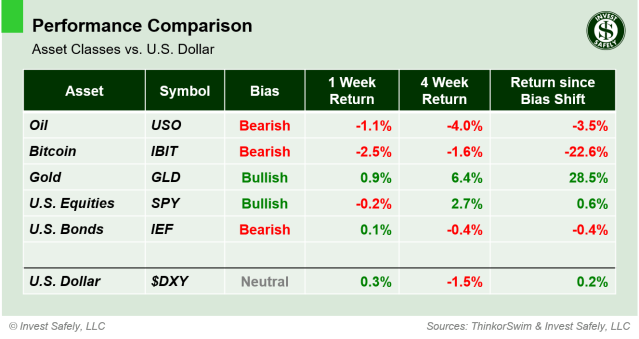
Gold ( $GLD ) edged past U.S. equities last week to lead asset class returns, while Bitcoin ( $IBIT ) underperformed.  There were no changes in bias.

Weekly price performance by asset class

Asset Class Performance from Week 38 2025

COMMENTARY
In a move that surprised no one, the FOMC cut rates 0.25% in response to weakening labor data.  Market participants were more interested in the future rate path; how much more easing there will be.  And on that front, messages out of the Fed were mixed.  It’s likely we’ll need to see further deterioration in the labor market, and/or reduced inflationary pressure before more cuts are in play.

Fed Chair Powell gets another chance to discuss the plan ( or not ) during a speech on Tuesday.  We’ll also Flash PMI just after market open, so expect volatility until the early afternoon.  We’ll also get the final GDP update for Q2 at 8:30am Wednesday, followed by August PCE at 8:30am on Friday.

Best to Your Week!

P.S. If you find this research helpful, please tell a friend.
If you don’t, tell an enemy.
Sources: Bloomberg, CNBC, Federal Reserve Bank of St. Louis, Hedgeye, Stockcharts.com, TradingEconomics.com, U.S. Bureau of Economic Analysis, U.S. Bureau of Labor Statistics, TradingEconomics.com

Invest Safely, LLC is an independent investment research and online financial media company.  Use of Invest Safely, LLC and any other products available through invest-safely.com is subject to our Terms of Service and Privacy Policy.
Not a recommendation to buy or sell any security
Posted in Historical Data, Market Trends | Tagged , , , | Comments Off on Stock Market Outlook – September 21 2025

Stock Market Outlook – September 14 2025

Stock Market Outlook entering the Week of September 14th = Uptrend

ANALYSIS
The stock market outlook continues to show an uptrend for U.S. equities.

The S&P500 ( $SPX ) rose 1.6%.  The index sits ~3% above the 50-day moving average and ~10% above the 200-day moving average.

We made it through the week without any institutional selling, and two distribution days fell off the count,  so the total sits at 5; still high, but not as worrisome.  Otherwise, the indicators remain bullish.

Technical analysis of daily SPX prices

SPX Price & Volume Chart for Sept 14 2025

PERFORMANCE COMPARISONS
The Technology sector ( $XLC ) outperformed last week, while Consumer Staples ( $XLP ) was the worst sector.  Consumer Staples ( $XLP ) “unimproved” from last week’s improvement, dropping back to Bearish bias, while Utilities ( $XLU ) returned to bullish.

Weekly price performance of S&P500 sector ETFs

S&P Sector Performance from Week 37 of 2025

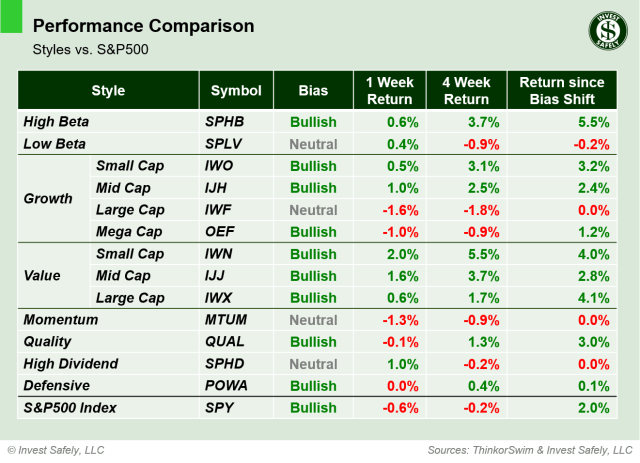
The Momentum style ( $MTUM ) beat all comers last week, while Mid-Cap Value  ( $IJJ ) underperformed.

Weekly price performance by sector style

Sector Style Performance from Week 37 of 2025

Bitcoin ( $IBIT ) returned got back in the win column last week, and returned to bullish bias.  The U.S. dollar ( $DXY ) underperformed.

Weekly price performance by asset class

Asset Class Performance from Week 37 2025

COMMENTARY
The NFP annual revision lowered 2024 jobs data by 911,000 jobs, exceeding the expected 818,000 revision.  It was the large revision in over 20 years, and suggests the labor market has been weaker than previously thought.  The revision gives the FOMC the needed rationale to begin cutting interest rates, although it also increases the political pressure to do more.

Inflation data was mixed, with producer prices rising more slowly than consumer prices.  Headline and Core PPI showed a decline in prices during August, even after downward revisions to July figures.

PPI (y/y) Actual Prior
Expected
Headline +2.6% +3.1%* +3.3%
Core +2.8% +3.4% +3.5%

Headline CPI showed modest increases in headline data, while core remained flat at 3.1%.

CPI (y/y) Actual Prior
Expected
Headline +2.9% +2.7% +2.9%
Core +3.1% +3.1% +3.1%

We’ve got the FOMC rate decision on Wednesday this week, with many expecting a rate cut given weaker employment data (the bond market included).  Chairman Powell “pivoted” from inflation to labor last year, so not cutting would be more surprising at this point.

Best to Your Week!

P.S. If you find this research helpful, please tell a friend.
If you don’t, tell an enemy.
Sources: Bloomberg, CNBC, Federal Reserve Bank of St. Louis, Hedgeye, Stockcharts.com, TradingEconomics.com, U.S. Bureau of Economic Analysis, U.S. Bureau of Labor Statistics, TradingEconomics.com

Invest Safely, LLC is an independent investment research and online financial media company.  Use of Invest Safely, LLC and any other products available through invest-safely.com is subject to our Terms of Service and Privacy Policy.
Not a recommendation to buy or sell any security
Posted in Historical Data, Market Trends | Tagged , , , | Comments Off on Stock Market Outlook – September 14 2025

Stock Market Outlook – September 07 2025

Stock Market Outlook entering the Week of September 7th = Uptrend

ANALYSIS
The stock market outlook continues to show an uptrend for U.S. equities, despite last week’s weak labor data.

The S&P500 ( $SPX ) rose 0.3%.  The index sits ~2% above the 50-day moving average and ~9% above the 200-day moving average.

The ADX Directional Indicators briefly crossed over after the holiday weekend, but immediately reversed back to bullish; not surprising given the main reading is approaching 20.  Three distribution days fell off the count, but two were added, so the total remains at seven (>5 = high). Price remains above key moving averages, so the signal stays at neutral.

Technical analysis of daily SPX prices

SPX Price & Volume Chart for Sept 07 2025

PERFORMANCE COMPARISONS
Communications ( $XLC ) outperformed last week, while Energy ( $XLE ) gave back some recent gains.  Consumer Staples ( $XLP ) improved from Bearish to Bullish after last week’s drop, and Utilities ( $XLE ) fell is testing its bias level.

Weekly price performance of S&P500 sector ETFs

S&P Sector Performance from Week 36 of 2025

Small cap value ( $IWN ) outperformed all other styles for a fourth week in a row; High Beta ( $SPHB) underperformed.  Low Beta ( $SPLV ) is testing a bias level, moving from bullish the neutral.

Weekly price performance by sector style

Sector Style Performance from Week 36 of 2025

Gold ( $GLD ) led assets to the upside for a second week, while Oil ( $USO ) was the worst performer.  No changes in bias to start the week.

Weekly price performance by asset class

Asset Class Performance from Week 36 2025

COMMENTARY
ISM Services and Manufacturing PMI were higher in August, though Manufacturing remains contractionary.

JOLTs ( July ) and Non-farm payrolls ( August ) show some weakness in the labor market, with both datasets coming in lower than expected.  Given the recent back and forth about the validity of U.S. government statistics, it’s hard to get too excited about the numbers.  That said, markets reacted as though the Federal Reserve got the green light to cut interest rates this month.

This Tuesday, the annual revision of NFP data is released, with expectations for a decrease of 818k jobs, likely increasing the pressure to ease.  Then August PPI and CPI will hit the wires.  Expect some volatile opening moves this week!

Best to Your Week!

P.S. If you find this research helpful, please tell a friend.
If you don’t, tell an enemy.

Sources: Bloomberg, CNBC, Federal Reserve Bank of St. Louis, Hedgeye, Stockcharts.com, TradingEconomics.com, U.S. Bureau of Economic Analysis, U.S. Bureau of Labor Statistics, TradingEconomics.com

Invest Safely, LLC is an independent investment research and online financial media company.  Use of Invest Safely, LLC and any other products available through invest-safely.com is subject to our Terms of Service and Privacy Policy.
Not a recommendation to buy or sell any security
Posted in Historical Data, Market Trends | Tagged , , , | Comments Off on Stock Market Outlook – September 07 2025

Stock Market Outlook – August 31 2025

Stock Market Outlook entering the Week of August 31st = Uptrend

ANALYSIS
The stock market outlook continues to show an uptrend for U.S. equities.

The S&P500 ( $SPX ) fell 0.1%.  The index sits ~2% above the 50-day moving average and ~8% above the 200-day moving average.

Technical analysis of daily SPX prices

SPX Price & Volume Chart for Aug 31 2025

On-balance is back in bullish territory, but also shows a bearish divergence since the end of July.  The ADX has also faded over that period of time, suggesting the current rally is losing some steam.  The market got a reprieve from institutional selling last week, and distribution days will start falling off the count through the week.

PERFORMANCE COMPARISONS
Energy ( $XLE ) led sectors higher again last week; Utilities and Consumer Staples ( $XLU & $XLP ) were the worst performers.  Staples also dropped to bearish bias.

Weekly price performance of S&P500 sector ETFs

S&P Sector Performance from Week 35 of 2025

Small cap value ( $IWN ) outperformed for a third week, but the overall gains were small.  Low Beta ( $SPLV ) was the laggard.  No changes in bias; all styles are bullish.

Weekly price performance by sector style

Sector Style Performance from Week 35 of 2025

Gold ( $GLD ) led assets to the upside, while Bitcoin ( $IBIT ) was the worst performer for the second week in a row.  Adding insult to injury, Bitcoin ( $IBIT ) starts September with a bearish bias.  The US Dollar ( $DXY ) is back to neutral.

Weekly price performance by asset class

Asset Class Performance from Week 35 2025

COMMENTARY
Nvidia ($NVDA) reported better than expected results last week, but the stock price took a small hit because analysts were expecting higher data center revenues ($41.1b vs $41.3b).  Guidance for next quarter was also lower than expected, largely because they’re not including sales to China.  Since the stock accounts for 8% of the S&P500, it’s price has an oversized impact on the index.

The second estimate of Q2 GDP came in higher than the first, from 3% to 3.3%, mainly due to upward revisions to investments and consumer spending data.

Headline PCE  data for July was inline with estimates, while Core was slightly higher.  For the first time in many months, there were no revisions to prior data!

PCE (y/y) Actual Prior
Expected
Headline +2.6% +2.6% +2.6%
Core +2.9% +2.8% +2.9%

This week, U.S. markets are closed on Monday for Labor Day.  Later in the week, we’ll get the latest PMI data, as well as JOLTs and NFP.

Best to Your Week!

P.S. If you find this research helpful, please tell a friend.
If you don’t, tell an enemy.
Sources: Bloomberg, CNBC, Federal Reserve Bank of St. Louis, Hedgeye, Stockcharts.com, TradingEconomics.com, U.S. Bureau of Economic Analysis, U.S. Bureau of Labor Statistics, TradingEconomics.com

Invest Safely, LLC is an independent investment research and online financial media company.  Use of Invest Safely, LLC and any other products available through invest-safely.com is subject to our Terms of Service and Privacy Policy.
Not a recommendation to buy or sell any security.
Posted in Historical Data, Market Trends | Tagged , , , | Comments Off on Stock Market Outlook – August 31 2025

Stock Market Outlook – August 24 2025

Stock Market Outlook entering the Week of August 24th = Uptrend

ANALYSIS
The stock market outlook continues to show an uptrend for U.S. equities, though institutional selling increased again.

The S&P500 ( $SPX ) rose 0.3%.  The index sits ~3% above the 50-day moving average and ~9% above the 200-day moving average.

The market encountered more distribution days last week, bringing the total to 7.  Price remains above the 50-day, and bounced on Friday, so the signal remains neutral for now.  On-balance volume also eased the past few weeks and is now resting on its moving average.

Technical analysis of daily SPX prices

SPX Price & Volume Chart for Aug 24 2025

PERFORMANCE COMPARISONS
Energy ( $XLE ) led sectors higher, while Technology was underperformed ( $XLK ).  Energy and Real Estate ( $XLE & $XLRE ) regained bullish bias.

Weekly price performance of S&P500 sector ETFs

S&P Sector Performance from Week 34 of 2025

Small cap value ( $IWN ) outperformed for a second straight week, while Large Cap Growth was the laggard ( $OEF ).  No changes in bias; all styles are bullish.

Weekly price performance by sector style

Sector Style Performance from Week 34 of 2025

Oil ( $USO ) led assets higher and Bitcoin ( $IBIT ) underperformed.  Gold ( $GLD ) is back to bullish bias after some recent weakness.

Weekly price performance by asset class

Asset Class Performance from Week 34 2025

COMMENTARY
After 4 straight days of selling in U.S. equity indexes, Federal Reserve Chairman Powell came to the rescue on Friday.  During his remarks from Jackson Hole, signaled a potential shift in the interest rate discussion. In particular, most people focused on the following statement:

“…with policy in restrictive territory, the baseline outlook and the shifting balance of risks may warrant adjusting our policy
stance.”

Those words were interpreted as an interest rate cut is coming in September.  Some are going further, using what Powell didn’t say as an indicator the Fed has stopped pursuing the 2% inflation target as a near-term goal, and will focus policy on labor and economic growth.  Time will tell.  Prior to the next FOMC meeting, there’s another round of inflation data ( PCE, CPI, and PPI ), as well as the August non-farm payrolls data.

If/when rates are lowered, expect to see a reduction in your short-term interest payments ( savings accounts, interest-bearing checking accounts, money markets, short-term bonds, etc. ).

A quick note about the signals presented above, specifically the institutional selling.  Given the relative weighting of technology stocks ( e.g. Mag 7 ), the index can suffer from market-cap distortions, where downside moves are caused by just a few stocks.  This can make the overall market drop, while a majority of tickers are breakeven or higher.

The tables above show that Technology/Communications sectors and Mega/Large Cap growth styles underperformed last week, and likely drove a lot of the action at an index level.  Recent underperformers and/or bias tests have bounced back as well, meaning the the high volume likely reflects end of summer asset reallocation, rather than outright selling of equities ( which we’ve discussed over the past few weeks as a wise move for your holdings as well ).

This week, we get an updated Q2 GDP figure Thursday and the aforementioned PCE reading for July on Friday. All of which could be overshadowed by Nvidia earnings Wednesday after market close.

Best to Your Week!

P.S. If you find this research helpful, please tell a friend.
If you don’t, tell an enemy.
Sources: Bloomberg, CNBC, Federal Reserve Bank of St. Louis, Hedgeye, Stockcharts.com, TradingEconomics.com, U.S. Bureau of Economic Analysis, U.S. Bureau of Labor Statistics, TradingEconomics.com

Invest Safely, LLC is an independent investment research and online financial media company.  Use of Invest Safely, LLC and any other products available through invest-safely.com is subject to our Terms of Service and Privacy Policy.
Not a recommendation to buy or sell any security.
Posted in Historical Data, Market Trends | Tagged , , , | Comments Off on Stock Market Outlook – August 24 2025