Stock Market Outlook – June 29 2025

Stock Market Outlook entering the Week of June 29th = Uptrend

  • Average Directional Index: Uptrend
  • Institutional Activity: Uptrend
  • On Balance Volume: Uptrend

ANALYSIS
The stock market outlook continues to show an uptrend in place, with equity indexes returning to all time highs.

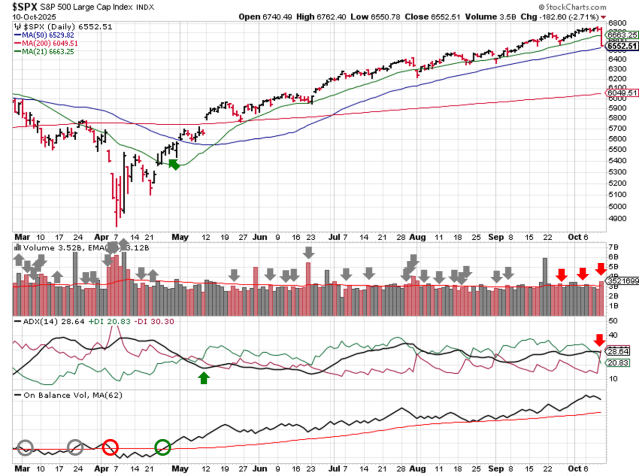
The S&P500 ( $SPX ) gained 3.4% last week.  The index sits ~6% above the 50-day moving average and ~6% above the 200-day moving average.

Technical analysis of daily SPX prices

SPX Price & Volume Chart for June 29 2025

All three technical indicators are bullish after last week’s price and volume action.

PERFORMANCE COMPARISONS

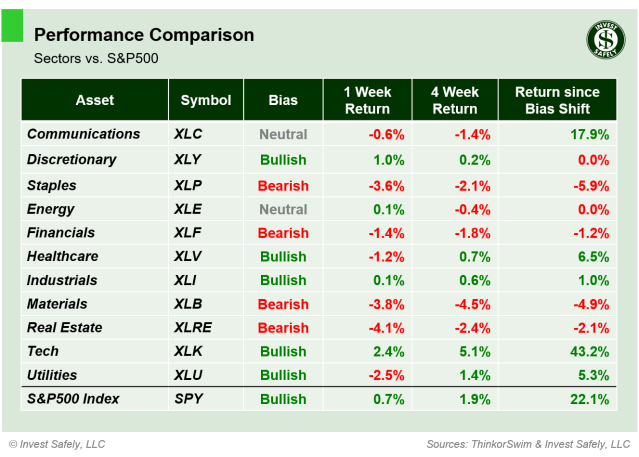
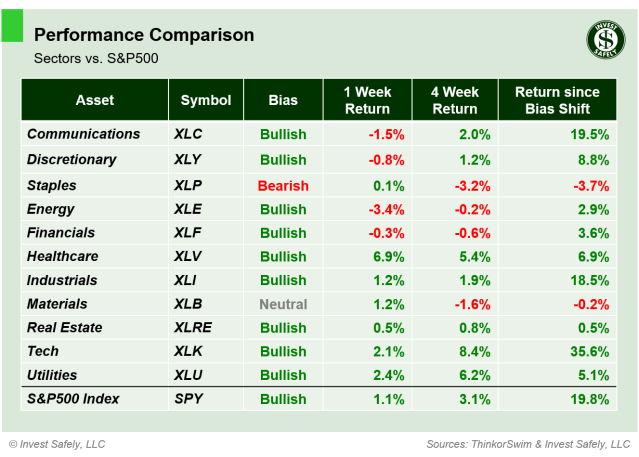
Weekly price performance of S&P500 sector ETFs

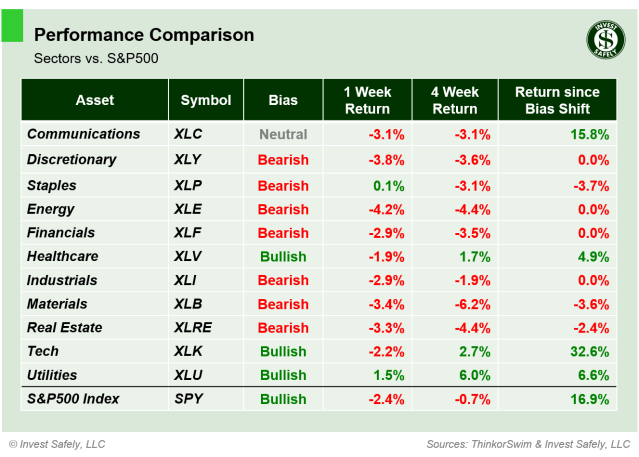
S&P Sector Performance from Week 26 of 2025

The Communications sector ( $XLC ) led to the upside with Technology ( $XLK ) a close second, thanks to Mag 7 companies.  After recently leading stocks higher, Energy ( $XLE ) sold off with oil prices.  No changes in bias last week.

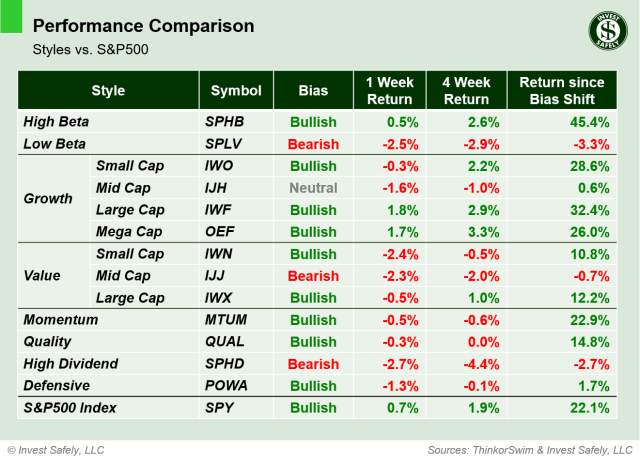
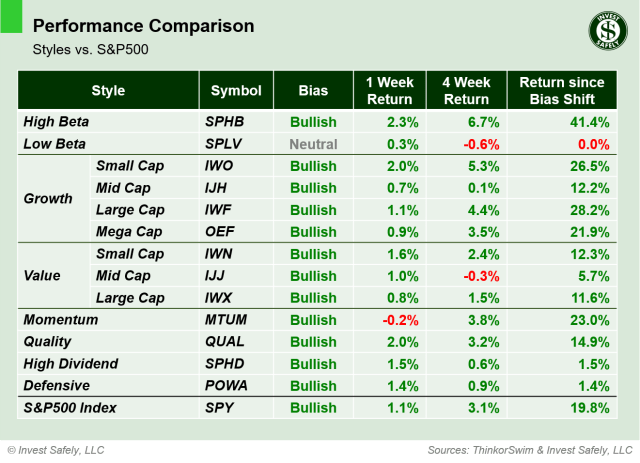
Weekly price performance by sector style

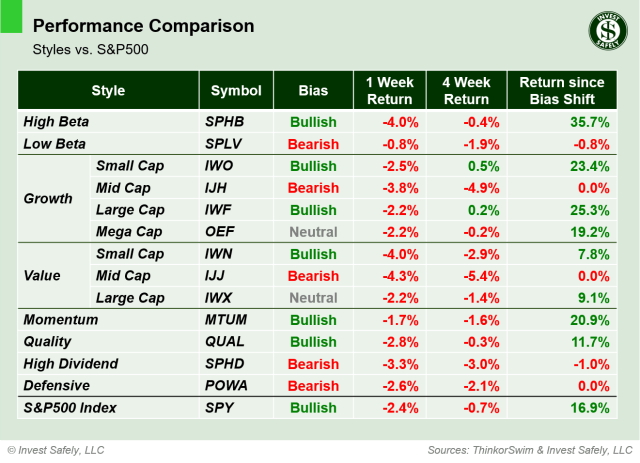
Sector Style Performance from Week 26 of 2025

All styles gained ground last week, with High Beta ( $SPHB ) leading the way and High Dividend ( $SPHD ) bringing up the rear.  Low Beta and High Dividend styles ( $SPLV & $SPHD ) bounced back to bullish bias.

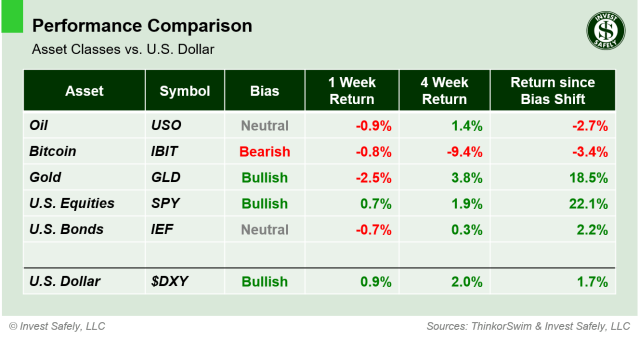
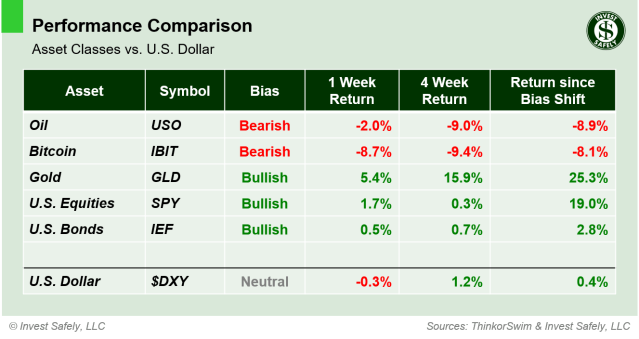
Weekly price performance by asset class

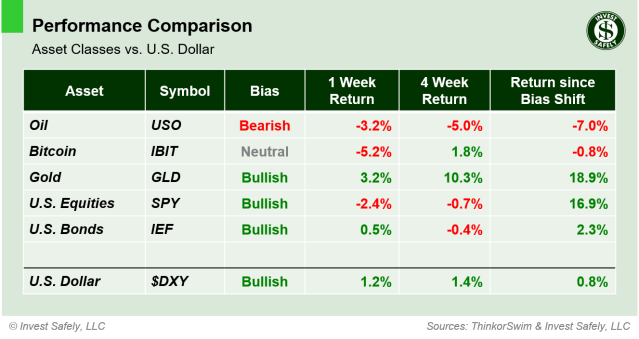
Asset Class Performance from Week 26 2025

Bitcoin and Equities ( $IBIT & $SPY ) outperforming other asset classes, reflecting a risk-on environment.  Oil ( $USO ) cratered, falling almost 12% and giving back a little more than half of it’s gain over the past 4 weeks.  Oil and Gold ( $USO & $GLD ) retreated to neutral bias, while bonds ( $IEF ) make another swing into bullish territory.

COMMENTARY
Geopolitical headlines continue to drive market volatility as we close out the June and the second quarter. Conflict deescalation and easing tensions in the Middle East mitigated the recent spike in oil prices, while social media posts concerning trade deals with Canada and China caused large, intraday price swings in equities. This environment will extend into early July, at least, as markets key-in on the expiring suspension of “Liberation Day” tariffs.

Federal Reserve Chairman Powell testified before Congress last week, focusing on the potential inflation in response to tariffs. He repeated recent comments that the FOMC well-positioned to wait and see how the economy responds before making a decision on interest rates.

Durable goods orders spiked in May, rising 16.4%, after dropping ~7% in April, highlighting tariff uncertainty moving through supply chains.

PCE showed inflation rising in 0.1% in May, and that’s after an upward adjustment of 0.1% to April’s Headline and Core figures.

PCE (y/y) Actual Prior
Expected
Headline +2.3% +2.2%* +2.3%
Core +2.7% +2.6%* +2.7%

And finally, the final GDP revision shows the economy contracted by 0.5% in the first quarter, down from the second estimate at -0.2%, and falling 1.1% year-over-year. The third estimate was lower mainly as a result of downward revisions to consumer spending and exports.

A short trading week ahead, with U.S. markets closing early on Thursday and completely on Friday for Independence Day.

Best to Your Week!

P.S. If you find this research helpful, please tell a friend.
If you don’t, tell an enemy.

Sources: Bloomberg, CNBC, Federal Reserve Bank of St. Louis, Hedgeye, Stockcharts.com, TradingEconomics.com, U.S. Bureau of Economic Analysis, U.S. Bureau of Labor Statistics

Invest Safely, LLC is an independent investment research and online financial media company.  Use of Invest Safely, LLC and any other products available through invest-safely.com is subject to our Terms of Service and Privacy Policy.
Not a recommendation to buy or sell any security.
Posted in Historical Data, Market Trends | Tagged , , , | Comments Off on Stock Market Outlook – June 29 2025

Stock Market Outlook – June 22 2025

Stock Market Outlook entering the Week of June 22nd = Uptrend

  • Average Directional Index: Neutral
  • Institutional Activity: Uptrend
  • On Balance Volume: Uptrend

ANALYSIS
The stock market outlook starts the week in an uptrend, pending market reactions to geopolitical events this weekend.

The S&P500 ( $SPX ) lost 0.2% last week.  The index sits ~4% above the 50-day moving average and ~3% above the 200-day moving average.

Technical analysis of daily SPX prices

SPX Price & Volume Chart for June 22 2025

Institutional Activity and On-Balance Volume ( OBV ) are bullish, though OBV did weaken a bit.  The ADX indicator is currently neutral.

Weekly price performance of S&P500 sector ETFs

S&P Sector Performance from Week 25 of 2025

Energy ( $XLE ) led sectors higher again last week; the only one to manage a gain.  Healthcare ( $XLV ) lagged the most, and dropped to bearish bias.

Weekly price performance by sector style

Sector Style Performance from Week 25 of 2025

All styles lost ground last week; High Beta ( $SPHB ) was the best performer, while Quality ( $QUAL ) was the worst.  Low Beta and High Dividend styles ( $XPLV & $SPHD ) fell back to neutral bias.

Weekly price performance by asset class

Asset Class Performance from Week 25 2025

Oil ( $USO ) led assets higher again, and is now risen more than 20% in the past 4 weeks.  Bitcoin was the worst performer, continuing to act like a risk-asset rather than a store of value.

COMMENTARY
The U.S. military bombed Iranian nuclear facilities Saturday evening. At the moment, we’re waiting for the response, and the response to the response, both geopolitically and in markets. Besides the price volatility we’ll see when futures trading opens ( Sunday 6pm ET ), this is also certain: initial actions always create responses that are unanticipated and unintended. Something something, causal relationships and feedback loops, something something.

Macro-wise, May retail sales were worse than expected, falling 0.9%. The FOMC left rates unchanged, citing the unknown impact of recently enacted U.S. economic policies. This week, Federal Reserve Chair Powell gets interrogated by will deliver testimony to Congress, the third and final Q1 GDP revision is released, as well as May Durable Goods and PCE data.

Best to Your Week!

P.S. If you find this research helpful, please tell a friend.
If you don’t, tell an enemy.

Sources: Bloomberg, CNBC, Federal Reserve Bank of St. Louis, Hedgeye, Stockcharts.com, TradingEconomics.com, U.S. Bureau of Economic Analysis, U.S. Bureau of Labor Statistics

Invest Safely, LLC is an independent investment research and online financial media company.  Use of Invest Safely, LLC and any other products available through invest-safely.com is subject to our Terms of Service and Privacy Policy.
Not a recommendation to buy or sell any security.
Posted in Historical Data, Market Trends | Tagged , , , | Comments Off on Stock Market Outlook – June 22 2025

Stock Market Outlook – June 15 2025

Stock Market Outlook entering the Week of June 15th = Uptrend

  • ADX Directional Indicators: Uptrend
  • Institutional Activity (Price & Volume): Uptrend
  • On Balance Volume Indicator: Uptrend

ANALYSIS
The stock market outlook stays in an uptrend, despite intensifying conflict on the world stage.

The S&P500 ( $SPX ) lost 0.4% last week.  The index sits ~6% above the 50-day moving average and ~3% above the 200-day moving average.

Technical analysis of daily SPX prices

SPX Price & Volume Chart for June 15 2025

The ADX, Institutional Activity, and On-Balance Volume are all in bullish territory.  Distribution days remain low, but are worth watching over the next week or two.

Weekly price performance of S&P500 sector ETFs

S&P Sector Performance from Week 24 of 2025

Energy ( $XLE ) led sectors higher last week, while Industrials ( $XLI ) lagged.  Energy ( $XLE ) and Healthcare ( $XLV ) improved to bullish bias.

Weekly price performance by sector style

Sector Style Performance from Week 24 of 2025

High Beta ( $SPHB ) was the best performing style for the second week in a row, and Momentum ( $MTUM ) lagged.  High Dividend ( $SPHD ) improved to bullish bias.

Weekly price performance by asset class

Asset Class Performance from Week 24 2025

Oil ( $USO ) led assets higher again last week, while the U.S. Dollar was the worst performer.  U.S. Bonds ( $IEF ) improved to neutral again, continuing its recent oscillations between bias levels.

COMMENTARY
The uptrend in equities has remained quite resilient despite recent increases global conflict.  Many market participants point out that the typical “flight to safety” trade (U.S. bonds) hasn’t occurred, so financial markets are saying all is well.  That’s no reason to get complacent.

This time around, flows shifted more toward hard assets like gold or platinum, rather than U.S.-based assets like the dollar and bonds.  Even silver has been on the move.  So the flight to safety is on, just not into the traditional allocations.

The volatility index ( $VIX ) is back above 20 as well, signaling elevated risk and choppy price action ( <20 = low risk / calm, 20-30 = elevated risk / choppy, >30 = high risk / crash ).

For now, continue harvesting gains from outperforming / overbought areas and redeploy to those that are lagging / oversold, within assets showing bullish bias.  But be aware that the investing environment can and does change quickly.

Inflation data rose slightly in May, though not as much as anticipated in most cases.  Headline CPI rose 0.1%, while Core CPI remained steady.

CPI (y/y) Actual Prior
Expected
Headline +2.4% +2.3% +2.5%
Core +2.8% +2.8% +2.9%

Headline PPI rose in May, while Core PPI fell.  April data was revised higher by +0.1%.

PPI (y/y) Actual Prior
Expected
Headline +2.6% +2.5% +2.6%
Core +3.0% +3.2%* +3.1%

This week, May retail sales data comes out Tuesday, FOMC makes another interest rate decision Wednesday, and US markets are closed Thursday for Juneteenth.

Best to Your Week!

P.S. If you find this research helpful, please tell a friend.
If you don’t, tell an enemy.

Sources: Bloomberg, CNBC, Federal Reserve Bank of St. Louis, Hedgeye, Stockcharts.com, TradingEconomics.com, U.S. Bureau of Economic Analysis, U.S. Bureau of Labor Statistics

Invest Safely, LLC is an independent investment research and online financial media company.  Use of Invest Safely, LLC and any other products available through invest-safely.com is subject to our Terms of Service and Privacy Policy.
Not a recommendation to buy or sell any security.
Posted in Historical Data, Market Trends | Tagged , , , | Comments Off on Stock Market Outlook – June 15 2025

Stock Market Outlook – June 08 2025

Stock Market Outlook entering the Week of June 8th = Uptrend

  • ADX Directional Indicators: Uptrend
  • Institutional Activity (Price & Volume): Uptrend
  • On Balance Volume Indicator: Uptrend

ANALYSIS
The stock market outlook stays in an uptrend, while the S&P500 breached 6000 again.

The S&P500 ( $SPX ) gained 1.5% last week.  The index sits ~7% above the 50-day moving average and ~4% above the 200-day moving average.

Technical analysis of daily SPX prices

SPX Price & Volume Chart for June 08 2025

The ADX, Institutional Activity, and On-Balance Volume are all in bullish territory.

Weekly price performance of S&P500 sector ETFs

S&P Sector Performance from Week 23 of 2025

The Tech sector ( $XLK ) led sectors higher last week, while Consumer Staples were the worst.  Energy ( $XLE ) improved to neutral bias.

Weekly price performance by sector style

Sector Style Performance from Week 23 of 2025

High Beta and Small Cap Growth ( $SPHB & IWO ) were the best performing styles, each gaining ~4%.  Low beta ( $SPLV ) was the worst.  High Dividend ( $SPHD ) improved to neutral bias.

Weekly price performance by asset class

Asset Class Performance from Week 23 2025

Oil ( $USO ) led assets higher last week, and moved from bearish to bullish bias in the process.  U.S. Bonds ( $IEF ) were the worst asset, and moved back to bearish from neutral bias.

COMMENTARY
Short post today since it’s my birthday.

ISM manufacturing was inline, though still showing contraction (below 50).  Services surprised to the downside and falling back into a contraction.  Labor readings were mixed; JOLTS was slightly higher, while non-farm payrolls were slightly lower.

This week, we get May inflation data CPI/PPI and June Consumer Sentiment.

Best to Your Week!

P.S. If you find this research helpful, please tell a friend.
If you don’t, tell an enemy.

Sources: Bloomberg, CNBC, Federal Reserve Bank of St. Louis, Hedgeye, Stockcharts.com, TradingEconomics.com, U.S. Bureau of Economic Analysis, U.S. Bureau of Labor Statistics

Invest Safely, LLC is an independent investment research and online financial media company.  Use of Invest Safely, LLC and any other products available through invest-safely.com is subject to our Terms of Service and Privacy Policy.
Not a recommendation to buy or sell any security.
Posted in Historical Data, Market Trends | Tagged , , , | Comments Off on Stock Market Outlook – June 08 2025

Stock Market Outlook – June 01 2025

Stock Market Outlook entering the Week of June 1st = Uptrend

  • ADX Directional Indicators: Uptrend
  • Institutional Activity (Price & Volume): Uptrend
  • On Balance Volume Indicator: Uptrend

ANALYSIS
The stock market outlook stays in an uptrend, after equities found support at the 200-day moving average and rallied out of the Memorial Day weekend.

The S&P500 ( $SPX ) gained 1.9% last week.  The index sits ~5% above the 50-day moving average and ~2% above the 200-day moving average.

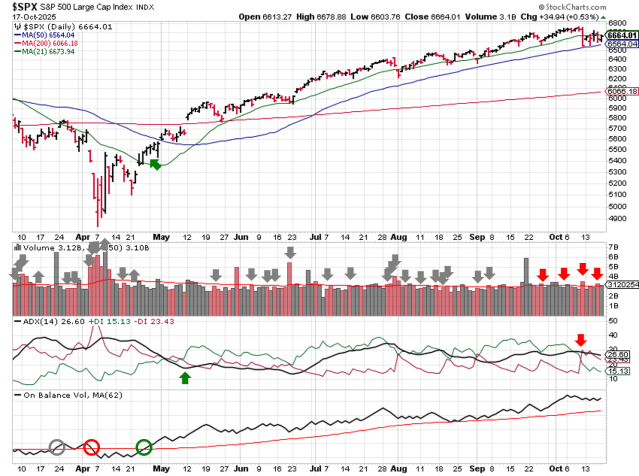
Technical analysis of daily SPX prices

SPX Price & Volume Chart for June 01 2025

The ADX, Institutional Activity, and On-Balance Volume are all in bullish territory.

Weekly price performance of S&P500 sector ETFs

S&P Sector Performance from Week 22 of 2025

Real Estate ( $XLRE ) led sectors higher last week, and bounced back to bullish bias after testing a change last week.  Energy ( $XLE ) was the worst performer.

Weekly price performance by sector style

Sector Style Performance from Week 22 of 2025

All sector styles gained last week, with Momentum ( $MTUM ) leading the way and  Defensive ( $POWA ) bringing up the rear.  High Dividend ( $SPHD ) improved to neutral bias.

Weekly price performance by asset class

Asset Class Performance from Week 22 2025

Stocks and Bonds ( $SPY & $IEF ) were the winning plays, while Bitcoin ( $IBIT ) ran into some liquidation flows and dropped 6%. Bonds ( $IEF ) moved from bearish to neutral bias.

COMMENTARY
After Tuesday’s opening rally, equities didn’t make much progress and suffered from a lot of intraday volatility.  Macro data was in-line with expectations, and NVIDIA earnings were well received.

After rising more than 7% in March on tariff front-running, Durable Goods Orders fell 6% in April.  No surprise here.

Last month’s FOMC minutes were released Wednesday.  Participants felt tariff increases were significantly larger and more extensive than anticipated, and noted a high level of  uncertainty around trade policy and resulting impacts to the economy.  That said, they feel they’re well positioned, choosing to wait for more clarity from inflation and labor data.

As for the Federal Reserves favored inflation measure, both Headline and Core PCE fell 20 basis points year over year, inching closer to the Feds 2% target.

Finally, the second GDP revision was revised higher by 10 bps, but still negative Q1.

This week, ISM Manufacturing and Services PMIs, JOLTS, and non-farm payroll data are released.

Typically, late May to early June is a strong period for equities, then performance wanes as we close out the month.  Headline volatility remains a risk, with markets hyper-fixated on tariff news.  Key levels to watch are the prior all time highs from February and the gaps in price action from April and May.

Best to Your Week!

P.S. If you find this research helpful, please tell a friend.
If you don’t, tell an enemy.
Sources: Bloomberg, CNBC, Federal Reserve Bank of St. Louis, Hedgeye, Stockcharts.com, TradingEconomics.com, U.S. Bureau of Economic Analysis, U.S. Bureau of Labor Statistics

Invest Safely, LLC is an independent investment research and online financial media company.  Use of Invest Safely, LLC and any other products available through invest-safely.com is subject to our Terms of Service and Privacy Policy.
Not a recommendation to buy or sell any security.
Posted in Historical Data, Market Trends | Tagged , , , | Comments Off on Stock Market Outlook – June 01 2025

Stock Market Outlook – May 25 2025

Stock Market Outlook entering the Week of May 25th = Uptrend

  • ADX Directional Indicators: Uptrend
  • Institutional Activity (Price & Volume): Uptrend
  • On Balance Volume Indicator: Uptrend

ANALYSIS
The stock market outlook stays in an uptrend, as equities retreated to the 200-day moving average.

The S&P500 ( $SPX ) fell 2.6% last week.  The index sits ~4% above the 50-day moving average and ~1% above the 200-day moving average.

Technical analysis of daily SPX prices

SPX Price & Volume Chart for May 25 2025

All three technical indicators remain bullish. The Direction Indicator ( ADX ) could flip to bearish if price decides to head lower and fill the May 12 gap.

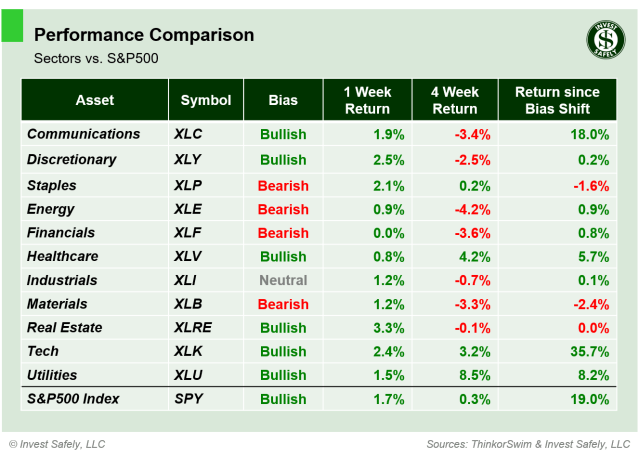
Weekly price performance of S&P500 sector ETFs

S&P Sector Performance for Week 22 of 2025

Consumer Staples ( $XLP )  held up the best last week, while Energy ( $XLE ) was the worst performer and fell back down to bearish bias.  Real estate ( $XLRE )  slid to neutral on the rise in treasury yields.

Weekly price performance by sector style

Sector Style Performance for Week 22 of 2025

Low Beta ( $SPLV ) was the best style last week, while High Beta ( $SPLV ) was the worst.  High Dividend ( $SPHD ) fell to Bearish bias as well, hit by weak equity performance and interest rates.

Weekly price performance by asset class

Asset Class Performance for Week 22 2025

Gold ( $GLD ) clawed back some gains last week, followed closely by Bitcoin ( $IBIT ),  while equities led to the downside ( $SPY ) was the worst performer.  No bias changes to report.

COMMENTARY
Equity indexes gave back some of their recent gains last week and tested support at the 50-day moving average.  Headline volatility remains a risk, with markets hyper-fixated on tariff news.

On Thursday, the U.S. House of Representatives passed the “Big, Beautiful” tax bill, which is front loaded with tax cuts and back loaded with spending reductions. The Congressional Budget Office estimates that the bill would add ~$3 trillion to the deficit over the next ten years, but that’s also front loaded.

While the tax cuts and new spending are likely to have a stimulative effect in the short term, the bond market responded by sending the 10-year yield above 4.5% and the 30-year above 5%. Bond markets are paying attention to government debt and related costs. The interest paid by the U.S. government is already approaching historic levels, and financing this additional debt at higher rates will push the interest paid even higher, thereby putting more upward pressure on treasury yields.

Looking ahead, markets are closed tomorrow for Memorial Day.  Data-wise, we get the latest Durable Goods Orders on Tuesday, FOMC minutes Wednesday, a revised GDP figure Thursday, and PCE on Friday.

Trading volume was below average last week, which should’ve created some decent entry points for long set-ups.  Look for tickers with a bullish bias that break out of proper set-ups when trading resumes.

Best to Your Week!

P.S. If you find this research helpful, please tell a friend.
If you don’t, tell an enemy.
Sources: Bloomberg, CNBC, Federal Reserve Bank of St. Louis, Hedgeye, Stockcharts.com, TradingEconomics.com, U.S. Bureau of Economic Analysis, U.S. Bureau of Labor Statistics

Invest Safely, LLC is an independent investment research and online financial media company.  Use of Invest Safely, LLC and any other products available through invest-safely.com is subject to our Terms of Service and Privacy Policy.
Not a recommendation to buy or sell any security.
Posted in Historical Data, Market Trends | Tagged , , , | Comments Off on Stock Market Outlook – May 25 2025

Stock Market Outlook – May 18 2025

Stock Market Outlook entering the Week of May 18th = Uptrend

  • ADX Directional Indicators: Uptrend
  • Institutional Activity (Price & Volume): Uptrend
  • On Balance Volume Indicator: Uptrend

ANALYSIS
The stock market outlook stays in an uptrend, as equities rallied out of a short consolidation.

The S&P500 ( $SPX ) gained 5.3% last week.  The index sits ~7% above the 50-day moving average and ~3% above the 200-day moving average, roughly the same position as last Sunday.

Technical analysis of daily SPX prices

SPX Price & Volume Chart for May 18 2025

All three technical indicators are bullish. The Direction Indicator ( ADX ) flipped on the gap higher Monday.

Weekly price performance of S&P500 sector ETFs

S&P Sector Performance for Week 21 of 2025

Technology ( $XLK ) led the way last week, up an amazing 8%.  Healthcare ( $XLV ) was the worst sector again.  Consumer Staples ( $XLP ) and Energy ( $XLE ) jumped up to bullish, leaving Healthcare ( $XLV ) as the lone bearish sector

Weekly price performance by sector style

Sector Style Performance for Week 21 of 2025

High Beta ( $SPHB ) was the best style again last week, and is up 14% since turning bullish. The lowest performer was Low Beta ( $SPLV ) with a 1.5% gain.  Mega-cap Growth, Small and Mid-cap Value, Quality and high Dividend ( $OEF, $IWN, $IJJ, $QUAL, $SPHD ) all improved to bullish bias.

Weekly price performance by asset class

Asset Class Performance for Week 21 2025

U.S. Equities ( $SPY ) led assets higher.  Gold ( $GLD ) was the worst performer.  In terms of bias, U.S. bonds continue to weaken on higher interest rates, pushing $IEF down into bearish bias.

COMMENTARY
Equity indexes gapped higher on the open Monday, in response to the U.S. and China trade deal details, and closed higher every session.  The only downside is that stocks are back in overbought territory!

Consumer Price data shows headline inflation fell in April, while core remained flat; price increases from tariffs haven’t made their way through supply chains yet.  On top of those data points, both measures had their March figures revised lower as well.

CPI (y/y) Actual Prior
Expected
Headline +2.3% +2.4% +2.4%
Core +2.8% +2.8% +2.8%

As far as producers were concerned ( PPI ) , headline and core fell in April.  But, as expected, March data was revised significantly higher ( +0.7% for both headline and core ).  I’d expect the impact of tariffs to start showing up in May and June readings, but only slightly due to the pauses put in place.

PPI (y/y) Actual Prior
Expected
Headline +2.4% +3.4% +2.5%
Core +3.1% +4.0%* +3.1%

After market’s closed on Friday, Moody’s downgraded the United States credit rating, from Aaa to Aa1, citing growing government debt. There was a lot of ink/electrons spilled over the weekend on the subject, but the decision is inline with earlier decisions by the 2 other rating agencies: Standard & Poor’s downgraded the U.S. in August 2011, and Fitch in August 2023. All 3 still give the U.S. their 2nd highest rating. In terms of a market response, the initial reaction probably sends rates higher and equities/bonds lower in the pre-market session.

Best to Your Week!

P.S. If you find this research helpful, please tell a friend.
If you don’t, tell an enemy.
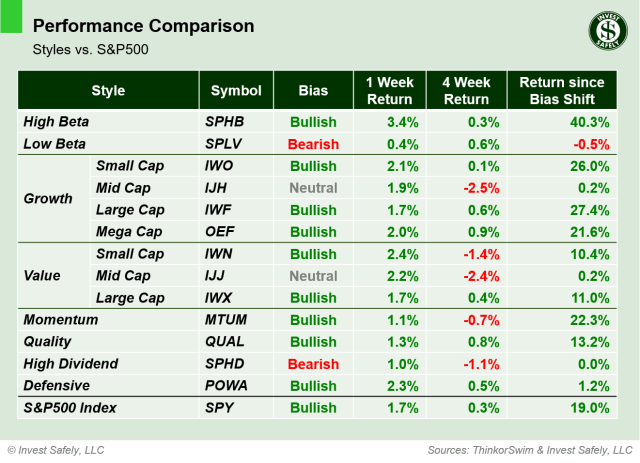
Sources: Bloomberg, CNBC, Federal Reserve Bank of St. Louis, Hedgeye, Stockcharts.com, TradingEconomics.com, U.S. Bureau of Economic Analysis, U.S. Bureau of Labor Statistics

Invest Safely, LLC is an independent investment research and online financial media company.  Use of Invest Safely, LLC and any other products available through invest-safely.com is subject to our Terms of Service and Privacy Policy.
Not a recommendation to buy or sell any security.
Posted in Historical Data, Market Trends | Tagged , , , | Comments Off on Stock Market Outlook – May 18 2025