As negative on stocks as Warren Buffett

A few weeks back, I mentioned that it was a difficult time to be an investor; stocks just seemed to go up and up, with little or no relationship to technical or fundamental data.

Several readers took exception to my statement, and wanted to know why I was so negative on stocks. I replied that I wasn’t trying to be negative. There just weren’t many stocks that met my criteria.

After reading this year’s annual letter from Berkshire Hathaway, I see that I’m not alone in my thoughts on the current state of the market. Page 4 of the letter states (emphasis added):

“In our search for new standalone businesses, the key qualities we seek are durable competitive strengths, able and high grade management, good returns on the net tangible assets required to operate the business, opportunities for integral growth at attractive returns, and a sensible purchase price.

The last requirement proved a barrier to virtually all deals we reviewed in 2017, as prices for decent, but far from spectacular, businesses hit an all time high. Indeed, price seemed almost irrelevant to an army of purchasers.”

Think about it. Warren Buffett had a hard time finding investments that met his investing criteria, and he’s one of the most positive people around when it comes to investing U.S. stock markets. Even prices for “decent” companies were too high!

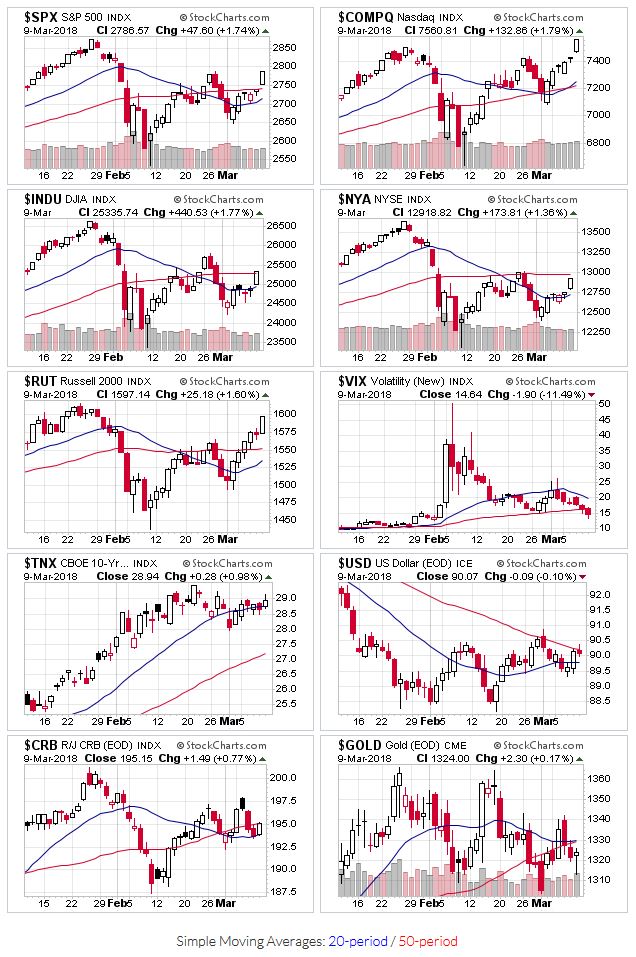
For growth investing, I can relate this statement to criteria like sales, earnings per share, and institutional support.  Between stock buybacks and the search for yield, that army of purchasers went after everything, including companies with sales and earnings per share that were just “okay” by historical standards. In essence there was high pay for minimal performance…definitely not sensible.  You can even see this from a technical perspective, as prices were extended from proper bases and entry points when looking at the charts.

On the income side (particularly dividend investing), I can see things like competitive strengths, high grade management, and internal growth manifesting in a company’s ability to maintain dividend growth without expanding the payout ratio. Most of the stocks on my screen have no problem here. As with growth investing, the issue occurs when adding the requirement for a “sensible purchase price”. The P/E ratio is one way to evaluate whether stocks are priced sensibly, verses long-term historical norms.  Since almost all stocks that met my criteria also had P/E’s above 20, history says they won’t provide much cushion for riding out the next downturn (this was still true even after the February sell off!).

One thing is certain. The best time to buy stocks is when they are oversold; like after a bear market or some other disconnect between fundamentals and technicals (i.e. market crash). That is when the best stocks can be acquired for peanuts…and Berkshire will have a LOT of peanuts.

Posted in Current Events, Investing | Tagged , , , , | Comments Off on As negative on stocks as Warren Buffett

Weekend Stock Market Outlook

Stock Market Outlook entering the Week of March 18th = Uptrend

  • 20/50 Day Moving Averages: Uptrend
  • Price & Volume Action: Uptrend
  • Objective Elliott Wave Analysis: Uptrend

COMMENTARY
The stock market outlook remains in uptrend territory to kick off the first week of spring.  All eyes will be on the U.S. Federal Reserve this week; another quarter-point rate hike is expected by the end of their 2-day meeting.

Most of the indexes remain above their 20 and 50 day moving averages.  The DJIA lags other averages, sitting below both those technical indicators.

Price Charts for $SPX,$COMPQ,$INDU,$NYA,$RUT,$VIX,$TNX,$USD,$CRB,$GOLD

2018-03-18 – US Stock Market Averages

Price and volume action also stays in uptrend territory. The distribution day count remains manageable. Note: Trading volume spiked last Friday on option / futures contract expirations.

OEW remains in an uptrend.  In a nod to the bulls, Tony no longer sees a massive sell-off anytime soon, stating:

After a January all-time high of SPX 2873, ending a strong 10-month uptrend. A drop of nearly 12% in two weeks followed. The perma-bears were back out in force. The crash they keep calling for has already occurred: 2007-2009. Those types of events only occur once in a lifetime. There will be bear markets in the future. But nothing like that for a very long time.

I’m looking for a potential replacement for the 20/50 day moving average; an indicator that works well when markets are volatile and/or extended from trending indicators such as moving averages. The Average Directional Index (ADX) caught my eye because it flashed a sell signal for the $SPX just ahead of the February sell off.  At the moment, it’s showing a bearish environment (DI- is higher than DI+) that’s weakening (ADX is declining).


If you find this research helpful, please tell a friend. If you don’t find it helpful, tell an enemy. I share articles and other news of interest via Twitter; you can follow me @investsafely. The weekly market outlook is also posted on Facebook and Linkedin.

You can check out how well (or poorly) the outlook has tracked the market using past performance estimates:

For the detailed Elliott Wave Analysis, go to the ELLIOTT WAVE lives on by Tony Caldaro.  Charts provided courtesy of stockcharts.com.


Posted in Historical Data, Market Trends, Other Blogs | Tagged , , , , | Comments Off on Weekend Stock Market Outlook

Weekend Stock Market Outlook

Stock Market Outlook entering the Week of March 11th = Uptrend

  • 20/50 Day Moving Averages: Uptrend
  • Price & Volume Action: Uptrend
  • Objective Elliott Wave Analysis: Uptrend

COMMENTARY
Friday’s impressive break-out put the averages back on solid footing, and all three signals are green to start this week.  The Nasdaq leads the way, jumping to new highs; the Russell 2000 is a close second place.

The indexes reversed course last week, and all of them start this week above their 20 and 50 day moving averages.

Price charts for $SPX,$COMPQ,$INDU,$NYA,$RUT,$VIX,$TNX,$USD,$CRB,$GOLD

2018-03-11 – US Stock Market Averages

Price and volume action is back into uptrend territory.  Growth stocks showed signs of life and indexes are back above their 50-day moving averages.  That said, most growth stocks are still outside of buy zones, so we’ll have to see if they set up some flat bases, or if new leaders arise.

OEW continues to see an uptrend.

During the past few weeks, the outlook signal switched back and forth between uptrends and downtrends. This type of action is a common aspect of trading systems, regardless of analysis technique. Certain methods work better under certain conditions, which is why a combination of signals is better than just one. That said, there are no guarantees, regardless of how many signals you use.

Which, in turn, is an important reminder about the role of money management in your process. Make sure you always define the maximum allowable loss for each trade; 1% of the account value is what a majority of professionals use.


If you find this research helpful, please tell a friend. If you don’t find it helpful, tell an enemy. I share articles and other news of interest via Twitter; you can follow me @investsafely. The weekly market outlook is also posted on Facebook and Linkedin.

You can check out how well (or poorly) the outlook has tracked the market using past performance estimates:

For the detailed Elliott Wave Analysis, go to the ELLIOTT WAVE lives on by Tony Caldaro.  Charts provided courtesy of stockcharts.com.


Posted in Historical Data, Market Trends, Other Blogs | Tagged , , , , | Comments Off on Weekend Stock Market Outlook

Weekend Stock Market Outlook

Stock Market Outlook entering the Week of March 4th = Downtrend

  • 20/50 Day Moving Averages: Downtrend
  • Price & Volume Action: Downtrend
  • Objective Elliott Wave Analysis: Uptrend

COMMENTARY
Friday’s strong rally wasn’t enough to recover from them mid-week sell-off, putting the market outlook back in downtrend territory to start this week.  Plans for tariffs on steel and aluminum, and talk of the resulting trade-war didn’t do the investors any favors either.

We saw the Nasdaq retake the 50 day last week, but the other indexes weren’t so lucky.  A majority of the indexes start this week below the 20 and 50 day moving averages, so the signal changes to a downtrend.

Price charts for $SPX,$COMPQ,$INDU,$NYA,$RUT,$VIX,$TNX,$USD,$CRB,$GOLD

2018-03-04 – US Stock Market Averages

Price and volume action also switches to a downtrend.  Tuesday, Wednesday, and Thursday were distribution days, with markets falling on sequentially higher trading volume; a clear sign of institutional selling.  Breakouts continue to struggle.

OEW continues to see an uptrend, but doesn’t exclude the possibility that stock prices retest the February lows.


If you find this research helpful, please tell a friend. If you don’t find it helpful, tell an enemy. I share articles and other news of interest via Twitter; you can follow me @investsafely. The weekly market outlook is also posted on Facebook and Linkedin.

You can check out how well (or poorly) the outlook has tracked the market using past performance estimates:

For the detailed Elliott Wave Analysis, go to the ELLIOTT WAVE lives on by Tony Caldaro.  Charts provided courtesy of stockcharts.com.


Posted in Historical Data, Market Trends, Other Blogs | Tagged , , , , | Comments Off on Weekend Stock Market Outlook

Weekend Stock Market Outlook

Stock Market Outlook entering the Week of February 25th = Uptrend

  • 20/50 Day Moving Averages: Uptrend
  • Price & Volume Action: Uptrend
  • Objective Elliott Wave Analysis: Uptrend

COMMENTARY
We start the week in uptrend territory, but to took Friday’s close to get us there.  The shortened trading week was accompanied by lower trading volumes; a reprieve from the heavy volumes we saw two weeks ago.  Unfortunately, Friday’s rally occurred with really low trading volume.

Thanks to Friday’s surge, all the indexes start the week at or above their 50-day moving averages.

Price charts for $INDU,$NYA,$SPX,$USD,$COMPQ,$CRB,$RUT,$GOLD

2018-02-25 – US Stock Market Averages

Price and volume action stays in an uptrend.  High quality growth stock continue to work their way back to proper buy points.  Income stocks remain expensive based on historical price-earnings ratios.

OEW continues to see an uptrend.

Most of the markets leading growth stocks (e.g. chip makers, ‘FANG’ stocks) have rallied for over a year and are now in late-stage (i.e. their 3rd or 4th) bases. I wouldn’t be surprised to see some sector rotation as institutions look for new growth opportunity…maybe biomeds, as they sold off heavily during the same timeframe, regardless of financial performance.

In other news, Berkshire Hathaway released an annual report for 2017. It’s required reading, regardless of whether you consider yourself a “value” investor.


If you find this research helpful, please tell a friend. If you don’t find it helpful, tell an enemy. I share articles and other news of interest via Twitter; you can follow me @investsafely. The weekly market outlook is also posted on Facebook and Linkedin.

You can check out how well (or poorly) the outlook has tracked the market using past performance estimates:

For the detailed Elliott Wave Analysis, go to the ELLIOTT WAVE lives on by Tony Caldaro.  Charts provided courtesy of stockcharts.com.


Posted in Historical Data, Market Trends, Other Blogs | Tagged , , , , | Comments Off on Weekend Stock Market Outlook

Weekend Stock Market Outlook

Stock Market Outlook entering the Week of February 18th = Uptrend

  • 20/50 Day Moving Averages: Uptrend
  • Price & Volume Action: Uptrend
  • Objective Elliott Wave Analysis: Uptrend

COMMENTARY
Well, that was quick.  A 12% decline in 2 weeks, and now it’s back to “normal”.  The 200 day moving average held, and now stock prices sit at levels where the whole sell-off started.  Usually, prices will retest the lows at least once before rallying, but performance has been anything but typically over the past year and a half.

Market averages recovered significantly, with a majority of indexes trading at their 50-day moving averages.  The Nasdaq managed to rise above its 20 day moving average, and the Russell 2000 sit just below both.

Price charts for $INDU,$NYA,$SPX,$USD,$COMPQ,$CRB,$RUT,$GOLD

2018-02-18 – US Stock Market Averages

Price and volume action indicates a new uptrend is underway. Prices appear to have bottomed on March 9th, and then confirmed a new direction on the 14th by rising on higher than average volume.

OEW also switched back to an uptrend.  Tony created a “weekly rate of change” indicator that gave a buy signal last week; the signal has been 96% accurate over the past 50 years worth of S&P data.

Growth stocks are an area to watch over the next few weeks.  Very few leading stocks are offering good entry points; the best stocks (fundamentally) are still a few weeks away from proper set-ups (technically).  In this case, market conditions are suitable for new investments, but individual stocks are still working their way back.

Even with the sharp sell off, income stocks remain expensive.  As an example,  the P/E ratios for most “dividend kings” are still way above 20.  As Warren Buffett would say, the hamburgers are still really expensive.


If you find this research helpful, please tell a friend. If you don’t find it helpful, tell an enemy. I share articles and other news of interest via Twitter; you can follow me @investsafely. The weekly market outlook is also posted on Facebook and Linkedin.

You can check out how well (or poorly) the outlook has tracked the market using past performance estimates:

For the detailed Elliott Wave Analysis, go to the ELLIOTT WAVE lives on by Tony Caldaro.  Charts provided courtesy of stockcharts.com.


Posted in Historical Data, Market Trends, Other Blogs | Tagged , , , , | Comments Off on Weekend Stock Market Outlook

Weekend Stock Market Outlook

Stock Market Outlook entering the Week of February 11th = Downtrend

  • 20/50 Day Moving Averages: Downtrend
  • Price & Volume Action: Downtrend
  • Objective Elliott Wave Analysis: Downtrend

COMMENTARY
By now, you know that stocks sold off hard across the globe.  Price movements have been big, with intra-day price swings covering months of price movement (and that doesn’t include pre/post market trading).  And they’ve been swift, sometimes measured in a matter of minutes.

All the market indexes are below their 20-day and 50-day moving averages.  Several found support at their 200-day.  Given the nature of the sell-off (big and fast), the 50 day won’t be a good indicator to catch the start of the next uptrend.

Price charts for $INDU,$NYA,$SPX,$USD,$COMPQ,$CRB,$RUT,$GOLD

2018-02-11 – US Stock Market Averages

Price and volume action indicates a correction.  The growth stocks on my watch list have been weak for weeks, so most of my holdings had already been shown the door ahead of the sell-off.  Income stocks got hammered as well, so it may be time to check their valuations and see if you can pick some up on the cheap.

OEW switched to a downtrend.  They had some good news, with an expectation that we’ll reach new highs again once this downtrend bottoms.

So what happened?  We had a large, rapid sell off after a long, long period of time without one.  The initial cause is thought to be the rise in bond yields.  A secondary effect of the price movement was a spike in volatility (rate of change).

In the past few years, exchange traded funds and notes (ETFs / ETNs) have been created to calculate price based on volatility; both on the long side and the short side.  Those instruments had HUGE price movements in a short amount of time.  Those that were betting against rising volatility lost 90-95% of their value.  At that level of loss, the fund is usually forced to liquidate.  In order to liquidate, the funds managers had to raise capital, which required them to sell other instruments that still had value, namely stocks, sending prices down even more.

We didn’t need much downside movement to change the market outlook, so now our attention turns to finding the start of the next uptrend.   There are some that think this will be a V-shaped correction, and stock prices will recover as quickly as they’ve sold off.  They argue that corporate earnings are still robust, so the underlying fundamentals (revenues, profits, etc.) still justify higher prices.  I haven’t seen much commentary on the other side (that this is the start of a new bear market).


If you find this research helpful, please tell a friend. If you don’t find it helpful, tell an enemy. I share articles and other news of interest via Twitter; you can follow me @investsafely. The weekly market outlook is also posted on Facebook and Linkedin.

You can check out how well (or poorly) the outlook has tracked the market using past performance estimates:

For the detailed Elliott Wave Analysis, go to the ELLIOTT WAVE lives on by Tony Caldaro.  Charts provided courtesy of stockcharts.com.


Posted in Historical Data, Market Trends, Other Blogs | Tagged , , , , | Comments Off on Weekend Stock Market Outlook