Stock Market Outlook entering the Week of January 21st = Uptrend
- 20/50 Day Moving Averages: Uptrend
- Price & Volume Action: Uptrend
- Objective Elliott Wave Analysis: Uptrend
COMMENTARY
U.S. markets continue their winning ways, as the uptrend moves into the 4th week of trading in 2018. Every week, it seems like there is a new crisis for the market to overcome. This week we’re dealing a government shutdown, as members of the U.S. legislator could not come to terms on a funding bill. For reference, the last time we had a shutdown was back in October 2013. The markets dropped a little less than 5%, and then immediately recovered. Buy the dip indeed.
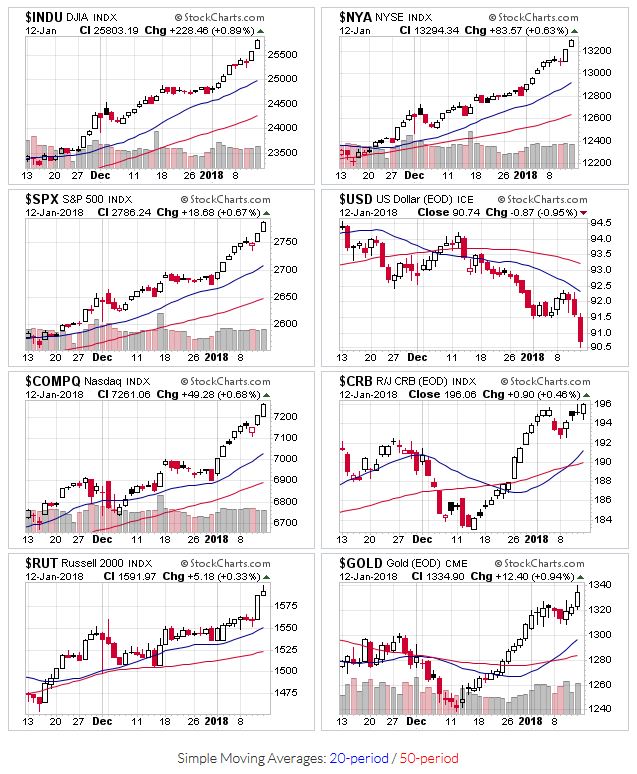
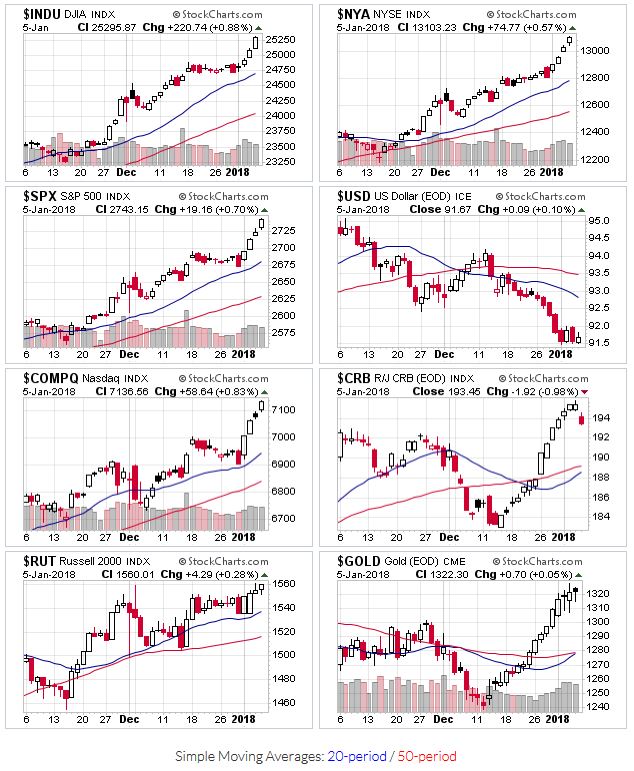
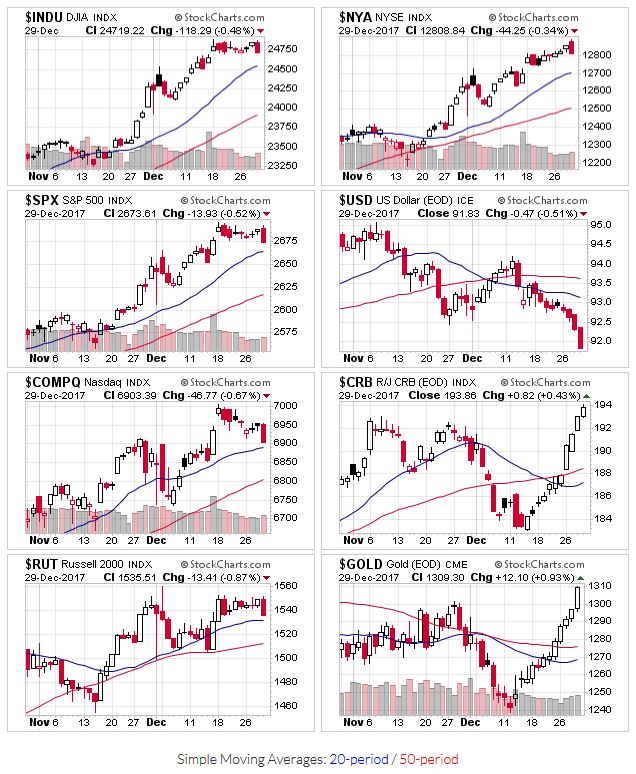
All the market indexes remain above their 20 and 50 day moving averages. We have to go all the way back to late August to see the last time the S&P500 was near its 50-day moving average! Now that’s a rally.
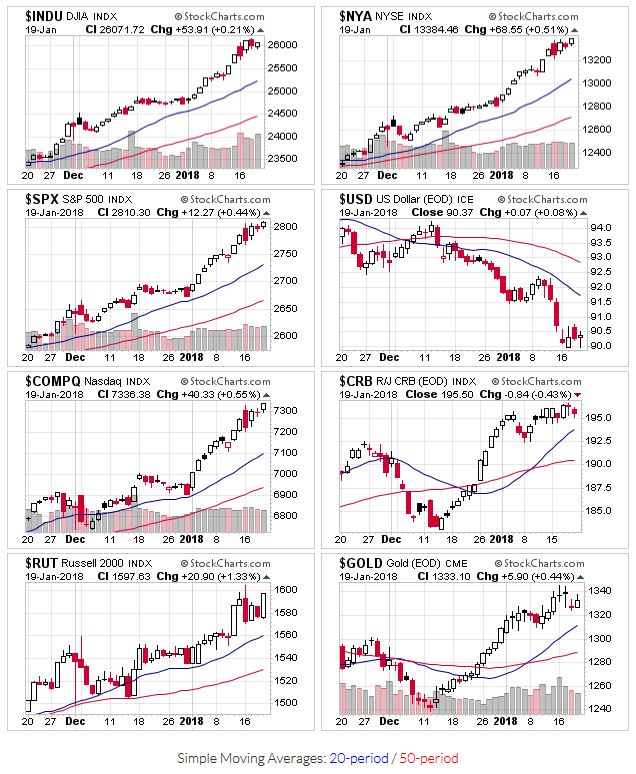
2018-01-21 – US Stock Market Averages
Price and volume action remains positive, though few of the recent breakouts had the trading volume needed to instill confidence. Unfortunately, that’s usually the case with later stage bases. All the more reason to make sure you use well defined sell rules.
Back in 2016, Tony’s target for this uptrend (using the S&P500) was 3,000 to 3,600. At that time, the S&P was trading around 2,100. I was skeptical…that was a ~50% move to the upside, and I was expecting a major correction. Now that we’re less than 10% from the lower end of that target, it’s looking like one hell of a call!
But that’s why I use an investing process and money management. In this case, I made money even though I was wrong!
If you find this research helpful, please tell a friend. If you don’t find it helpful, tell an enemy. I share articles and other news of interest via Twitter; you can follow me @investsafely. The weekly market outlook is also posted on Facebook and Linkedin.
You can check out how well (or poorly) the outlook has tracked the market using past performance estimates:
For the detailed Elliott Wave Analysis, go to the ELLIOTT WAVE lives on by Tony Caldaro. Charts provided courtesy of stockcharts.com.