I was studying some retracements and price targets today, and came across an issue with the Elliott Wave analysis I posted the over the past few weeks for the S&P500 ($SPX).
 I’ve been labeling the recent downtrend as an A-wave with 3 subwaves (a,b,c).
This was incorrect, and is sort of a mish-mash of bullish and bearish waves and labeling.
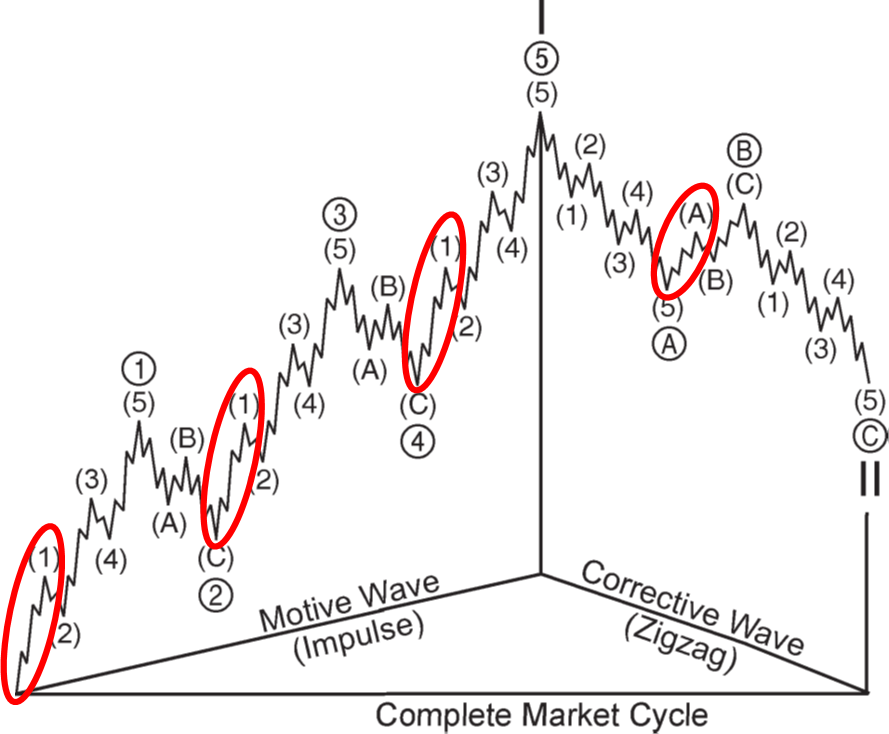
A completed zigzag pattern has 3 waves (A,B,C). A-wave’s have 5 subwaves (1,2,3,4,5). B-wave’s have 3 subwaves (a,b,c).
If there were only 3 waves, then the recent downtrend completed all three waves (ABC), and the March low is the end of the C-Wave. This also means that we’re on the left side of the graph, we’re somewhere in the first wave of a new uptrend, on our way to new highs.
 If the recent downtrend was an A-Wave of a broader correction, then there must be 5 subwaves (1,2,3,4,5). This also means we’re still on the right side of the graph, we’re somewhere in the B-wave, on our way to a near-term high before heading to new lows.
The reason for my error is two-fold: I’m still learning Elliott Wave (I don’t know what I don’t know) and most of the counts I referenced still put us in a larger bull market, so they labeled the entire downtrend ABC.
So now what? In both cases, bull or bear, we’re looking for 5 waves up from the March low.
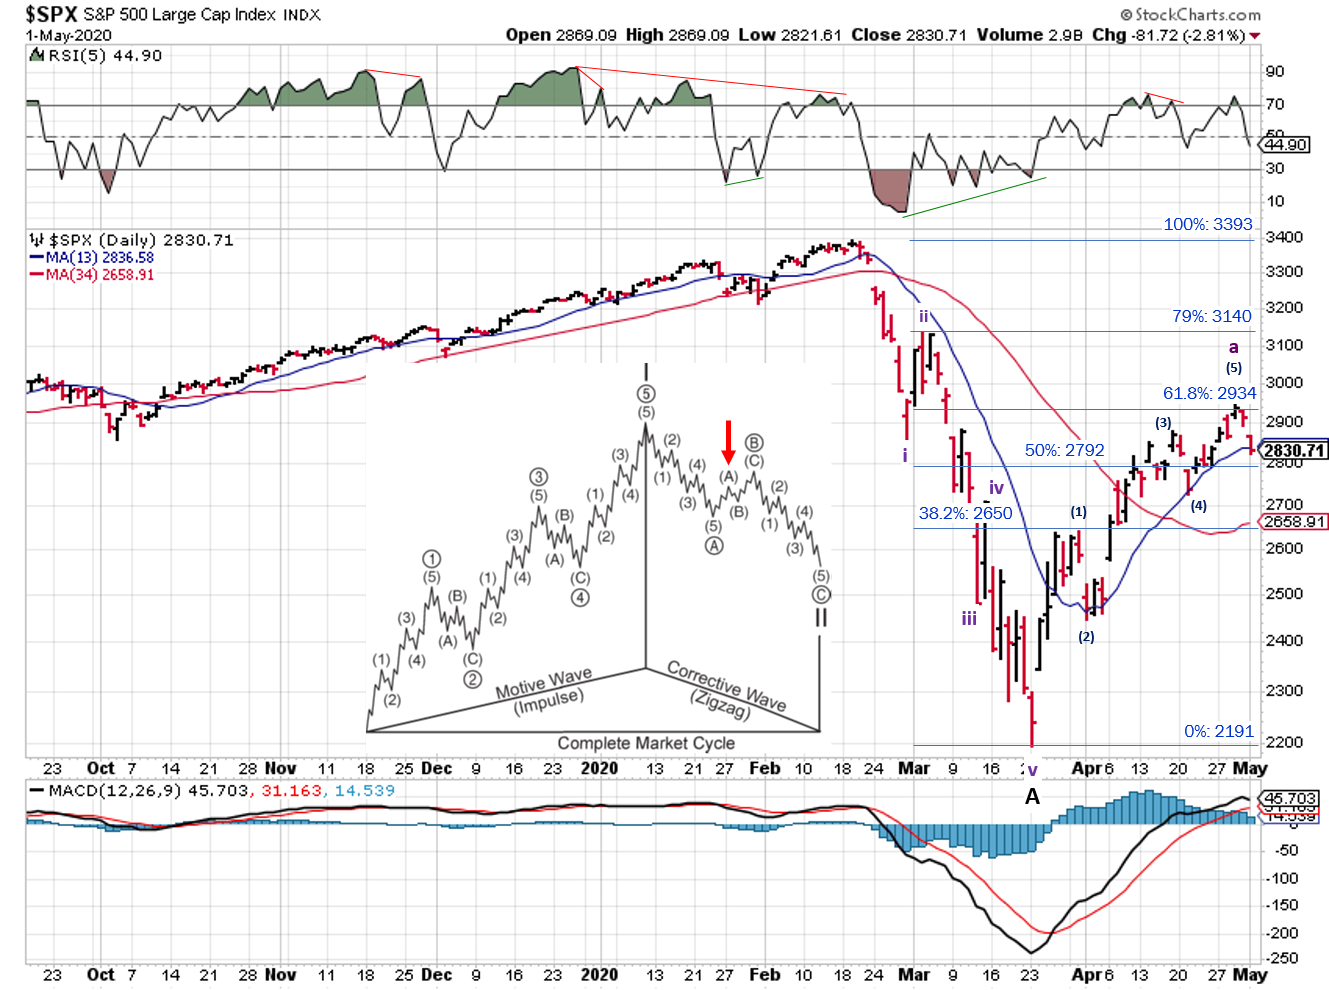
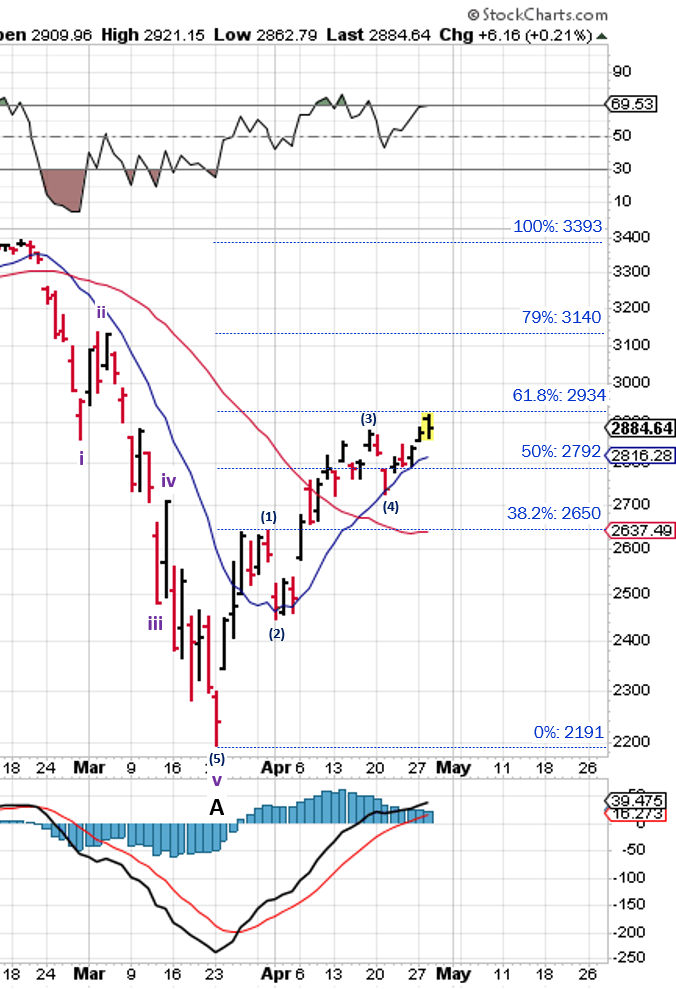
 I’m still in the bear market camp, so I relabeled the recent downtrend as an A-wave, with 5 subwaves (i,ii,iii,iv,v), as well as the first 4 subwaves ((1),(2),(3),(4)) in the current uptrend.
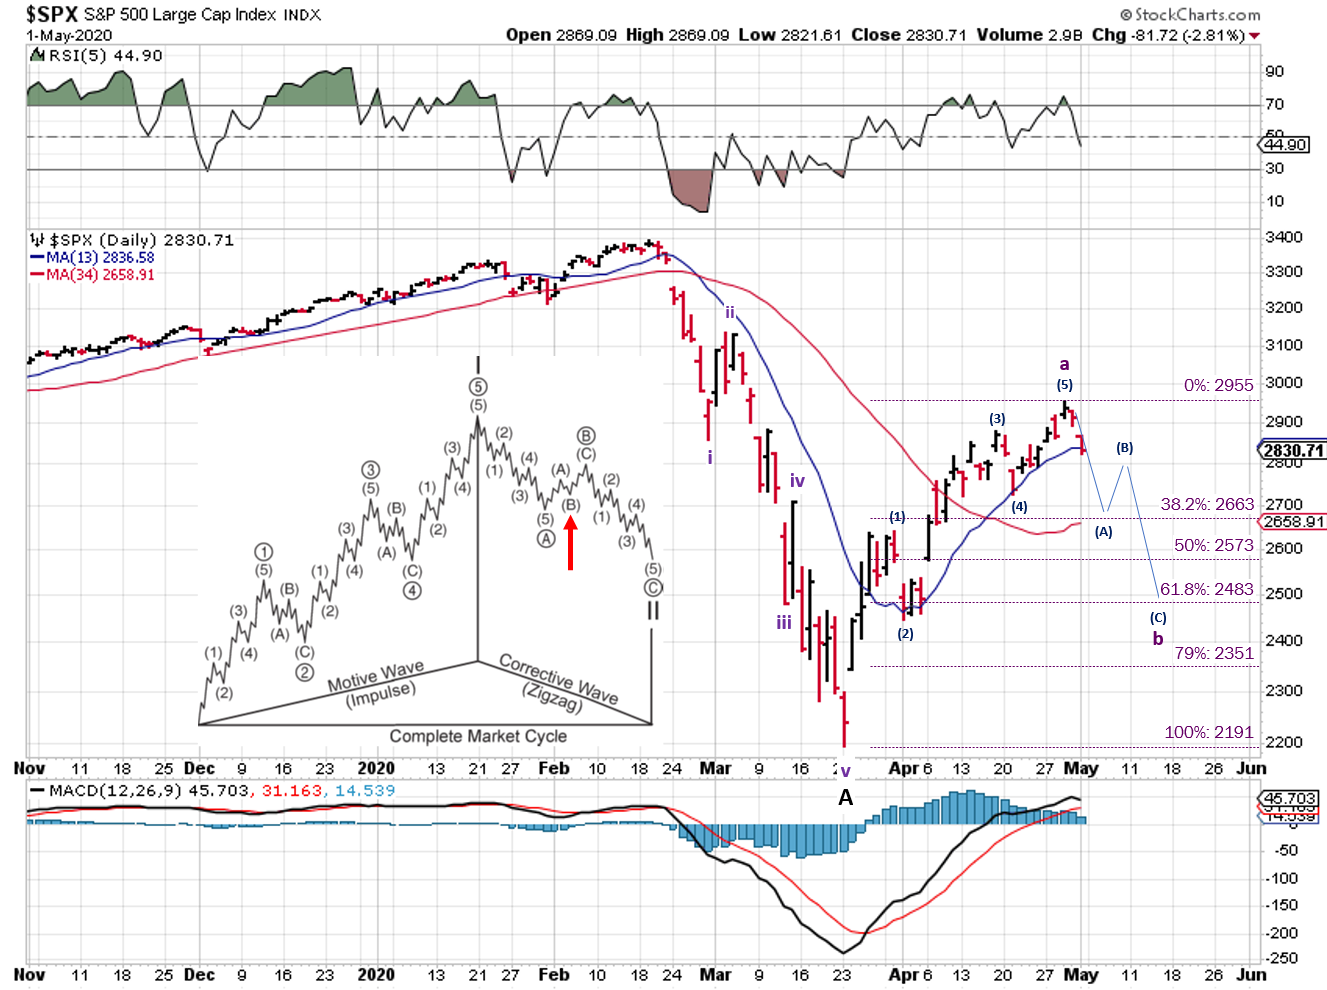
 And now that the waves and counts are fixed, we can see that we haven’t completed the a-wave of the large B-wave counterrally.
Which also means that the price targets I’ve mentioned for the past few weeks are wrong, since they were all based on the a & b waves being complete.
So now need to go back a step for potential targets.
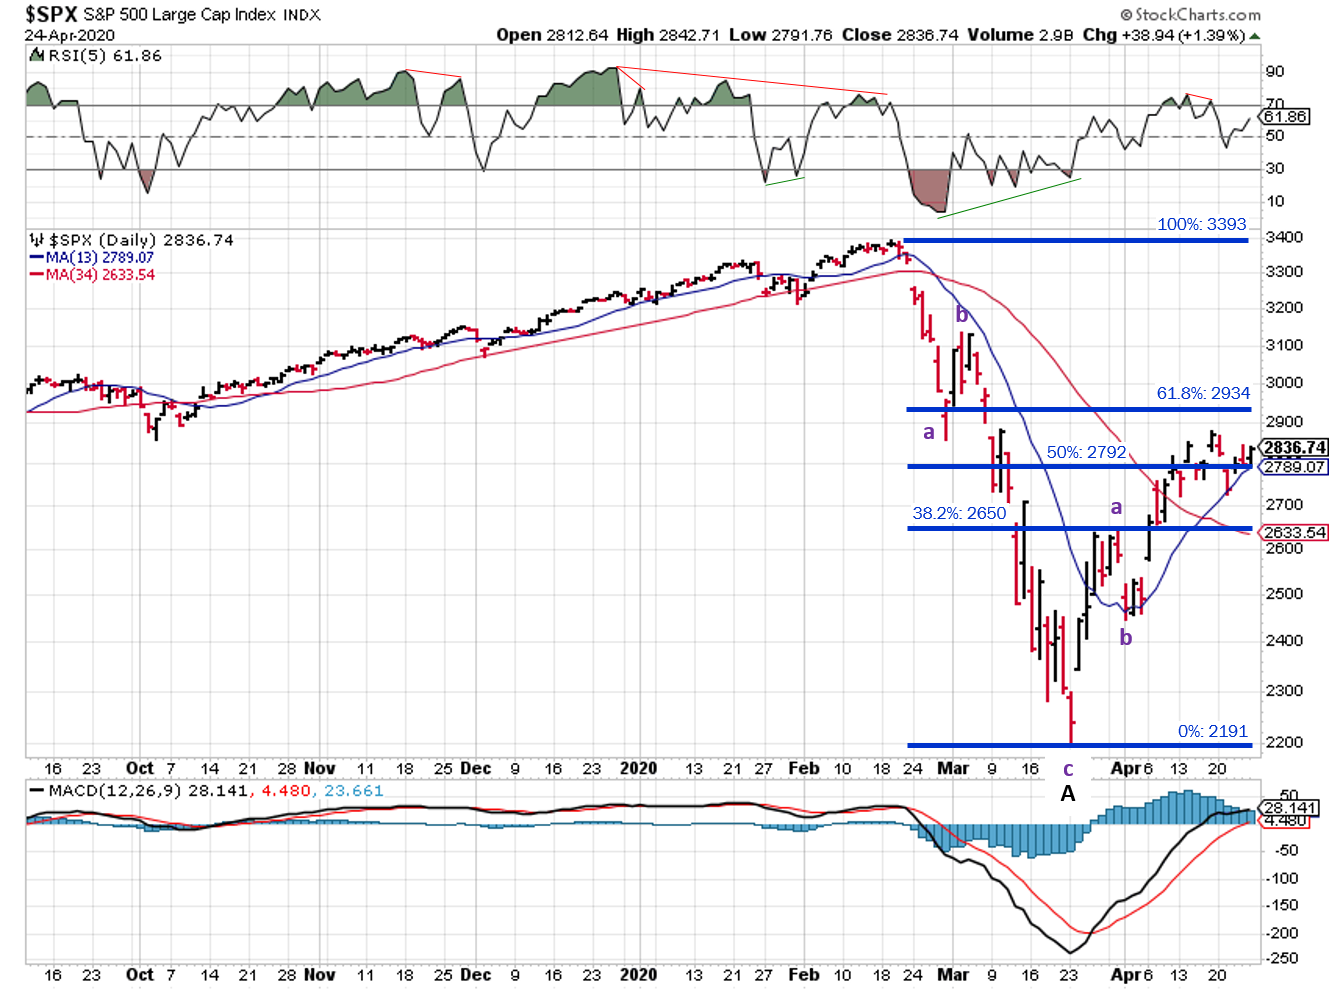
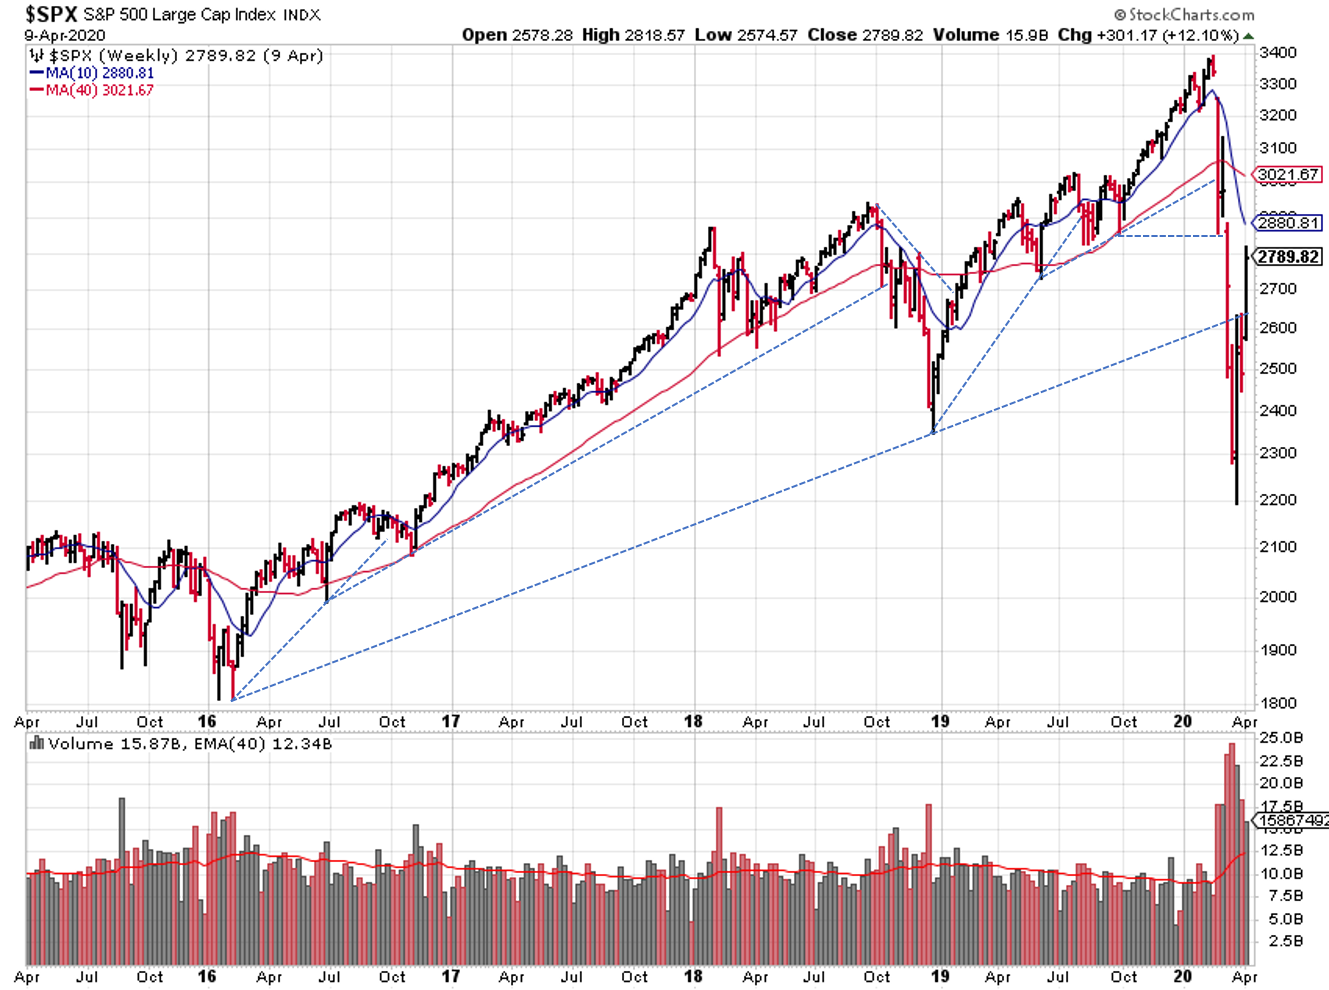
I’ve been showing the overall retracement levels of the entire downtrend (A-Wave), and those are still valid.
Typical retracements for a B-Wave are 50-79% of the A-Wave.
The A-Wave started at 3393 and ended at 2191 for a total move of 1202 points.
- 50% = 601 = 2792
- 79% = 949.5 = 3140
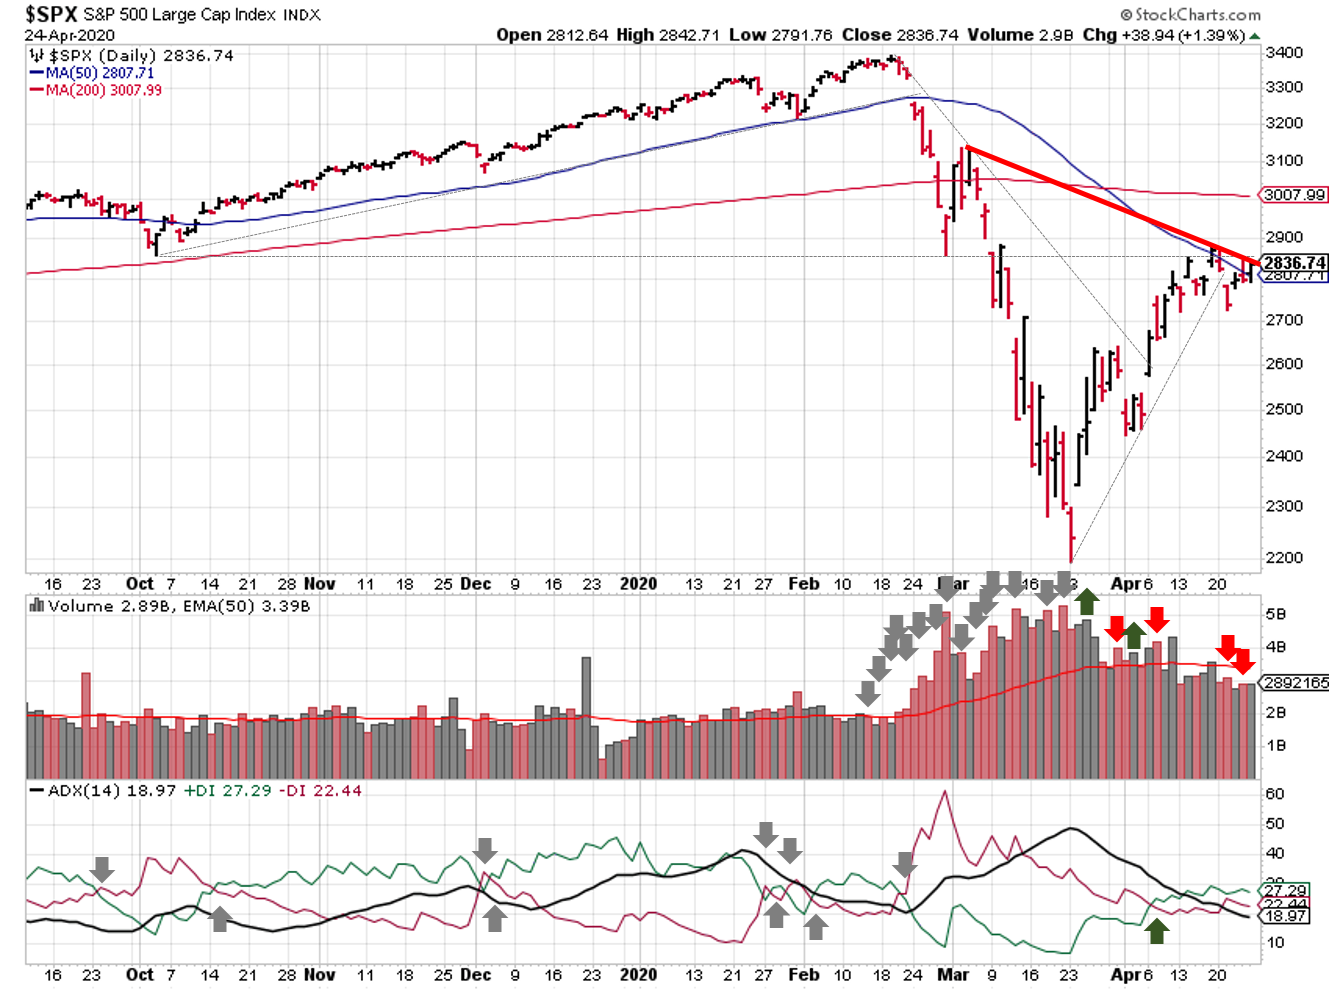
These changes also mean that the Elliott Wave signal is in an uptrend, and has been since market open on April 7. That’s the same day the ADX switched over, so no changes in when the market outlook switched from a downtrend to an uptrend…we just would have seen all three signals green on the 7th, rather than just 2 of 3.
Best to Your Week!