Stock Market Outlook entering the Week of June 14th = Uptrend
-
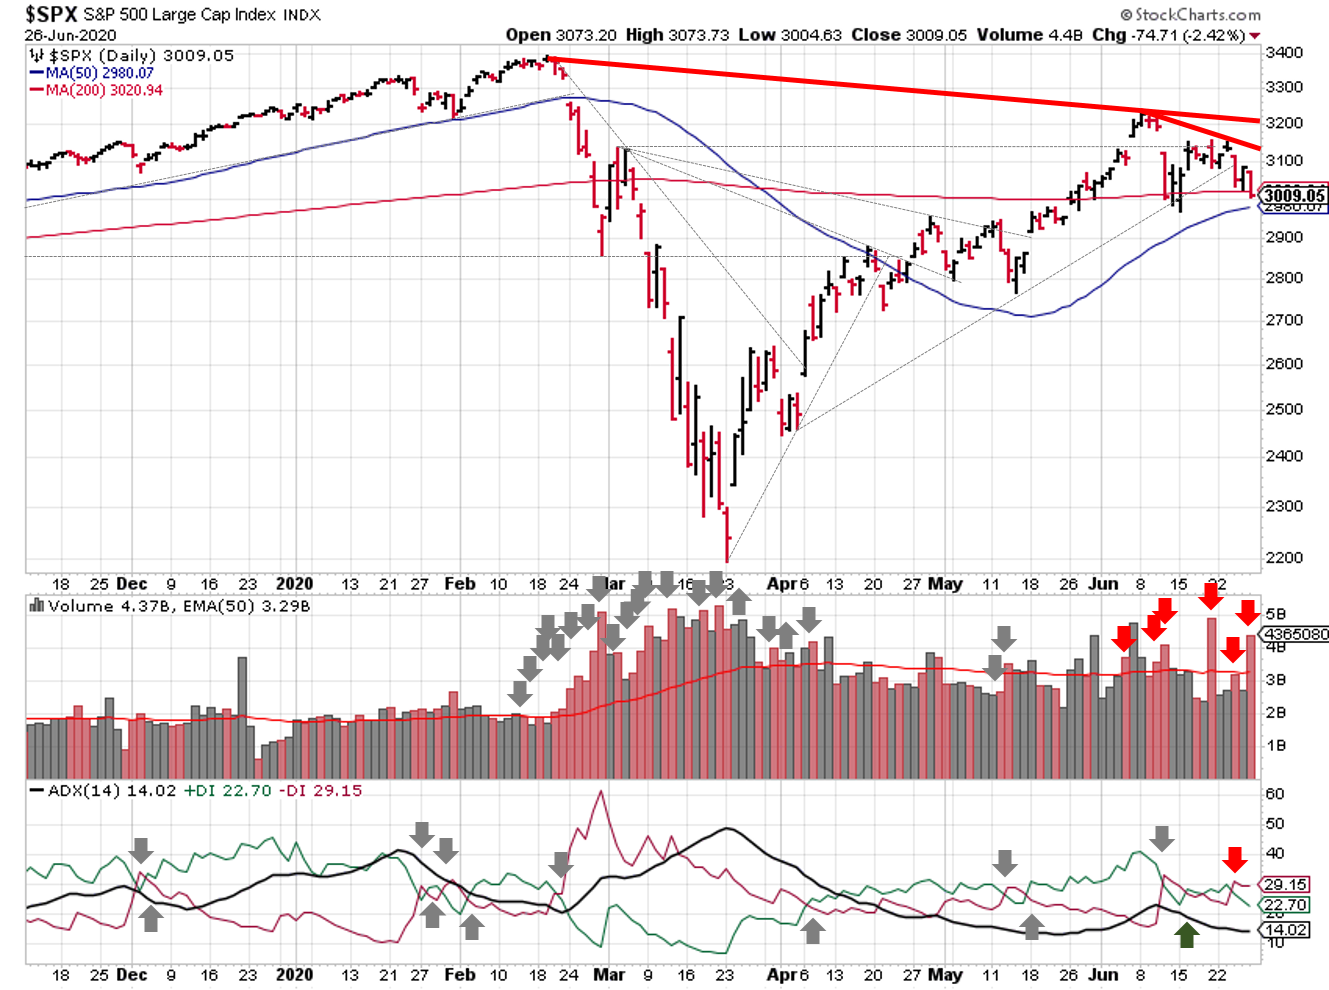
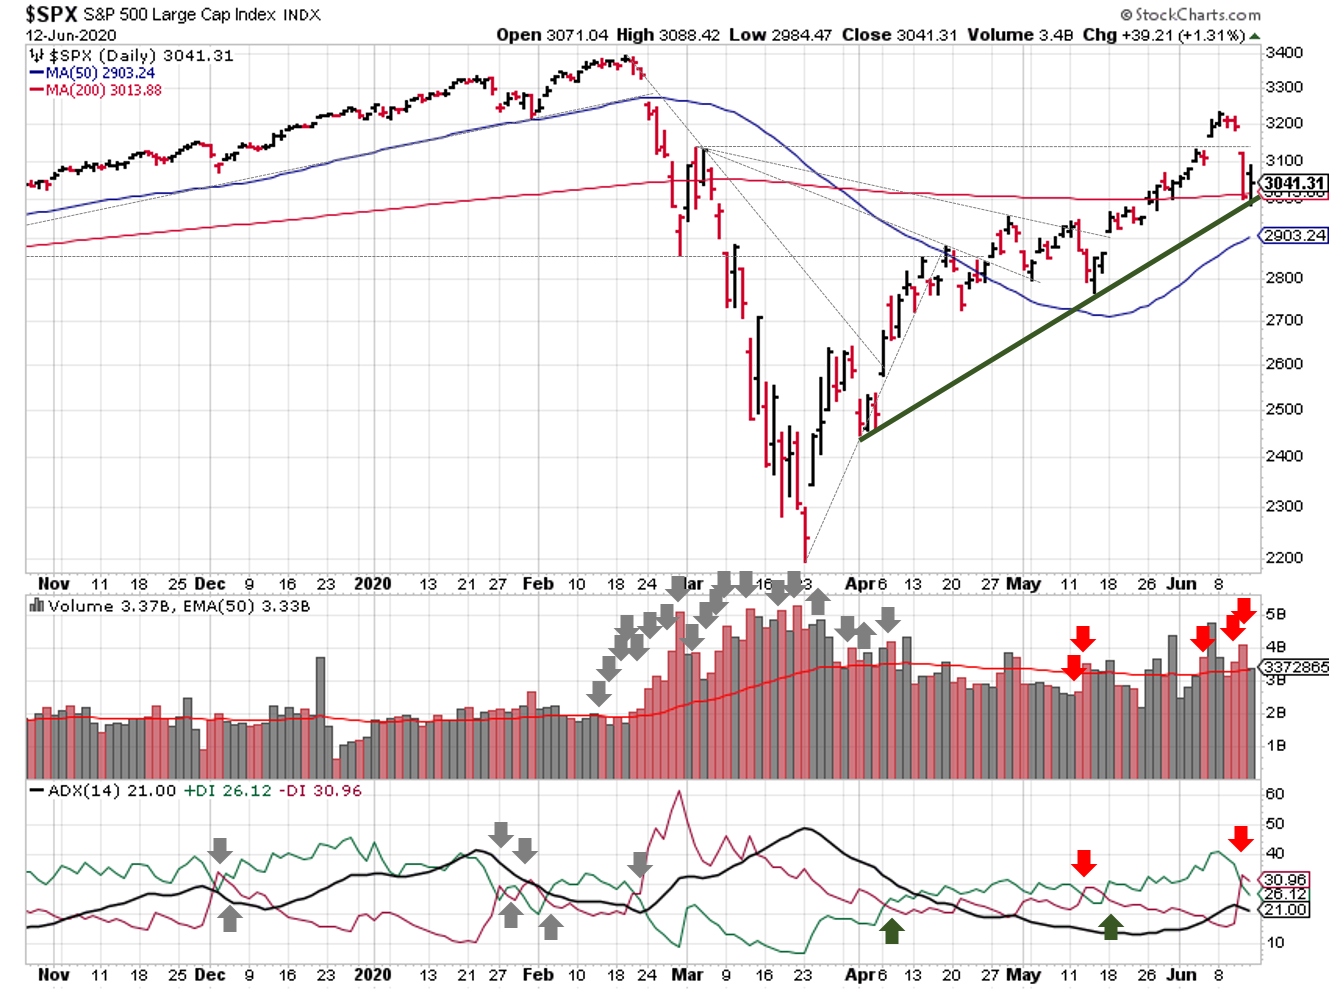
- ADX Directional Indicators: Downtrend
- Price & Volume Action: Uptrend
- Elliott Wave Analysis: Uptrend
ANALYSIS
The stock market outlook remains in an uptrend this week, but market action turned a bit bearish last week.

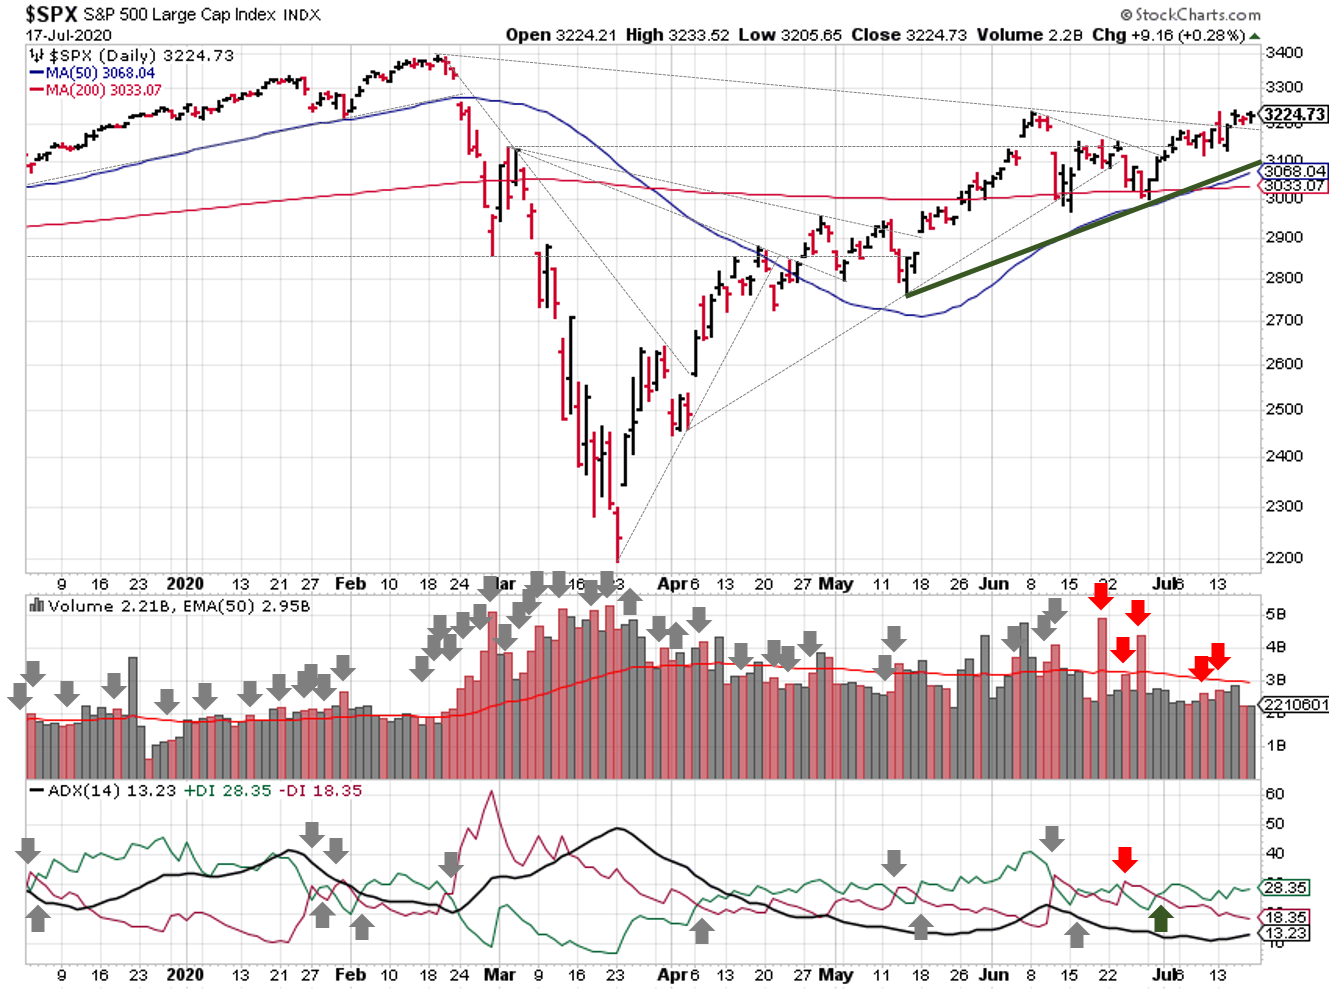
2020-06-14-SPX Trendline Analysis-Daily
A big spike in volatility last week, stocks sold off hard. The S&P500 ($SPX) found support at the 200-day moving average. And the upward trendline between the April and May lows remains intact, which is a positive sign for the uptrend.
On the downside, the ADX Directional indicators cross-over, giving us a sell signal. We also picked up 2 distribution days.

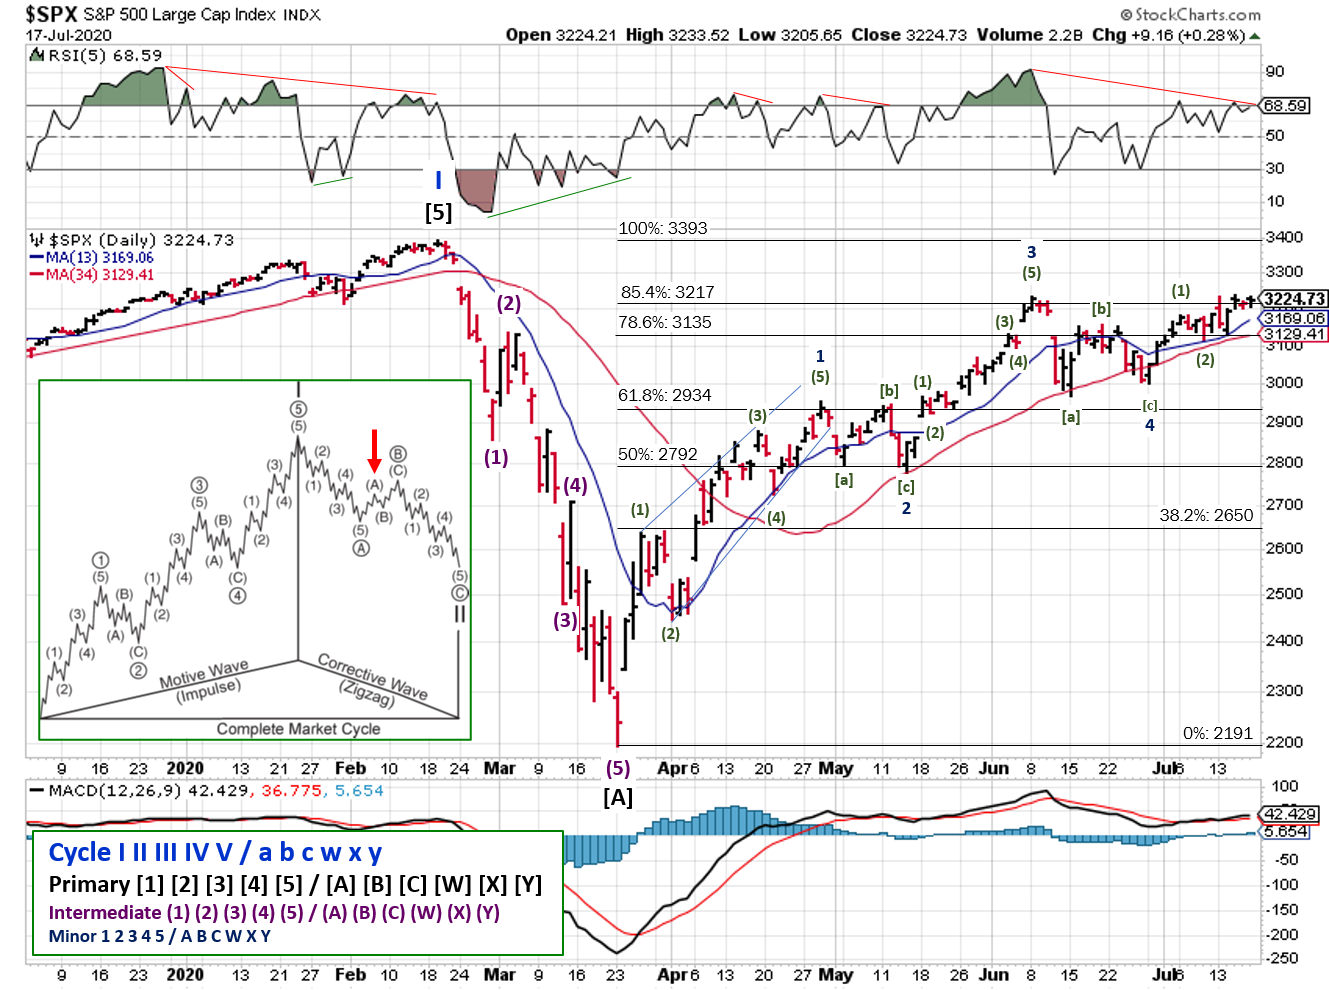
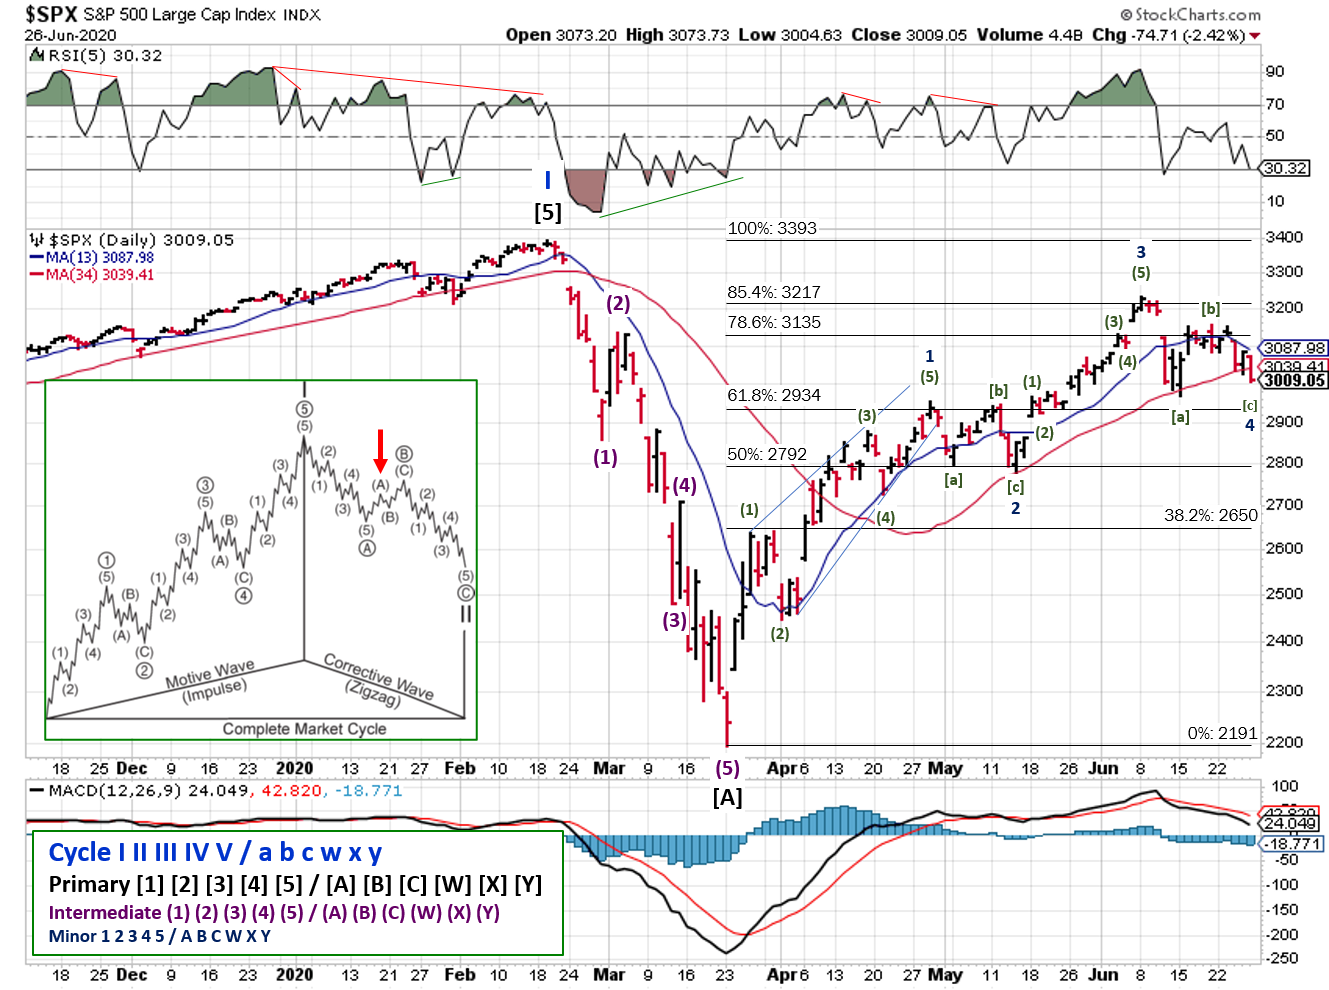
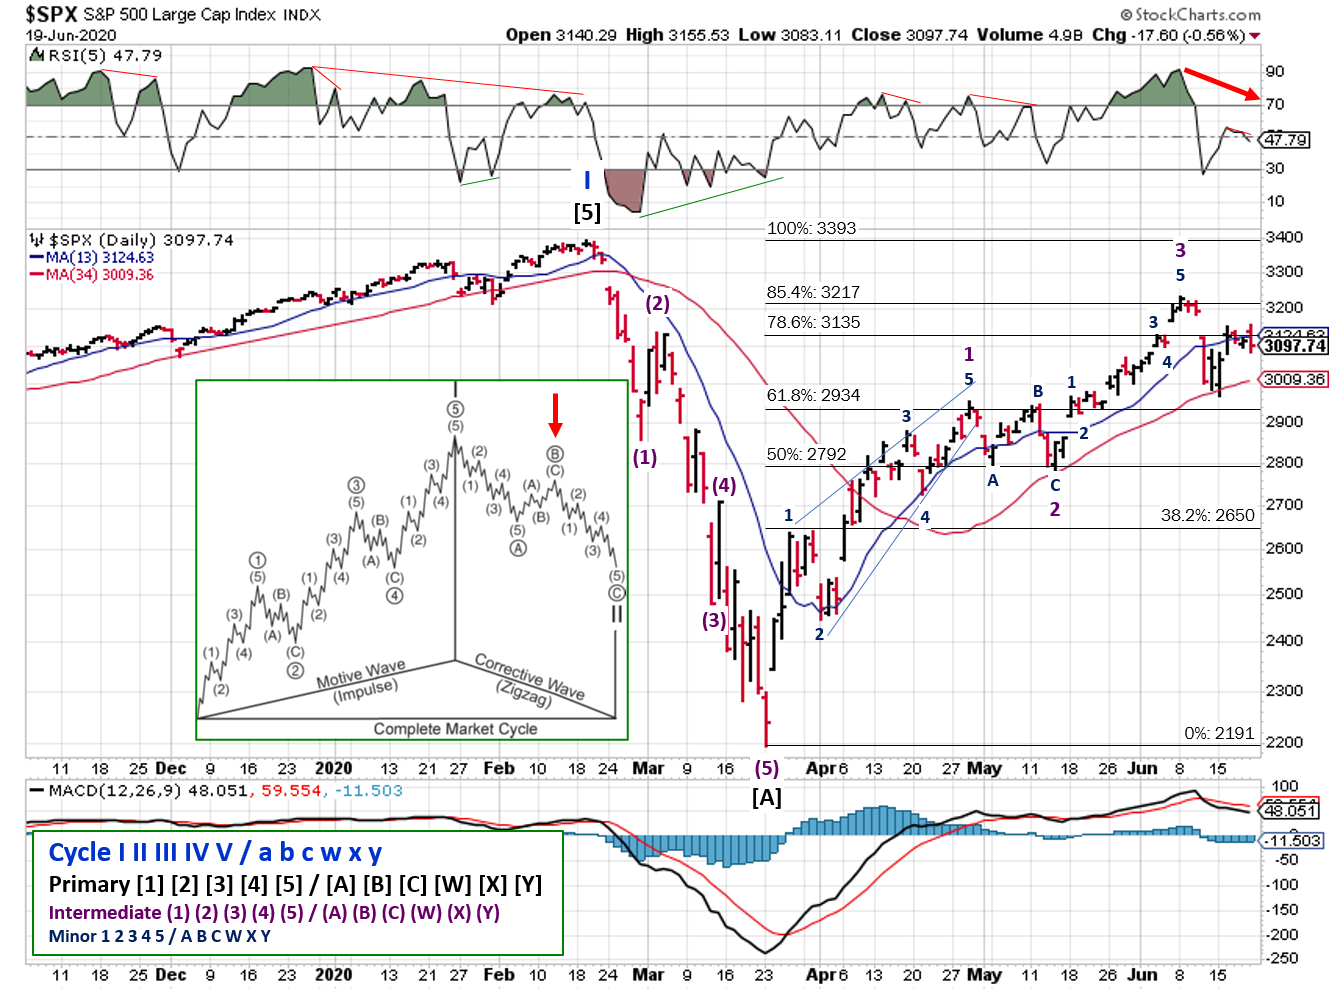
2020-06-14-SPX Elliott Wave Analysis-Daily-IntermediateA
The sell-off also changed the Elliott Wave count a bit. One issue with the counts over the past two weeks was the RSI reading. It’s really high, and didn’t show any divergence (higher high price with a lower RSI than the previous high price). Such a strong RSI is typical of a 3rd wave, not a 5th wave. So that reduces the probability of a completed a pattern. That would move us away from the possibility that the S&P completed a minor 5th wave, an intermediate C-Wave, or a Primary B-Wave.
Instead, we’re left with a higher probability that the S&P is still in an Intermediate A-wave (the 4th wave to be specific). With that count, we should see a 5th wave head back towards the June high, but with a lower RSI level, which seems likely given the current set-up.
Last week’s caveat bears repeating:
If we get back to 3393, then we’ll have to re-evaluate the Feb-Mar decline. Some are already relabeling that decline as the entire downtrend, with the bull market back in full swing.
COMMENTARY
Sorry for mentioning you should book some profits last week! We were overdue for a pullback, and the volatility shouldn’t be surprising at this point.
Hertz…what the hell is going on? The company is filing for bankruptcy. That, in and of itself, should keep 100% of investors away from the stock. If you’re a speculator or a gambler, by all means.
I heard some say that Hertz is still in business, so it’s stock will come back. Yes and no. Yes, there will likely be stock in a company called Hertz after the bankruptcy. No, the shares on the market now are not shares in the new company, and there will not be any type of “conversion” or swap.
Remember what a stock represents: equity. You’re buying a share of the company’s financial value AFTER all debts are paid. A firm files for bankruptcy when it can’t pay it’s debts.
A similar situation occurred in 2008 when GM filed for bankruptcy. People piled into their “old” shares, thinking they would get cheap shares of the new company. Wrong. The “old” GM couldn’t creditors in full (i.e. people who hold corporate debt, bonds, etc.). Since no equity remained, the stock was worth $0.00. The old “GM” was closed down, and a new “GM” was created, with shares in the “new”company issued during an IPO.
This time is a bit different (worse actually) because Hertz has plans to hold a stock offering, in the old company, while it is filing bankruptcy! This is crazy! Even the disclosure documents say that the new stock will “ultimately be worthless.” (H/T Peter Boockvar via John Mauldin).
Trading is not investing…it’s a necessary part, but just a part. If you do decide to speculate, position sizing and stop losses are a must. Don’t let one trade wipe you out or add years to your financial goals.
Best to your week!