Weekend Stock Market Outlook

Stock Market Outlook entering the Week of September 6th = Uptrend

    • ADX Directional Indicators: Downtrend
    • Price & Volume Action: Uptrend
    • Elliott Wave Analysis: Uptrend

ANALYSIS
The stock market outlook remains in an uptrend, but last week’s sell-off did some damage, as the ADX flipped to a downtrend.

Technical analysis of daily SPX prices

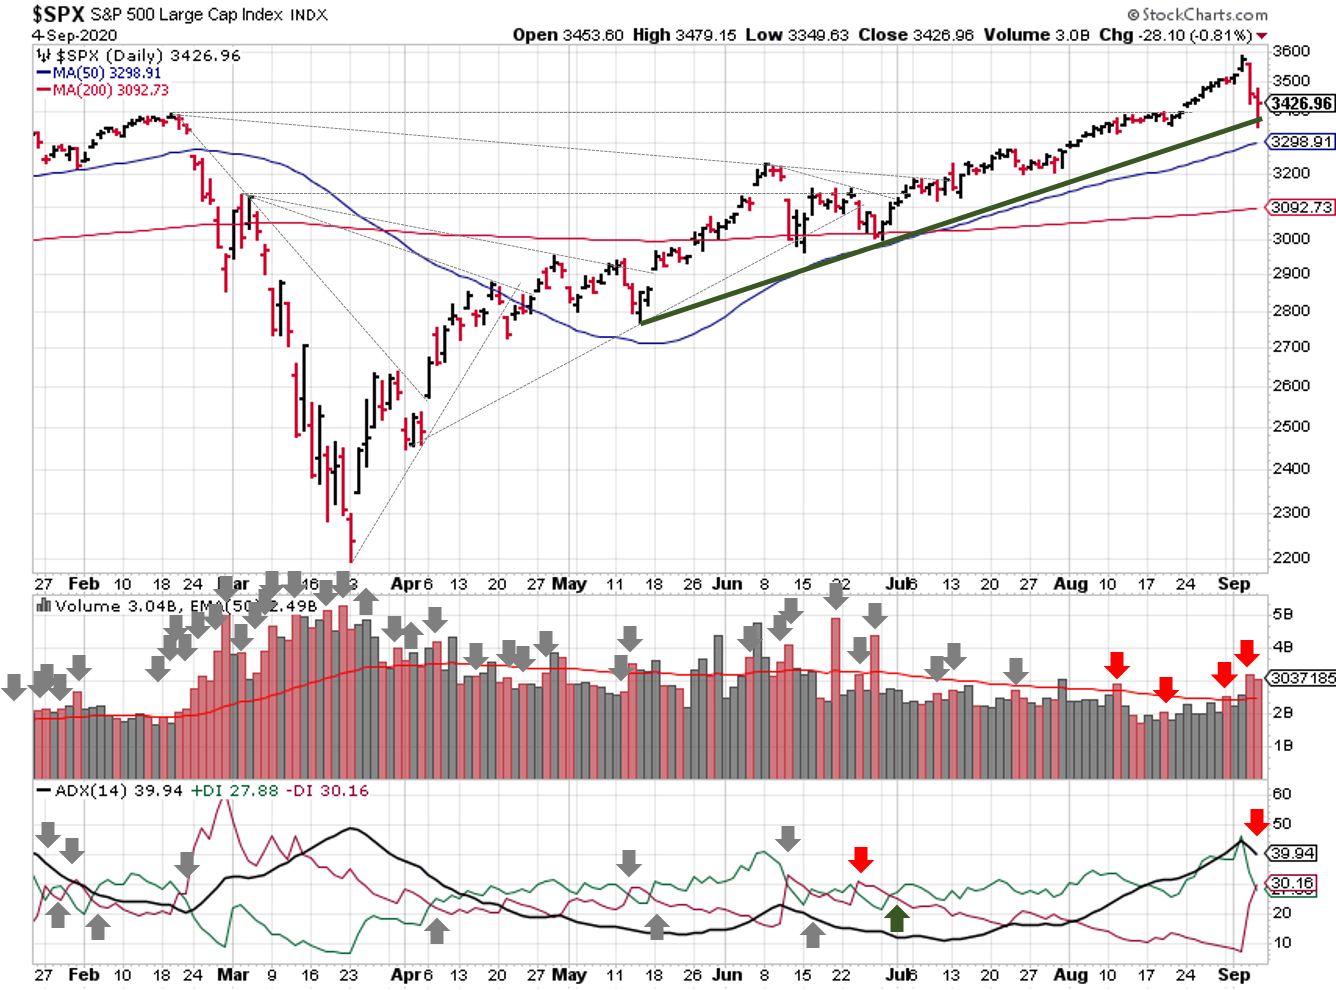
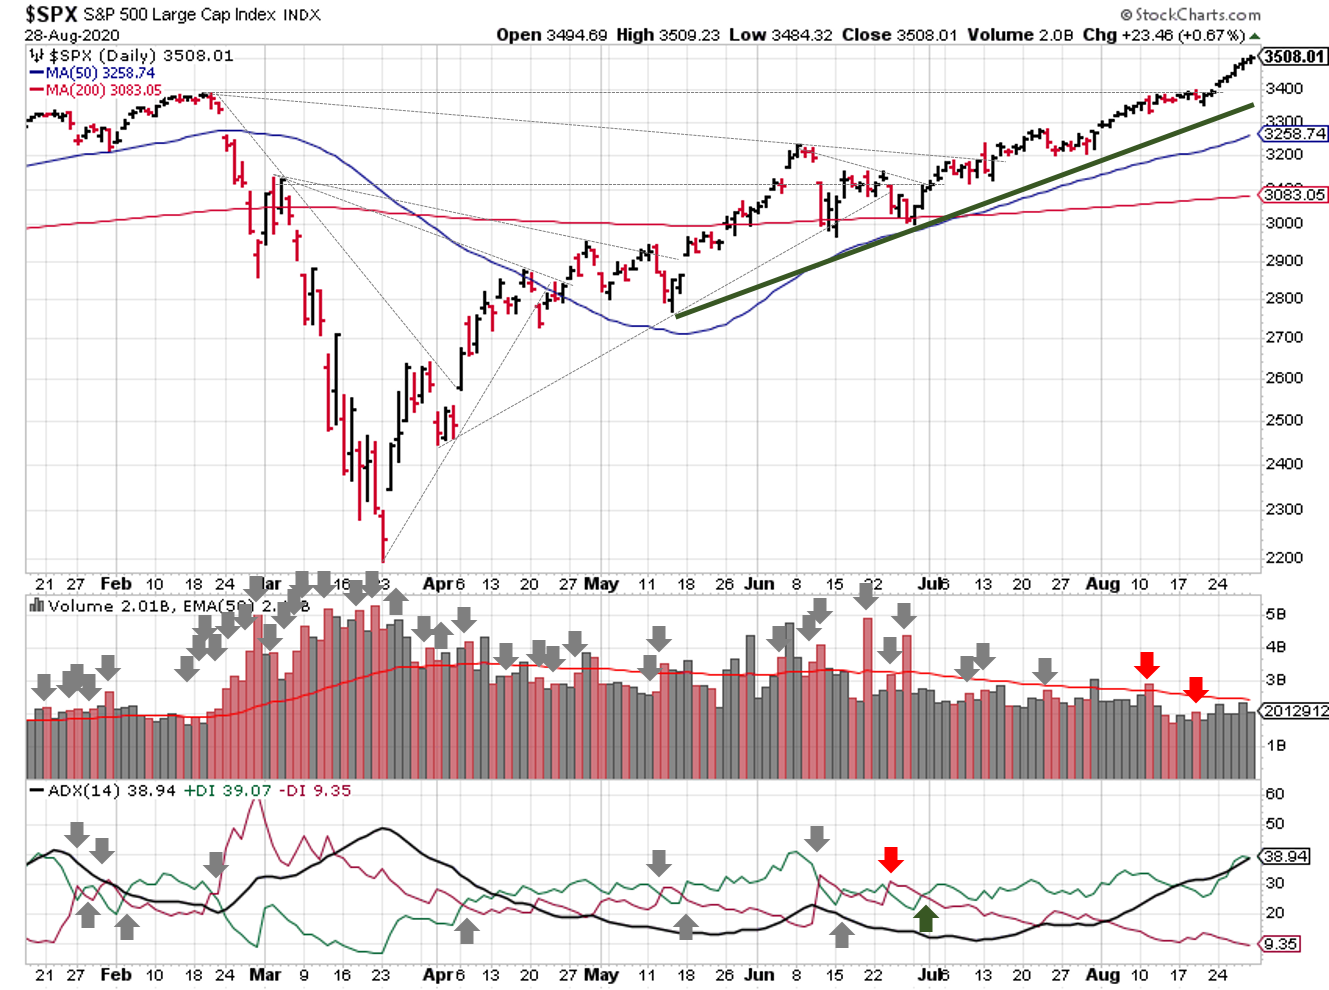
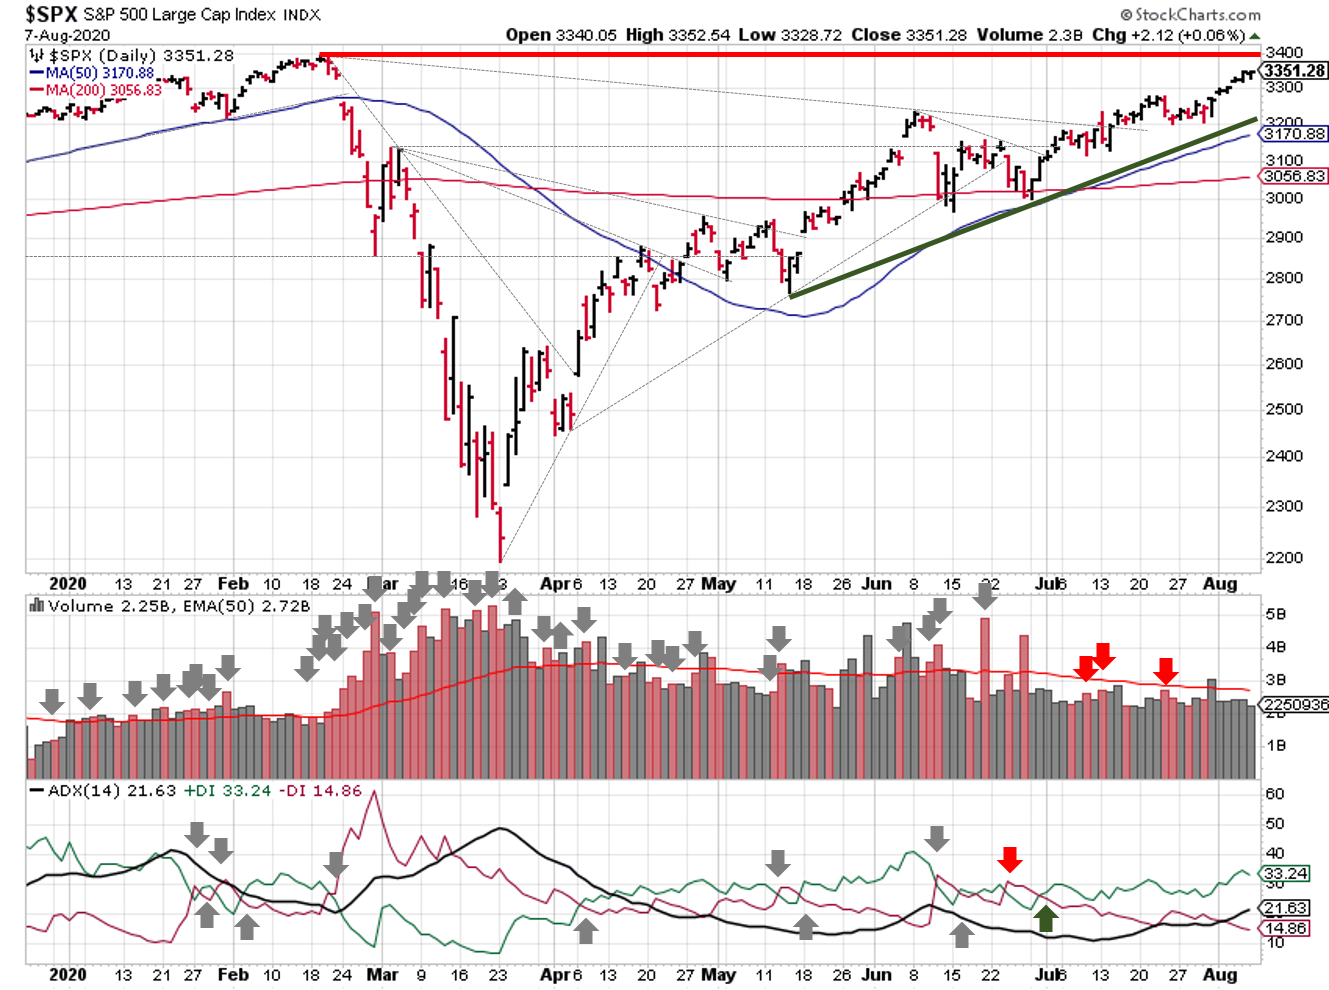
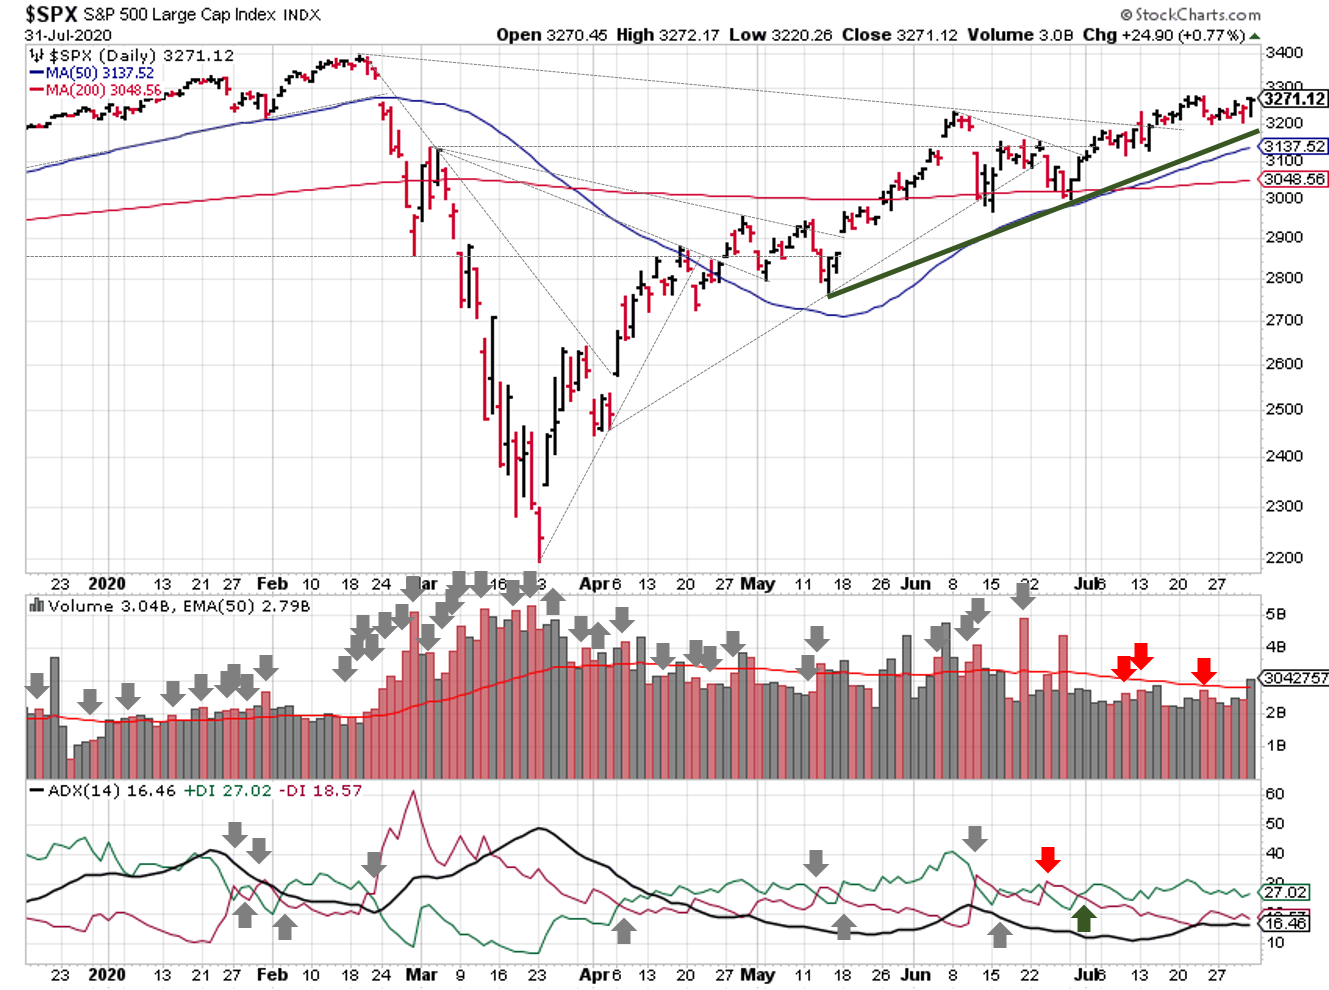
2020-09-06-SPX Trendline Analysis-Daily

The S&P500 ($SPX) sat ~14% above its 200-day moving average on Wednesday, which was finally enough to bring the sellers out.   The May to June trendline and the 34-day moving average appear to have held…at least for least week.  The average currently sits ~10% above the 200-day, so we’re still fairly extended based on historical performance.

The ADX flashed a bearish cross-over on Friday, moving this signal to a downtrend.  Price and volume action remains bullish, still showing a limited number of distribution days and remaining above the 50-day moving average.

Technical analysis of daily SPX prices

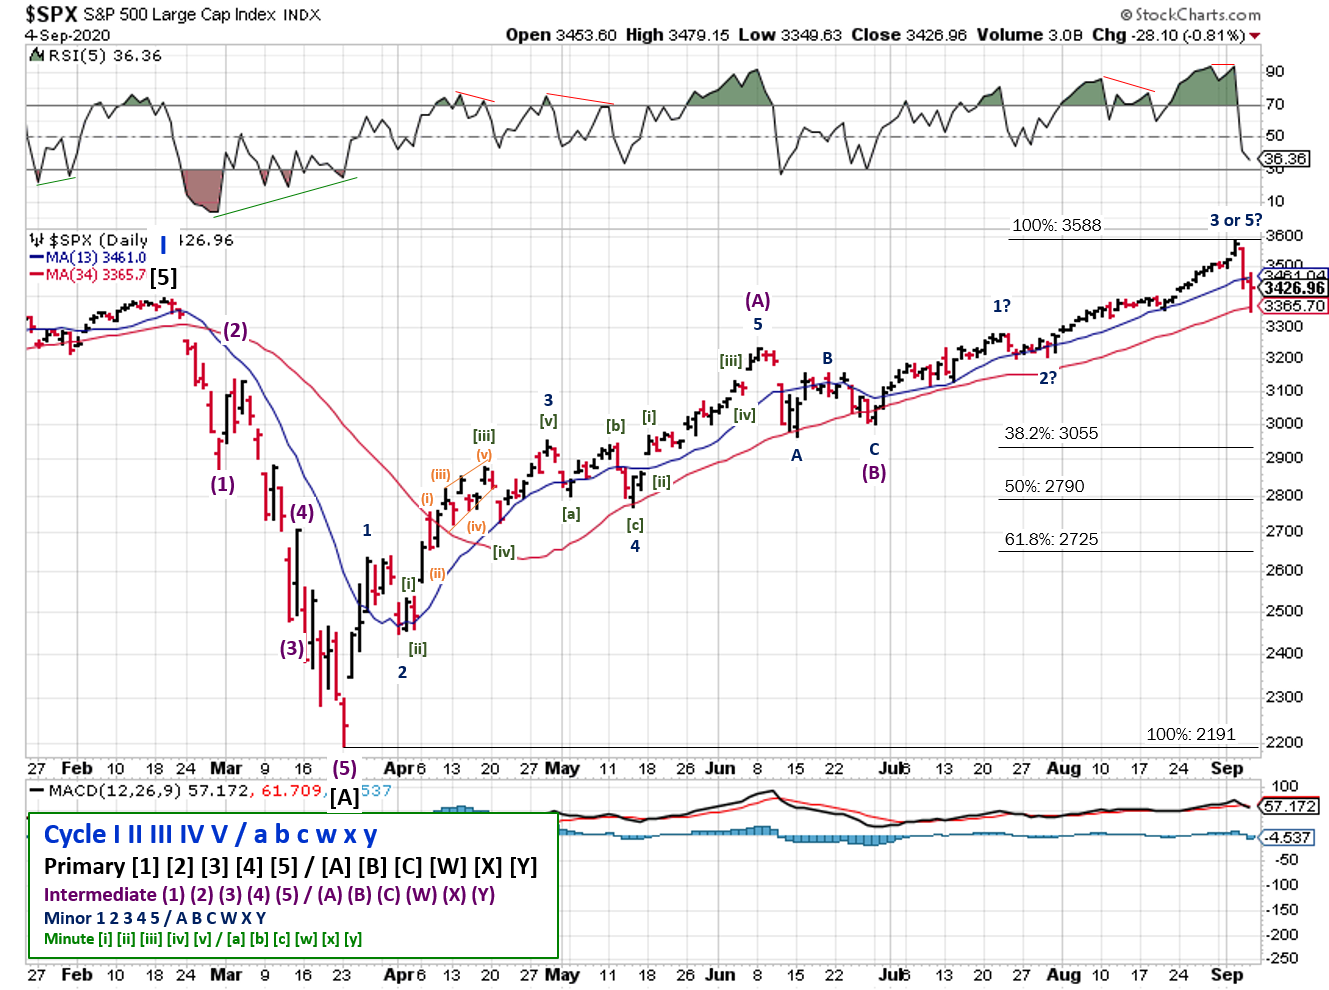
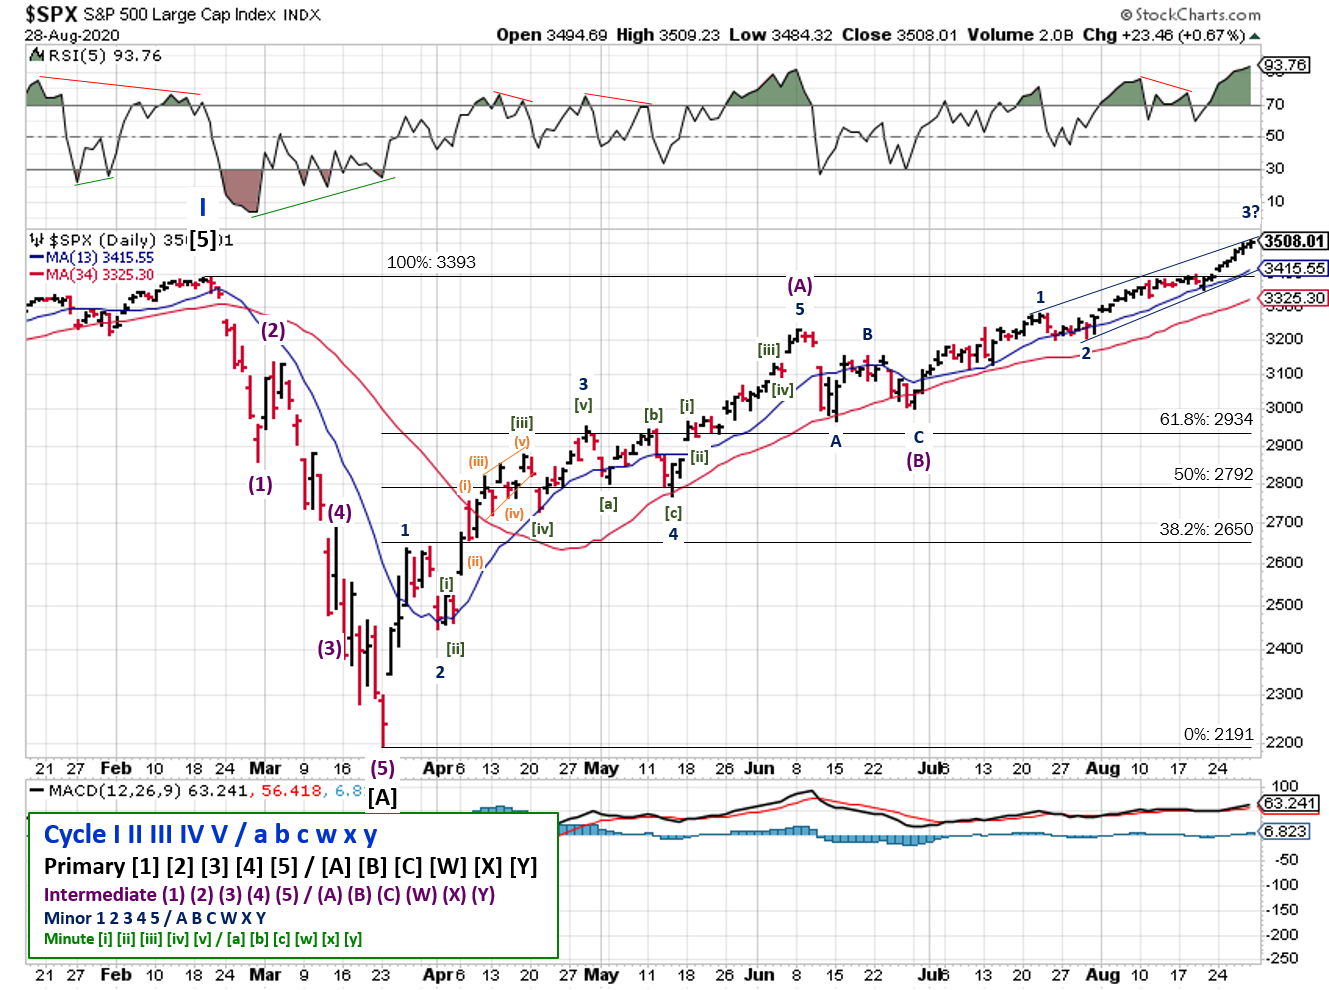
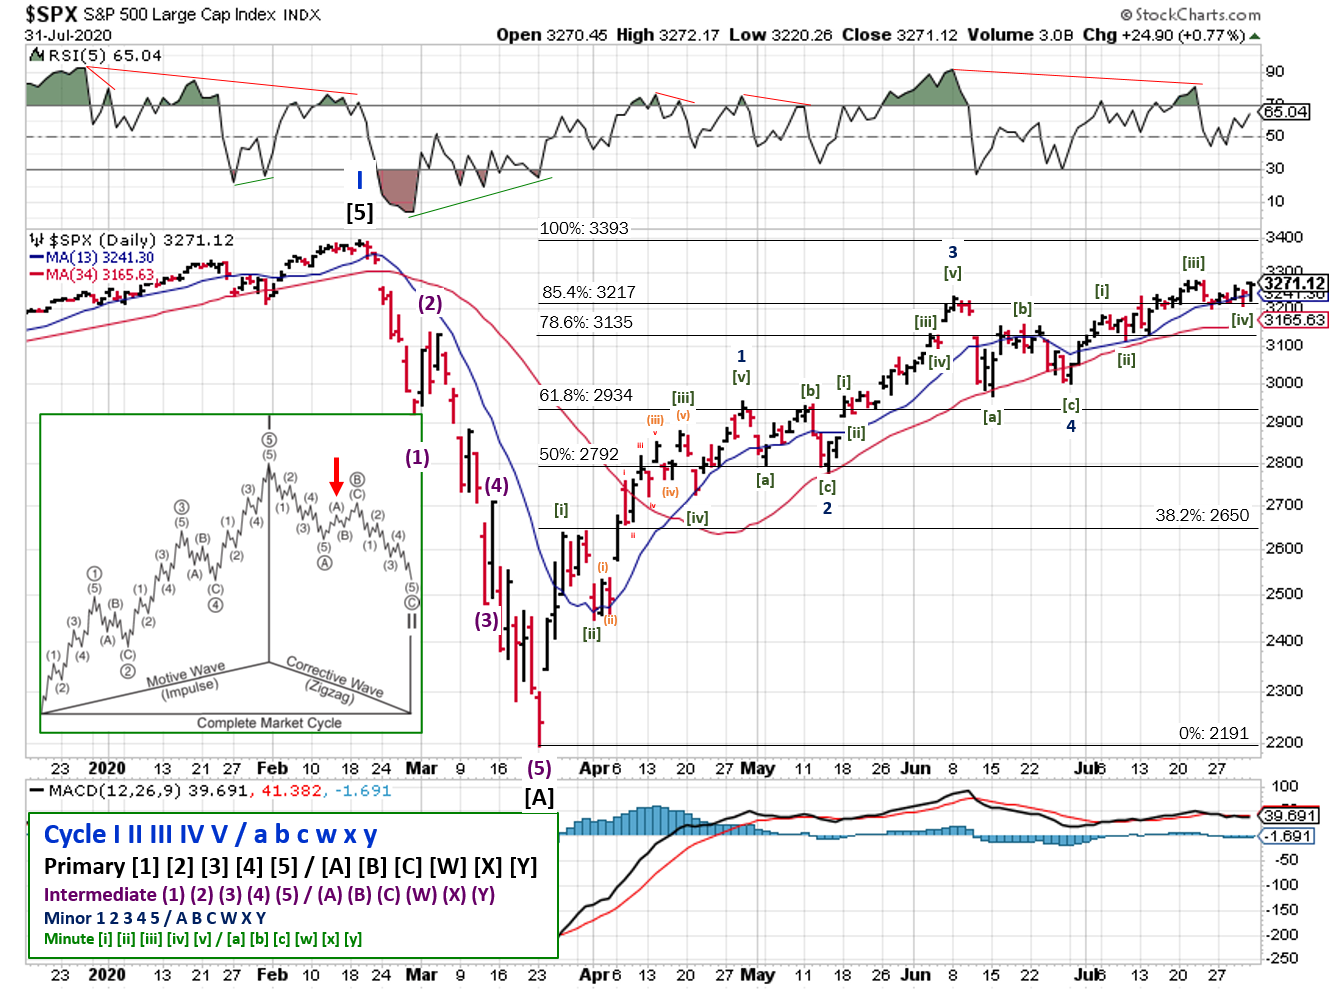
2020-09-06-SPX Elliott Wave Analysis-Daily-IntermediateC

I’m still not confident in the Elliott Wave count, but I’m expecting another run at the all time high before the rally is over.  I placed the major retracement levels for the rally in the chart above, just in case the 5-wave is now complete (as I had been labeling this run-up previously).

If it was a 3 that just ended, then the sell-off should find additional support near 3279 (the end of the first wave in the summer uptrend and the 50-day moving average).  Otherwise, the 200-day moving average is in play, as well as the 38.2% retracement level.

Technical analysis of weekly SPX prices

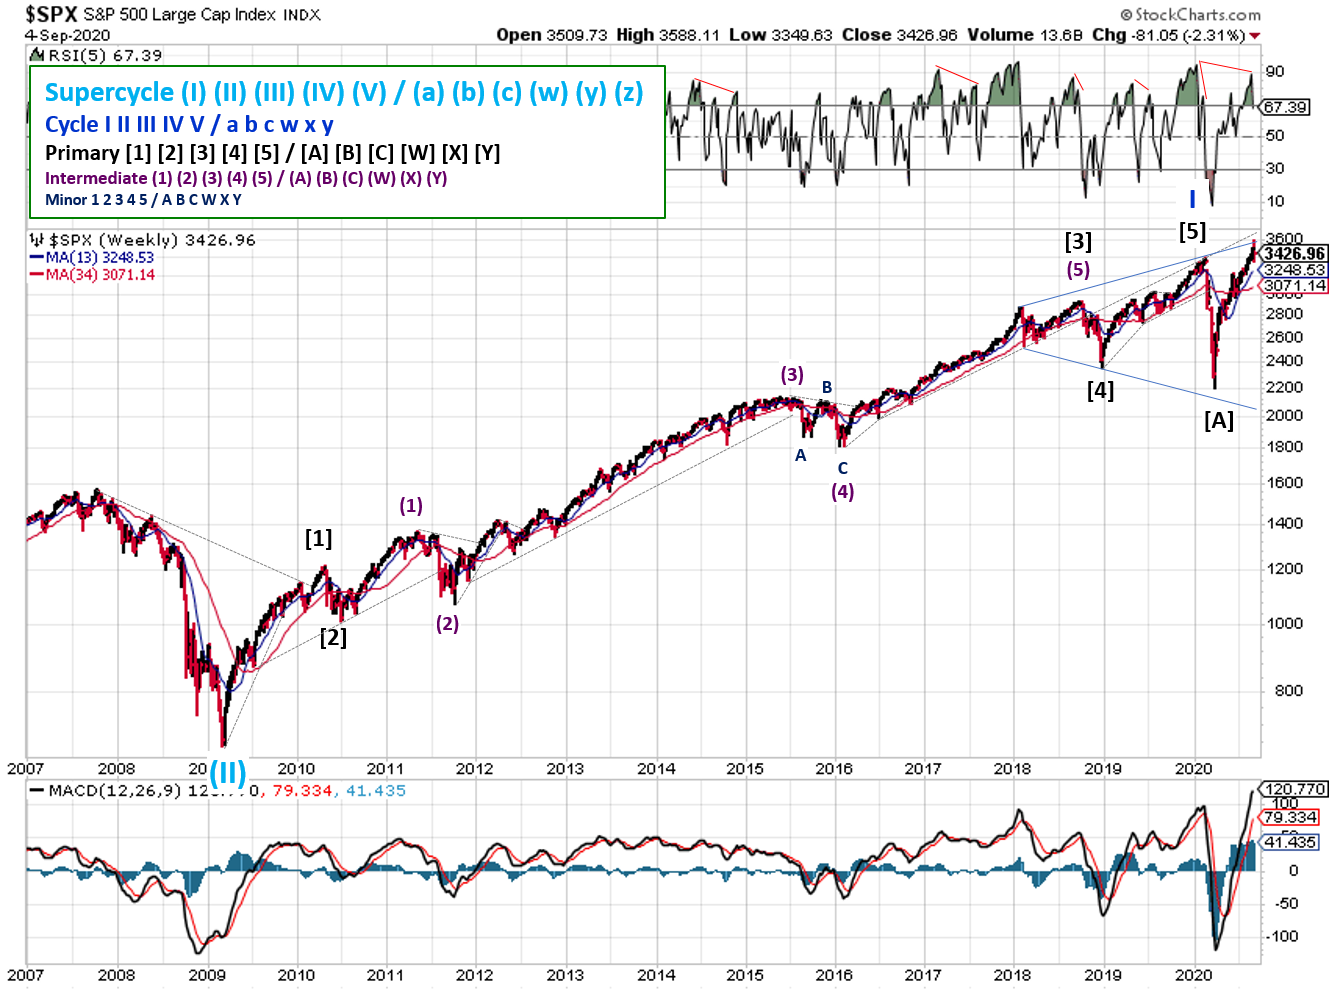
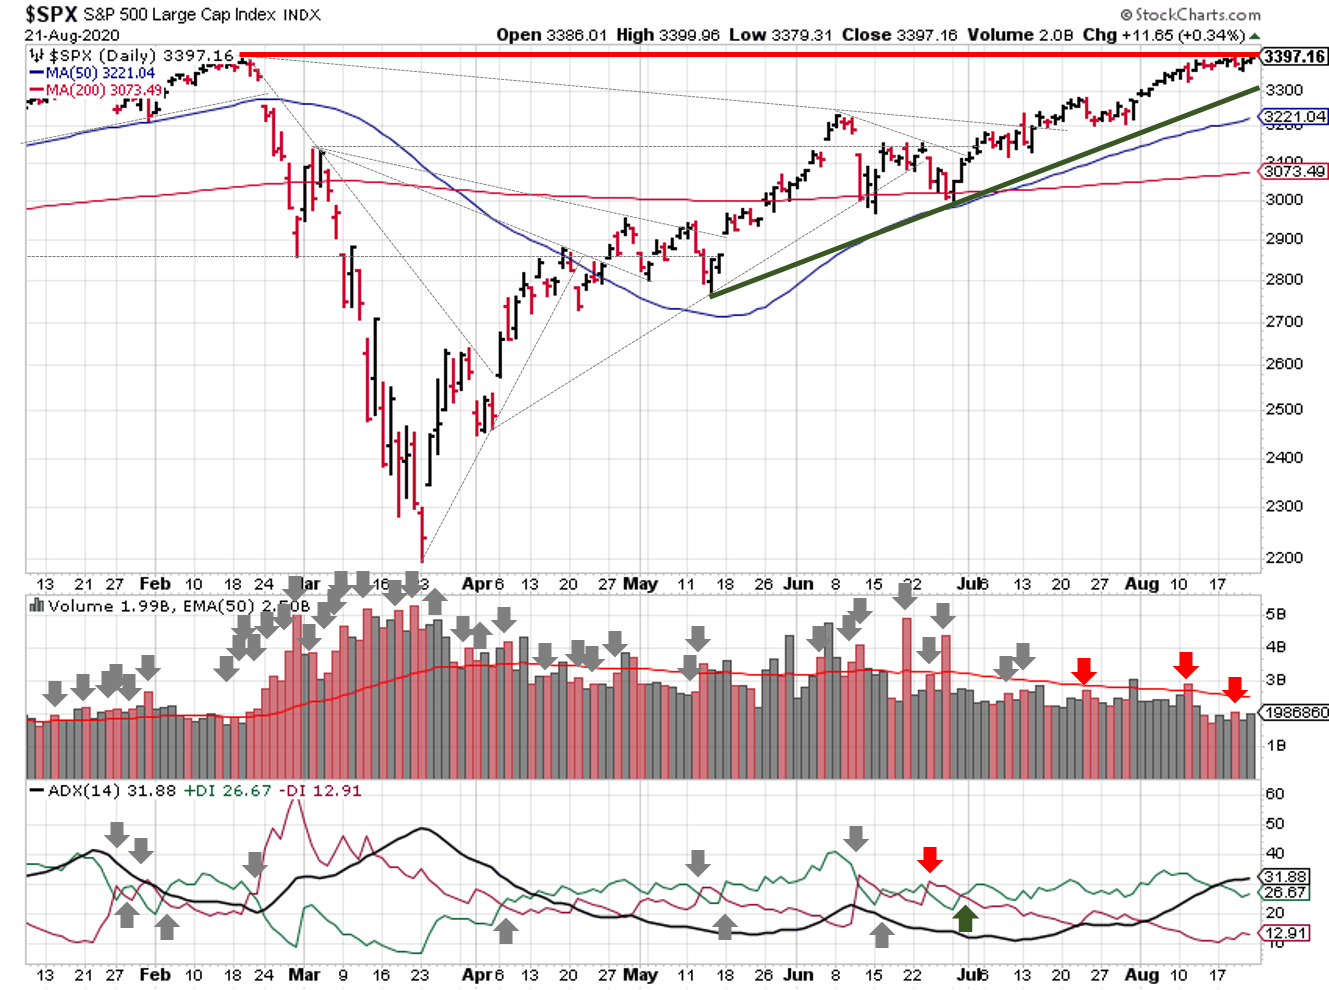
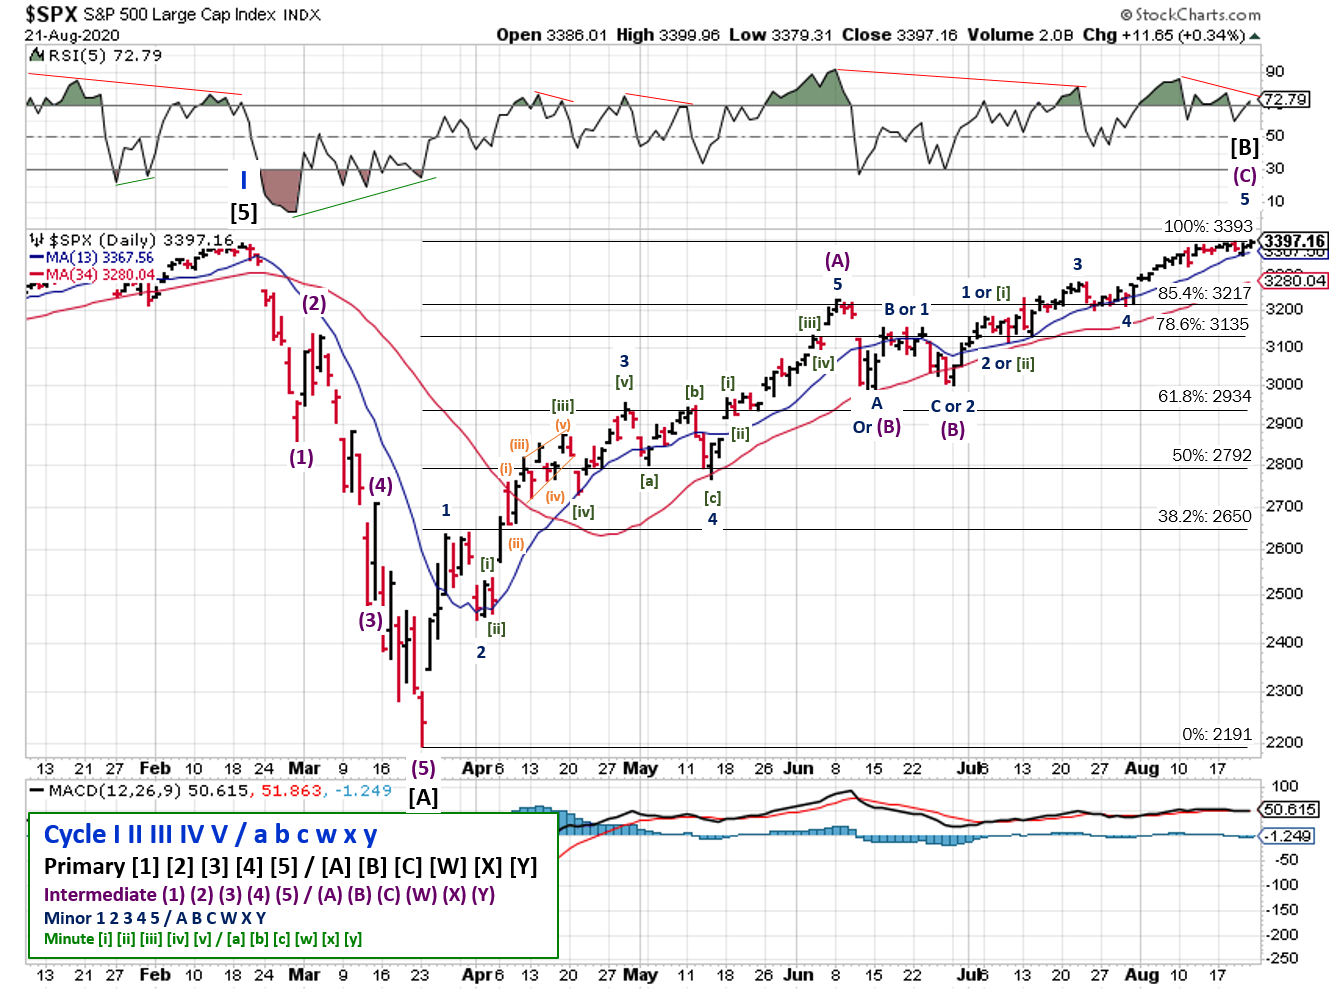
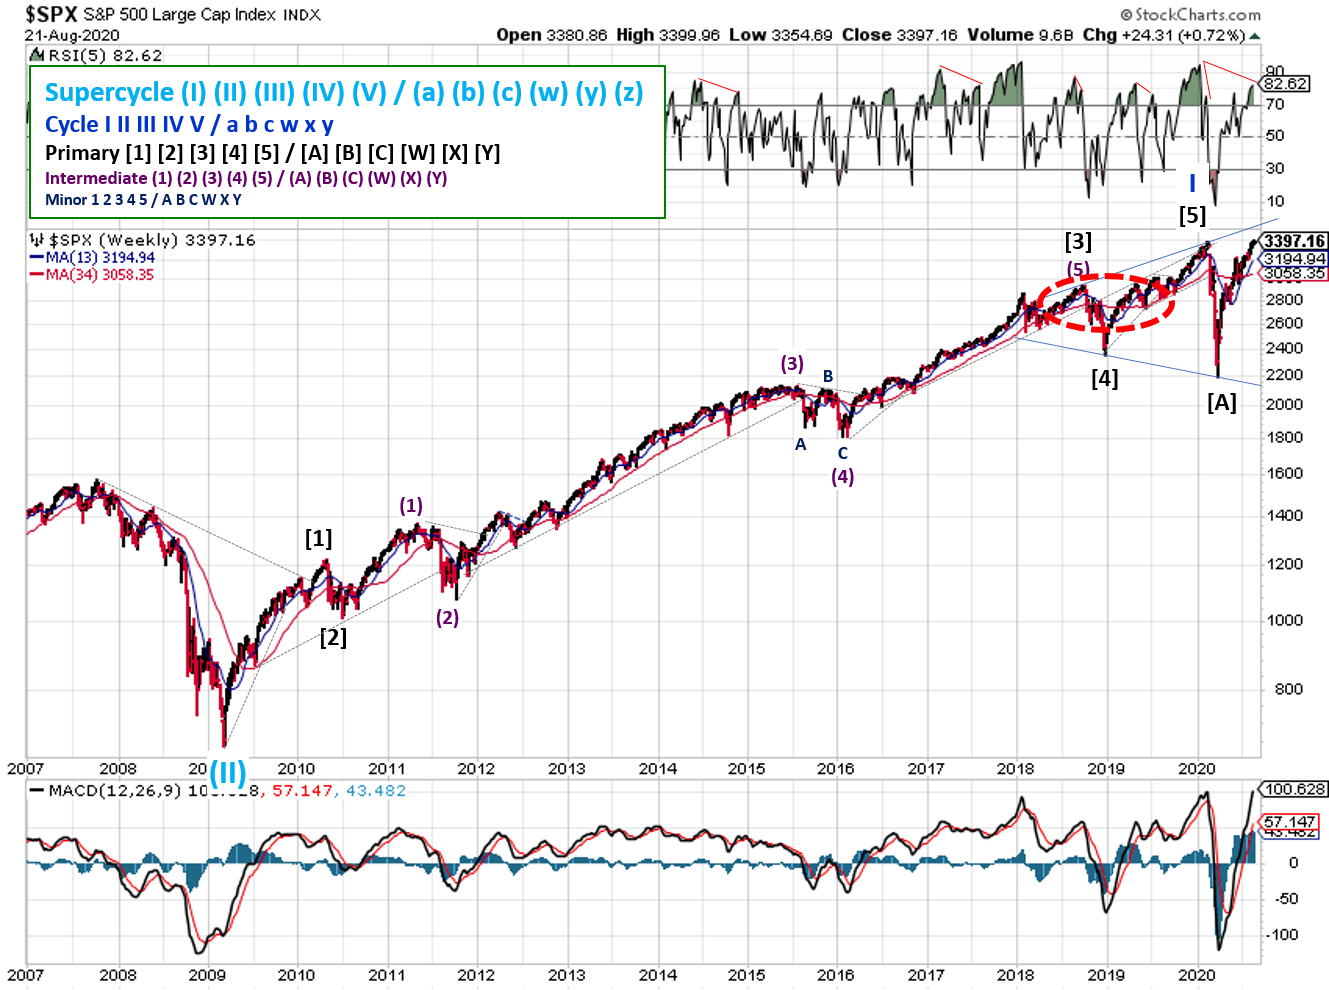
2020-09-06-SPX Trendline Analysis-Weekly

In the weekly view, a negative RSI divergence shows up, which is why it’s possible for a 5th wave ending last week.  The megaphone pattern we discussed a few weeks back appears to have held, with the S&P barely breaching the upper-bound before falling lower.

COMMENTARY

While the “markets” may be surging higher, it has been on the backs of large technology companies. Amazon, Apple, Facebook, Google, and Microsoft are the 5 largest companies in the index, and account for almost a quarter of the S&P 500’s current market cap. Basically, 1% of the 500 companies in the index account for 25% of the combined “value” of all 500.

But market cap doesn’t really tell the whole story. Through the end of August, the total return for the S&P500 was ~9.7%. The weighted average return for the top 5 largest companies was ~15.6%. That means the weighted average return for the other 495 stocks in the index was…-5.8%. That’s right…down for the year (hat tip to CMG). And September is the weakest month, in terms of historical returns.

With prices near all time highs, an ADX cross-over, and a “mature” uptrend in Elliott Wave, it’s time to review your positions (sizing and performance). Play with house money (aka your profits) where you can, cut your losses where you can’t.

Short week ahead, as the U.S. exchanges are closed tomorrow for the Labor Day Holiday.

Best to your week!

Posted in Historical Data, Market Trends | Tagged , , , , | Comments Off on Weekend Stock Market Outlook

Weekend Stock Market Outlook

Stock Market Outlook entering the Week of August 30th= Uptrend

    • ADX Directional Indicators: Uptrend
    • Price & Volume Action: Uptrend
    • Elliott Wave Analysis: Uptrend

ANALYSIS
The stock market outlook remains in an uptrend heading into the week, with bullish trends in place for the ADX, price/volume, and Elliott Wave.

Technical analysis of daily SPX prices

2020-08-30-SPX Trendline Analysis-Daily

The S&P500 ($SPX) now sits ~12% above the 200-day; odds still favor sideways or downward price action near-term.  But the first technical support level would be the May to June trendline.

The ADX shows a strong bullish trend in place, and price/volume action has also been bullish.  The “correct” Elliott Wave count isn’t clear (to me at least).  I adjusted the wave labeling, but all I really know is that it hasn’t turned bearish yet, so it’s still risk on.

Technical analysis of daily SPX prices

2020-08-30-SPX Elliott Wave Analysis-Daily-Intermediate C

Considering the current rally has retraced the entire downtrend and price is sitting at all time highs, it’s possible the S&P will reach a Fibonacci extension target before another correction.  For example:

  • 114.6% of the prior downtrend = 1377 points = 3,568 (~2% from Friday’s close)
  • 123.6% of the prior downtrend = 1485 points = 3,676 (~5% from Friday’s close)
  • 132.8% of the prior downtrend = 1596 points = 3,787 (~8% from Friday’s close)
  • 161.8% of the prior downtrend = 1944 points = 4,135 (~18% from Friday’s close)

The RSI may not be showing a divergence anymore, but now it’s extremely overbought; pick your poison.

COMMENTARY

Earnings season is wrapping up, with most companies reported better than expected earnings in Q2.  Definitely the right direction, but definitely not an all clear. You may have also heard that some heavyweights of the Dow Jones index (Exxon Mobil, Pfizer, and Raytheon) will be replaced September 1st by Amgen, Honeywell, and Salesforce.

More importantly, the Fed held their annual meeting in Jackson Hole, Wyoming, which included a major change in the way inflation will be viewed in the years ahead.

Basically, the Fed doesn’t want deflation. They’re so scared of it that they’re willing to let inflation run higher than their 2% target if inflation is below that target for too long…like it has been…for the past 10 years…despite the Fed’s use of record low interest rates and massive lending programs (the Fed can lend, but not spend…at least right now).

Near term, that probably won’t change much…interest rates and inflation have both been low for a while now.  And now we know rates won’t change even when we do finally see inflation.

This creates issues for investors and their asset allocation strategies.  Stocks will outperform with rates near zero, because they’re basically the only game in town if you want a return.  Investors have also piled into bonds, because any return is better than no return or a loss.  But when we eventually do see sustained inflation over and above the target, one or two quarter point rate hikes aren’t going to cut it.  And that’s going to shock the system.

Bonds lose value when rates rise…great for investors looking to buy, but not so good for those who need to sell.  Rising rates aren’t usually good for stocks because the cost of doing business (raw materials, corporate debt, wages, etc.) are higher.

From a personal finance perspective, this is a troubling development too.

Think back to a time when you got a “cost of living” raise at work;  this was meant to compensate for increased expenses due to inflation.  Rudy Havenstein tweeted “When you see the word ‘inflation,’ replace it with the phrase ‘the cost of living’ and see if you like what you hear”.  When we do finally see inflation, expect you’re expenses to increase more for a longer period time.

And +2% inflation is already here…it’s just not evenly distributed.  How you personally experience it is totally dependent on your expenses.  Have a lot of housing, health care, education, or energy expenses?  Then you know what I’m talking about.  Letting average inflation run higher than 2% will likely mean those expenses increase even more in the coming years!

And since the Fed calculates inflation based on a bunch of different expenses, that distribution is even more lumpy.  Let’s say the your meal/pet toy/clothes subscription box goes from 25 to 30 bucks a month (for example).  $5 may not seem like a big deal, but that’s 20% inflation!  At the same time, your new OLED TV probably goes from $799 to $749.  Average those two expenses together, and the net inflation is actually <1%; if those two expenses were the “basket of expenses” the Fed uses to calculate inflation, they would say that we need to continue with lower interest rates because we’re below target.

It’s not all bad though.  We all still have time to prepare, do research, make a plan. Some jobs will command much higher salaries.  You’ll actually be able to get a decent return from a savings account!  And all the money that central banks have and will unleash has to go somewhere.  Where will that money flow?  Bonds?  Gold?  Crypto?  TIPS?

Best to your week!

Posted in Historical Data, Market Trends | Tagged , , , , | Comments Off on Weekend Stock Market Outlook

Weekend Stock Market Outlook

Stock Market Outlook entering the Week of August 23rd = Uptrend

    • ADX Directional Indicators: Uptrend
    • Price & Volume Action: Uptrend
    • Elliott Wave Analysis: Uptrend

ANALYSIS
No change in the stock market outlook; uptrend with green across the board (ADX, price/volume, or Elliott Wave).

Technical analysis of daily SPX prices

2020-08-23-SPX Trendline Analysis-Daily

The S&P500 ($SPX) sits 10% above the 200-day; that’s historically extended, so odds favor sideways or downward price action from there. The first level of support is the May-June trendline.

Technical analysis of daily SPX prices

2020-08-23-SPX Elliott Wave Analysis-Daily-Intermediate A

Since we’re basically at all time highs, there’s a lot of discussion regarding EW counts, with lots of different price targets thrown around (both bull and bear cases). The S&P reached an all time high of 3399.96 on Friday and exceeded the 3393 a few times during the week. All those excursions came on weaker RSI readings.

The price action isn’t convincing enough to say the current count is wrong, but enough to cast doubt on it for sure.  I’ve kept an alternate count, because I really think the June 8th high was the end of a 5th wave that completed Intermediate A.

Technical analysis of daily SPX prices

2020-08-23-SPX Elliott Wave Analysis-Daily-Intermediate C

I honestly don’t know which EW count is correct…and most likely no one will until after we see the depth of the next correction.  But that’s also why I choose to use more than one signal.

In any case, what we do know, is that:

  • The rally from the March low retraced 100% of the prior decline
  • Since the last corrective wave in June, we can see 5 waves, even if everyone doesn’t agree on the price where each of the waves start and end
  • When 5th waves end, it’s correction time

The good news is that the differences in the counts (Intermediate A vs C / Bull verses Bear market) don’t change the fact that we should see a correction soon. They just impact “how big” people think the next correction will be…what price targets they use for trading.

Technical analysis of weekly SPX prices

2020-08-23-SPX Trendline Analysis-Weekly

I haven’t shown the long-term view in while. You can see the negative divergence more clearly, in terms of RSI. And look at price action in 2019; the S&P sold off after recovering from a big decline and reaching the prior all-time high (set in the middle of 2018).

Still, that doesn’t mean the markets can’t go higher. I saw someone calling for the megaphone pattern to continue, which could see the S&P500 rise above 3500…before heading back below 2200!

COMMENTARY

Hitting all time highs on the S&P means that we’ve just experienced the fastest bear-market plunge, followed by the second-fastest bear-market recovery ever (in U.S. markets at least).  And in no way is the underlying economy anywhere close to as strong as is was pre-plunge.  May you live in interesting times indeed!

Many have asked why are stock prices so high, when the underlying economy is not so great.  Basically, it’s the only game in town if you’re looking for a return on your investment.  With interest rates essentially zero and the U.S. Federal Reserve buying bonds, there’s a lot of money looking for a home.  I’m talking about market makers like hedge funds, asset managers, institutional investors, corporations, etc…even countries (check out Swiss investments in US stocks).  They’ve got to put their money somewhere.  You and I are just along for the ride.

The current rally has been really kind to tech stocks and other COVID plays, so your allocations may be a little out of whack. It’s probably a good time to take some profits.

Best to your week!

Posted in Historical Data, Market Trends | Tagged , , , , | Comments Off on Weekend Stock Market Outlook

Weekend Stock Market Outlook

Stock Market Outlook entering the Week of August 16th = Uptrend

    • ADX Directional Indicators: Uptrend
    • Price & Volume Action: Uptrend
    • Elliott Wave Analysis: Uptrend

ANALYSIS
Little change in price last week means the stock market outlook shows an uptrend in place this week.

Technical analysis of daily SPX prices

2020-08-16-SPX Trendline Analysis-Daily

The S&P500 ($SPX) is oh so close to a new all time high, and is up ~3.5% for the year, believe it or not.  It’s also looking a bit extended from the 200-day moving average.  Not quite to the levels seen in Q1 of this year, but something to watch.  No change in the ADX or price/volume signals, though we did pick up a distribution day. The support trendline also remains in place.

Technical analysis of daily SPX prices

2020-08-16-SPX Elliott Wave Analysis-Daily-Intermediate A

Elliott Wave is still a problem for this uptrend, and there was another negative divergence in the RSI last week as prices came within a few points of the all time high.

An Intermediate B wave typically retraces 50-79% of the Intermediate A wave. If the count and pattern holds, the target for the next downtrend somewhere between 2800 and 2400.

COMMENTARY
On the upside, U.S. retail sales were strong in July, and actually bested levels prior to the pandemic. But that improvement came with increased inflation, and negotiations for another aid package have stalled.

Given that we’re in a historically “weak” period for market prices, it wouldn’t be surprising to see a pull back over the next 2-3 weeks.

Best to your week!

Posted in Historical Data, Market Trends | Tagged , , , , | Comments Off on Weekend Stock Market Outlook

Weekend Stock Market Outlook

Stock Market Outlook entering the Week of August 9th = Uptrend

    • ADX Directional Indicators: Uptrend
    • Price & Volume Action: Uptrend
    • Elliott Wave Analysis: Uptrend

ANALYSIS
Basically a carbon copy of last week’s stock market outlook; no change in the signals and price action remained bullish.

Technical analysis of daily SPX prices

2020-08-09-SPX Trendline Analysis-Daily

The S&P500 ($SPX) support trendline, remains in place, and isn’t overly extended from the 50 & 200 day moving averages.

The Elliott Wave count, if correct, shows a correction should start any day now.  The negative divergence in the RSI remains in place verses the highs in June and July (not by much though)…common for the end of a 5th wave.

That said, in order for the current count to be correct, the Minor 5 wave needs to end before it exceeds the February high (3393). Heading into the week, the S&P is just 42 points shy of that level. Not exactly a risk-on scenario.

Technical analysis of daily SPX prices

2020-08-09-SPX Elliott Wave Analysis-Daily-IntermediateA

Of course, the count could be wrong, which is why I don’t use just one signal. Downside risk is roughly 6%; that’s how far the S&P500 would need to fall before breaking the 50-day moving average and generating a sell signal in the other indicators.

COMMENTARY
U.S. employment figures were released last week, beating estimates for hiring in July.

Despite the positive headlines, underlying data isn’t great. There are still a lot of people that aren’t getting paid what they did a few months ago.  The longer that situation persists, the larger the impact on consumption, and therefore the economy.

70+% of our economy is based on consumption, so while the stimulus checks help people stay afloat, they won’t necessary improve the economic recovery. Does the stimulus check get saved, get invested, or go towards paying down debt? If yes, then it’s impact is limited.

That’s not to say the stock market can’t continue to climb. All that liquidity from the various central banks has to go somewhere! Talking heads justify current prices by saying that “the market” is now looking past near term earnings (since they will be bad) and focusing on expected earnings in 2021 or 2022 (even though firms aren’t providing guidance out that far). Since the situation will eventually get better (people get back to work, find similar paying jobs, etc.), there’s no need to reprice.

It’s like a wink and a nod that we’ll all pretend everything is okay…which is great as along as everyone keeps pretending! It’s the prisoner’s dilemma at work.

Best to your week!

Posted in Historical Data, Market Trends | Tagged , , , , | Comments Off on Weekend Stock Market Outlook

Weekend Stock Market Outlook

Stock Market Outlook entering the Week of August 2nd = Uptrend

    • ADX Directional Indicators: Uptrend
    • Price & Volume Action: Uptrend
    • Elliott Wave Analysis: Uptrend

ANALYSIS
No change in the ADX, price/volume, or Elliott Wave signals, so the stock market outlook maintains an uptrend.

Technical analysis of daily SPX prices

2020-08-02-SPX Trendline Analysis-Daily

The S&P500 ($SPX) remains above the support trendline, as well as the moving averages. The ADX remains bullish, while prices remain above the 50-day moving average with a low number of distribution days.

Technical analysis of daily SPX prices

2020-08-02-SPX Elliott Wave Analysis-Daily-IntermediateA

For Elliott Wave, the Minor 5 wave is nearing completion.  The [v] subwave should complete the pattern, as well as the Intermediate [A] wave. Afterwards, the Intermediate [B] correction should take hold.

COMMENTARY
A lot of data last week!  On the “Wall Street” side, earnings reports came in fast and furious.  Really, it was the Amazon, Apple, and Facebook show, as their performance was much better than expected…and their CEOs were dragged in front of Congress to discuss anti-trust.

Quarterly US GDP growth saw its sharpest downturn on record, but even that wasn’t “as bad” as everyone feared.  But Democrats and Republicans are still struggling to come up with agreeable terms for the next round of stimulus, which won’t help “Main Street” at all.

More earnings on tap this week, along with updated unemployment numbers.

Best to your week!

Posted in Historical Data, Market Trends | Tagged , , , , | 2 Comments

Weekend Stock Market Outlook

Stock Market Outlook entering the Week of July 26th = Uptrend

    • ADX Directional Indicators: Uptrend
    • Price & Volume Action: Uptrend
    • Elliott Wave Analysis: Uptrend

ANALYSIS
The stock market outlook uptrend continues; no change in the signals last week.

Technical analysis of daily SPX prices

2020-07-26-SPX Trendline Analysis-Daily

The S&P500 ($SPX) remains above key support levels, the ADX remains bullish, and institutional selling remains low.

Technical analysis of daily SPX prices

2020-07-26-SPX Elliott Wave Analysis-Daily-Intermediate A

No change to the Elliott Wave count; the Minor 4 wave completed at the end of June, and the Minor 5 in progress since then. With the market selling off Thursday and Friday, it looks like S&P completed the (3) sub-wave last week. Based on this count, I wouldn’t expect prices to fall much further, since first waves and fourth waves aren’t allowed to overlap; (1) completed at 3184.

All that said, now is not the time to be complacent. It’s earnings season, and your favorite stock may just be one conference call away from a major selloff; just ask Intel shareholders.

COMMENTARY
Not the best week for equities. The E.U. agreed on a stimulus package, but that was about the only positive. The U.S. is still negotiating a second packages, but current benefits set to expire at the end of the week. Initial jobless claims increased for the first time since March.

As if Q2 earnings and a global pandemic weren’t enough to keep markets occupied, geopolitical tensions came back into the headlines last week. The U.S. State Department ordered China to close its Houston consulate, alleging the site was part of a Chinese espionage effort using diplomatic facilities across the US. In response, China ordered the U.S. to close its consulate in Chengdu.

Earnings season kicks into high gear this week, with almost 40% of the S&P500 reporting.

Best to your week!

Posted in Historical Data, Market Trends | Tagged , , , , | Comments Off on Weekend Stock Market Outlook