
Stock Market Outlook entering the Week of August 2nd = Uptrend
-
- ADX Directional Indicators: Uptrend
- Price & Volume Action: Uptrend
- Elliott Wave Analysis: Uptrend
ANALYSIS
No change in the ADX, price/volume, or Elliott Wave signals, so the stock market outlook maintains an uptrend.
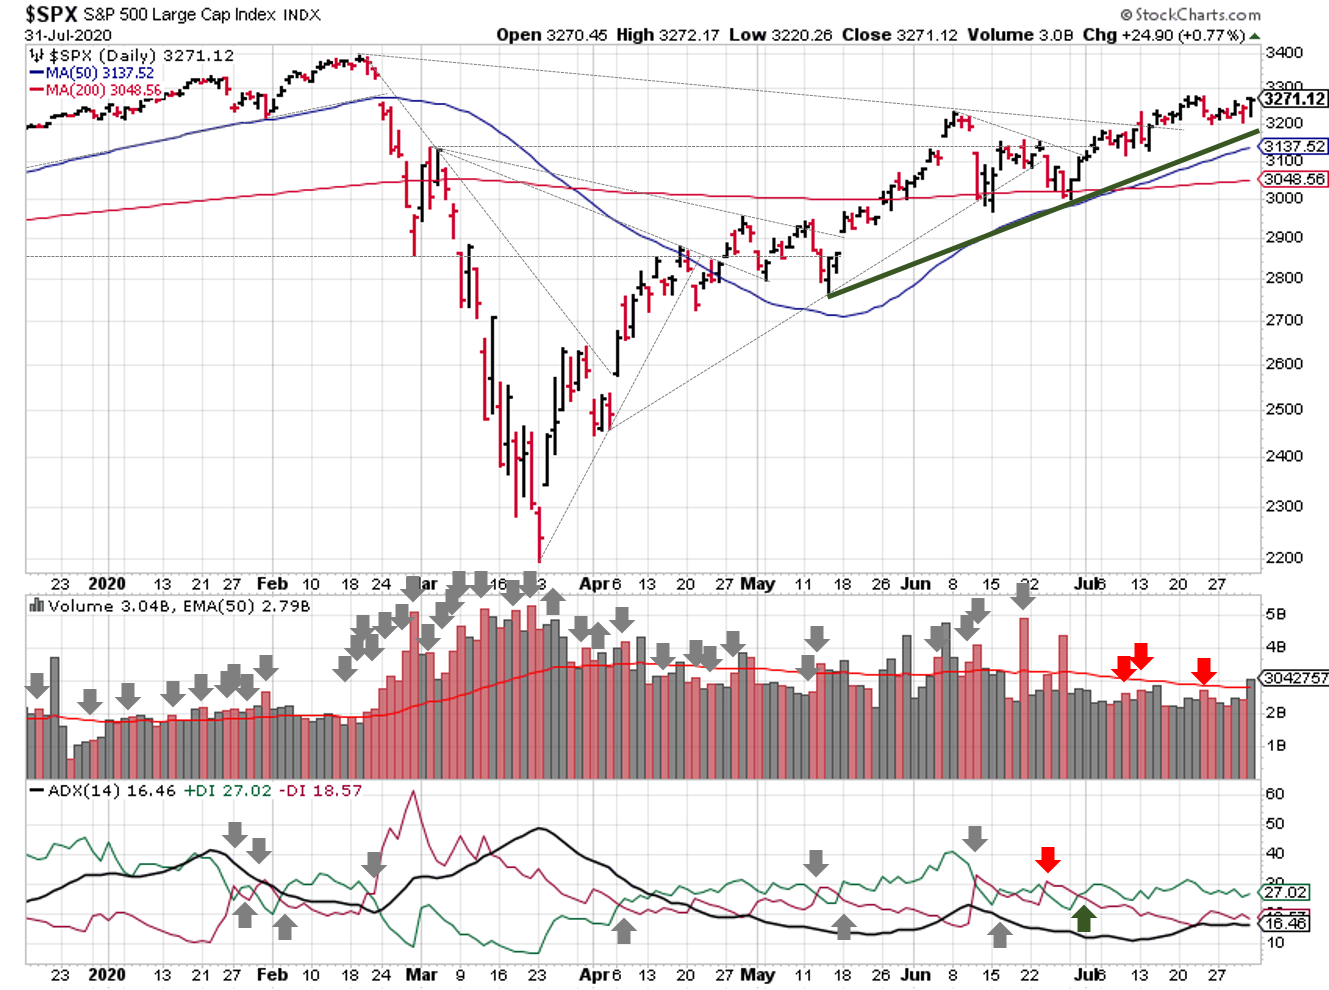
2020-08-02-SPX Trendline Analysis-Daily
The S&P500 ($SPX) remains above the support trendline, as well as the moving averages. The ADX remains bullish, while prices remain above the 50-day moving average with a low number of distribution days.
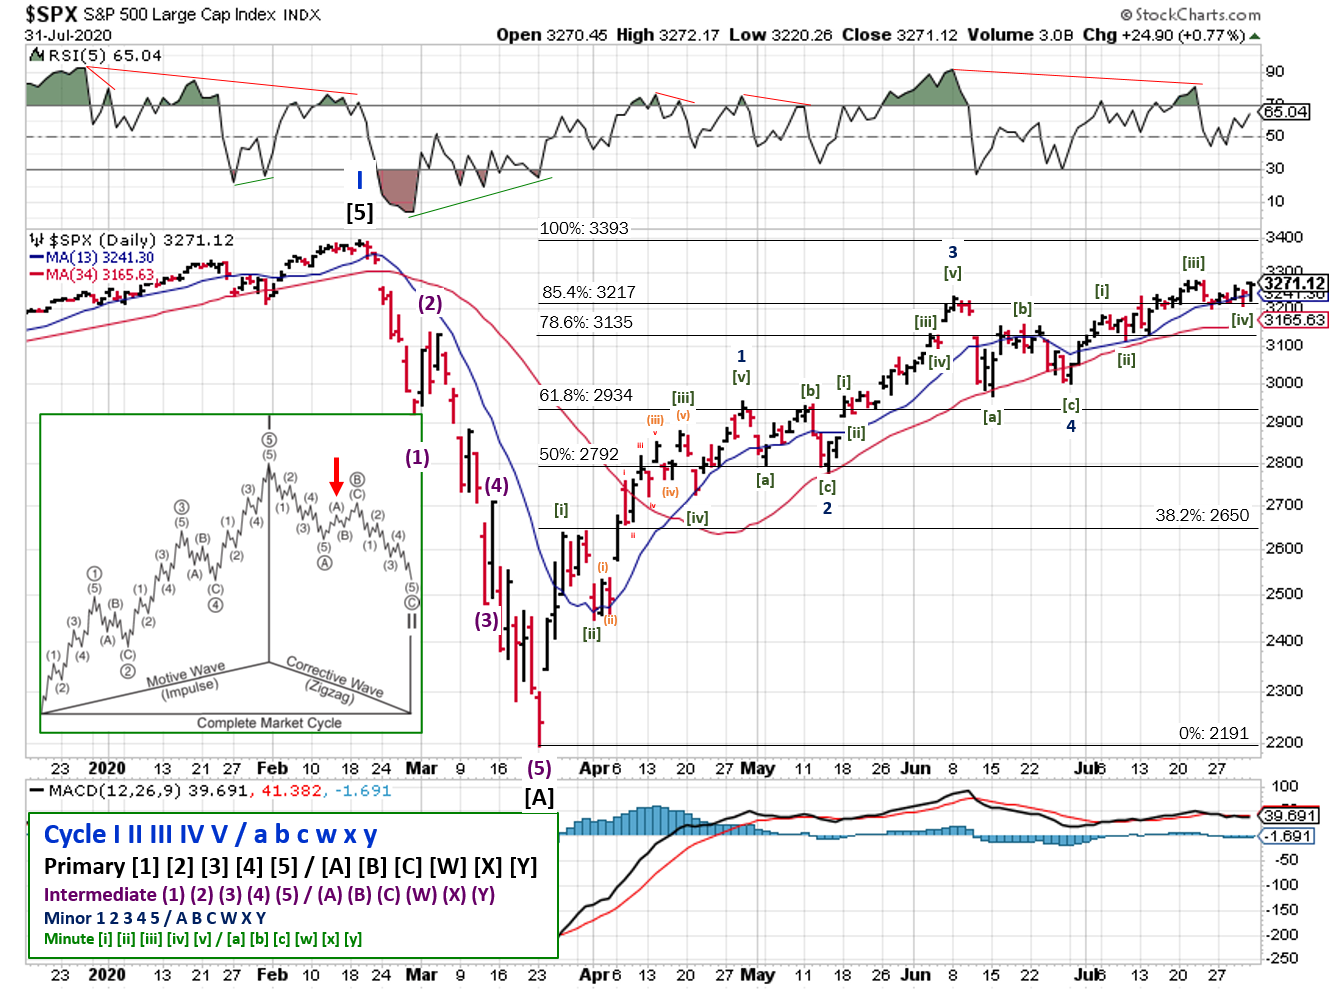
2020-08-02-SPX Elliott Wave Analysis-Daily-IntermediateA
For Elliott Wave, the Minor 5 wave is nearing completion. The [v] subwave should complete the pattern, as well as the Intermediate [A] wave. Afterwards, the Intermediate [B] correction should take hold.
COMMENTARY
A lot of data last week! On the “Wall Street” side, earnings reports came in fast and furious. Really, it was the Amazon, Apple, and Facebook show, as their performance was much better than expected…and their CEOs were dragged in front of Congress to discuss anti-trust.
Quarterly US GDP growth saw its sharpest downturn on record, but even that wasn’t “as bad” as everyone feared. But Democrats and Republicans are still struggling to come up with agreeable terms for the next round of stimulus, which won’t help “Main Street” at all.
More earnings on tap this week, along with updated unemployment numbers.
Best to your week!


Nice,
I’m new to your thinking, can I find somewhere on your blog how you analyse the trend of “Price & Volume Action”.
Thx.
The price/volume analysis is very similar to the method used by IBD for identifying the market trend. At a high level, markets are in an uptrend when price above the 50-day and in a downtrend when price is below the 50-day moving average. A high level of distribution days (6 or more) usually indicate a change from uptrend to downtrend. A switch from downtrend to uptrend usually occurs with a combination of large (%) price move upward, with high trading volume.