
Stock Market Outlook entering the Week of August 23rd = Uptrend
-
- ADX Directional Indicators: Uptrend
- Price & Volume Action: Uptrend
- Elliott Wave Analysis: Uptrend
ANALYSIS
No change in the stock market outlook; uptrend with green across the board (ADX, price/volume, or Elliott Wave).
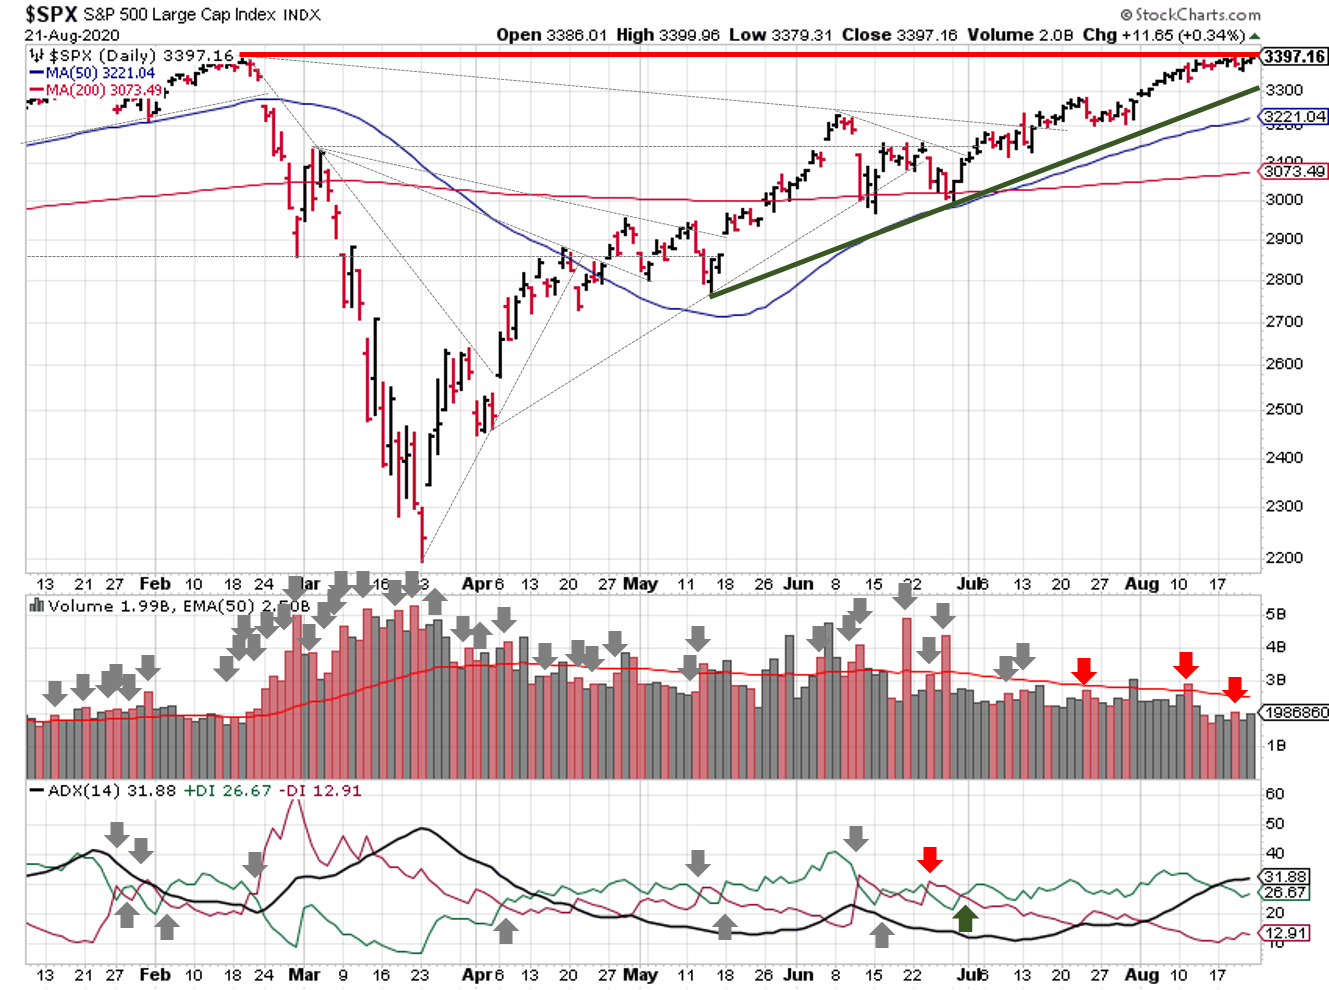
2020-08-23-SPX Trendline Analysis-Daily
The S&P500 ($SPX) sits 10% above the 200-day; that’s historically extended, so odds favor sideways or downward price action from there. The first level of support is the May-June trendline.

2020-08-23-SPX Elliott Wave Analysis-Daily-Intermediate A
Since we’re basically at all time highs, there’s a lot of discussion regarding EW counts, with lots of different price targets thrown around (both bull and bear cases). The S&P reached an all time high of 3399.96 on Friday and exceeded the 3393 a few times during the week. All those excursions came on weaker RSI readings.
The price action isn’t convincing enough to say the current count is wrong, but enough to cast doubt on it for sure. I’ve kept an alternate count, because I really think the June 8th high was the end of a 5th wave that completed Intermediate A.
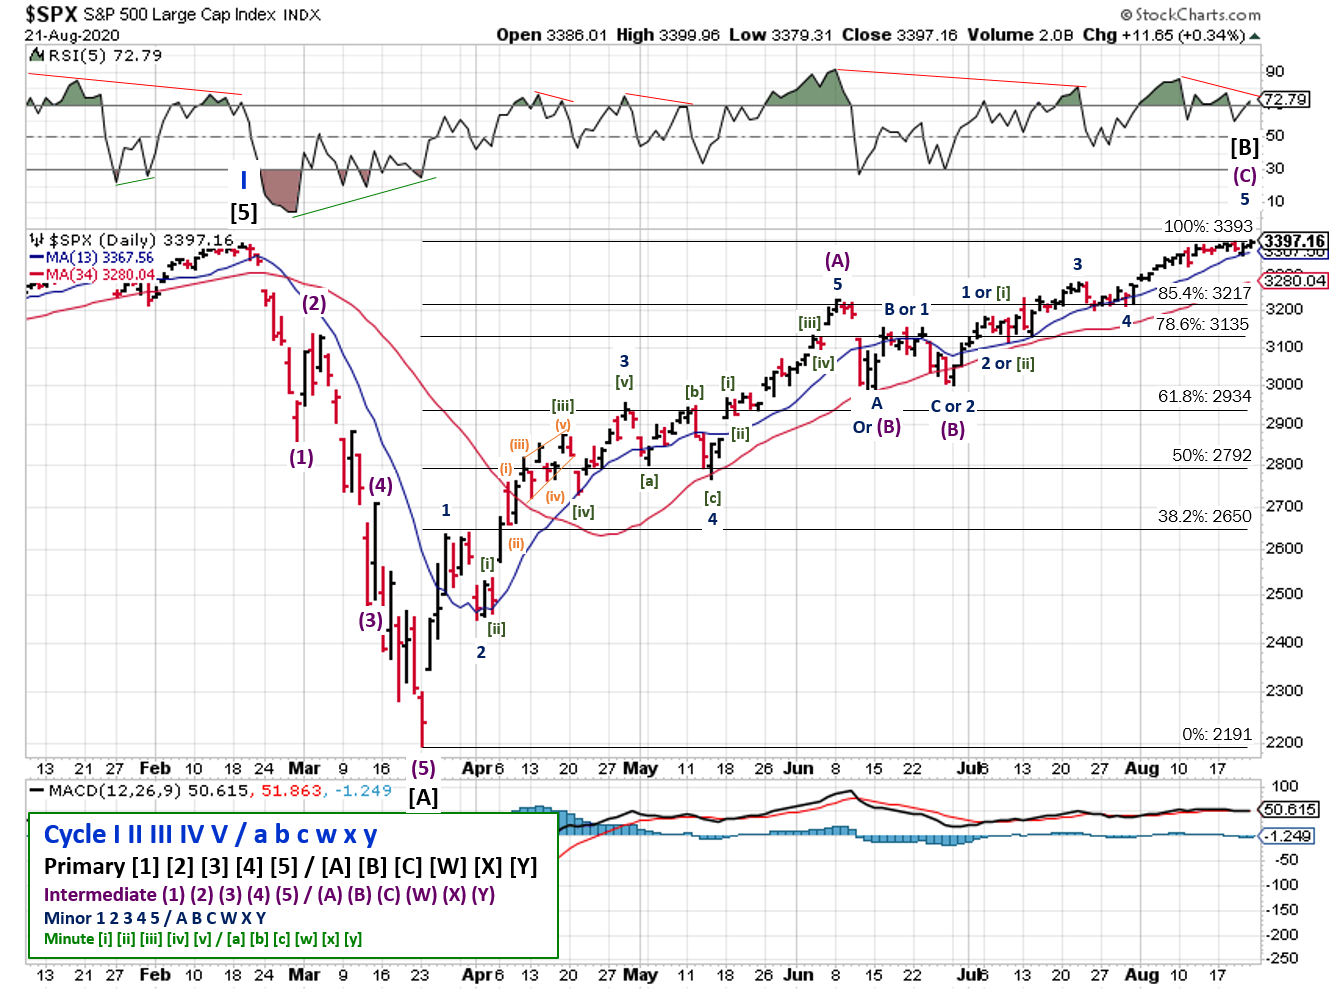
2020-08-23-SPX Elliott Wave Analysis-Daily-Intermediate C
I honestly don’t know which EW count is correct…and most likely no one will until after we see the depth of the next correction. But that’s also why I choose to use more than one signal.
In any case, what we do know, is that:
- The rally from the March low retraced 100% of the prior decline
- Since the last corrective wave in June, we can see 5 waves, even if everyone doesn’t agree on the price where each of the waves start and end
- When 5th waves end, it’s correction time
The good news is that the differences in the counts (Intermediate A vs C / Bull verses Bear market) don’t change the fact that we should see a correction soon. They just impact “how big” people think the next correction will be…what price targets they use for trading.
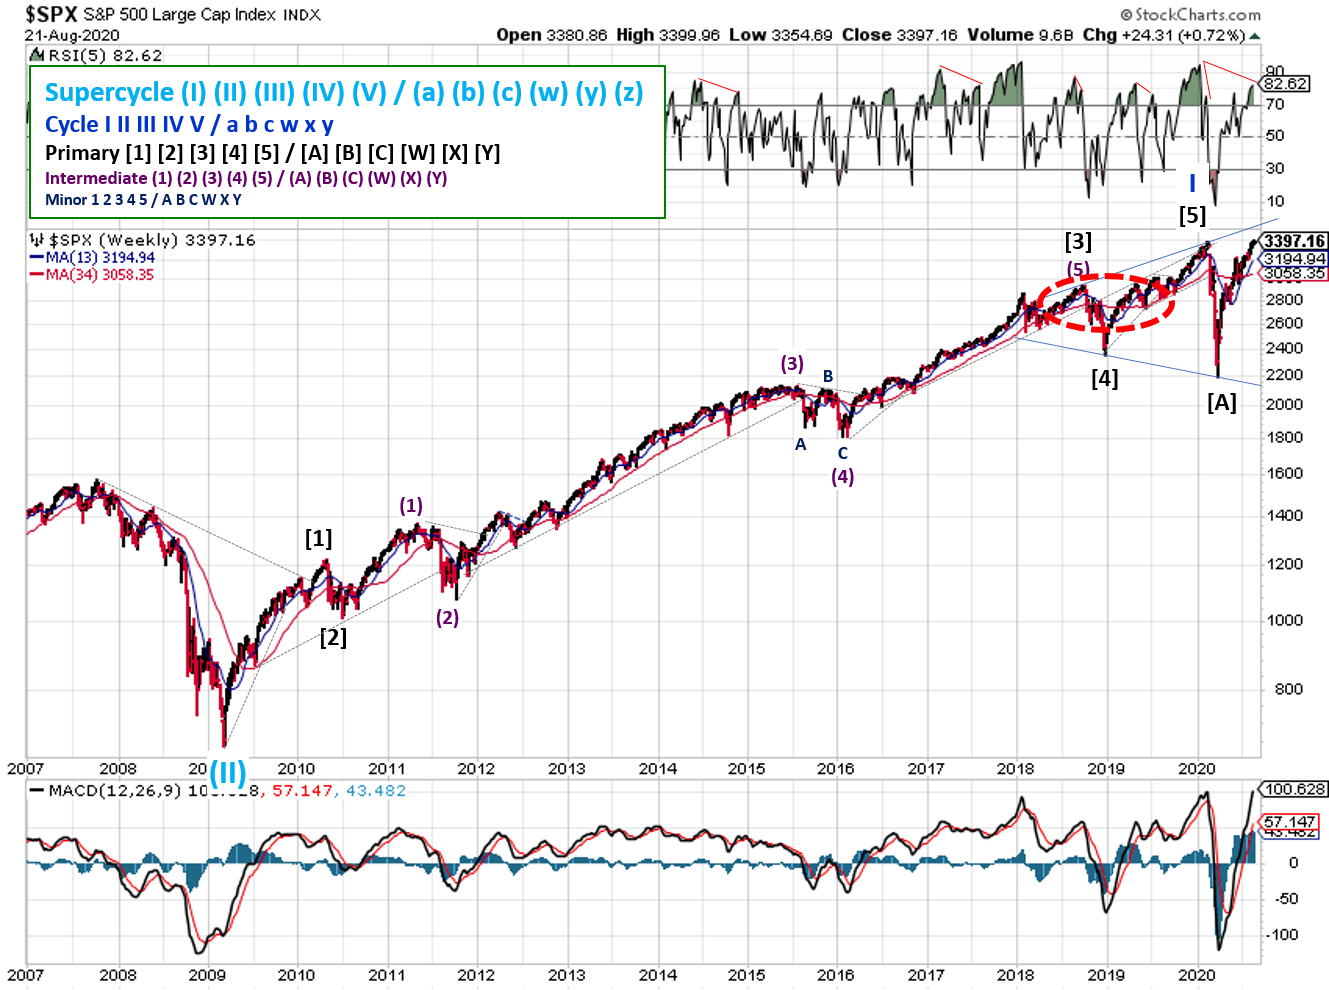
2020-08-23-SPX Trendline Analysis-Weekly
I haven’t shown the long-term view in while. You can see the negative divergence more clearly, in terms of RSI. And look at price action in 2019; the S&P sold off after recovering from a big decline and reaching the prior all-time high (set in the middle of 2018).
Still, that doesn’t mean the markets can’t go higher. I saw someone calling for the megaphone pattern to continue, which could see the S&P500 rise above 3500…before heading back below 2200!
COMMENTARY
Hitting all time highs on the S&P means that we’ve just experienced the fastest bear-market plunge, followed by the second-fastest bear-market recovery ever (in U.S. markets at least). And in no way is the underlying economy anywhere close to as strong as is was pre-plunge. May you live in interesting times indeed!
Many have asked why are stock prices so high, when the underlying economy is not so great. Basically, it’s the only game in town if you’re looking for a return on your investment. With interest rates essentially zero and the U.S. Federal Reserve buying bonds, there’s a lot of money looking for a home. I’m talking about market makers like hedge funds, asset managers, institutional investors, corporations, etc…even countries (check out Swiss investments in US stocks). They’ve got to put their money somewhere. You and I are just along for the ride.
The current rally has been really kind to tech stocks and other COVID plays, so your allocations may be a little out of whack. It’s probably a good time to take some profits.
Best to your week!


