Stock Market Outlook entering the Week of January 24th = Uptrend
-
- ADX Directional Indicators: Uptrend
- Price & Volume Action: Uptrend
- Elliott Wave Analysis: Uptrend
ANALYSIS
The stock market outlook remains in an uptrend and recovered a bit of strength last week.
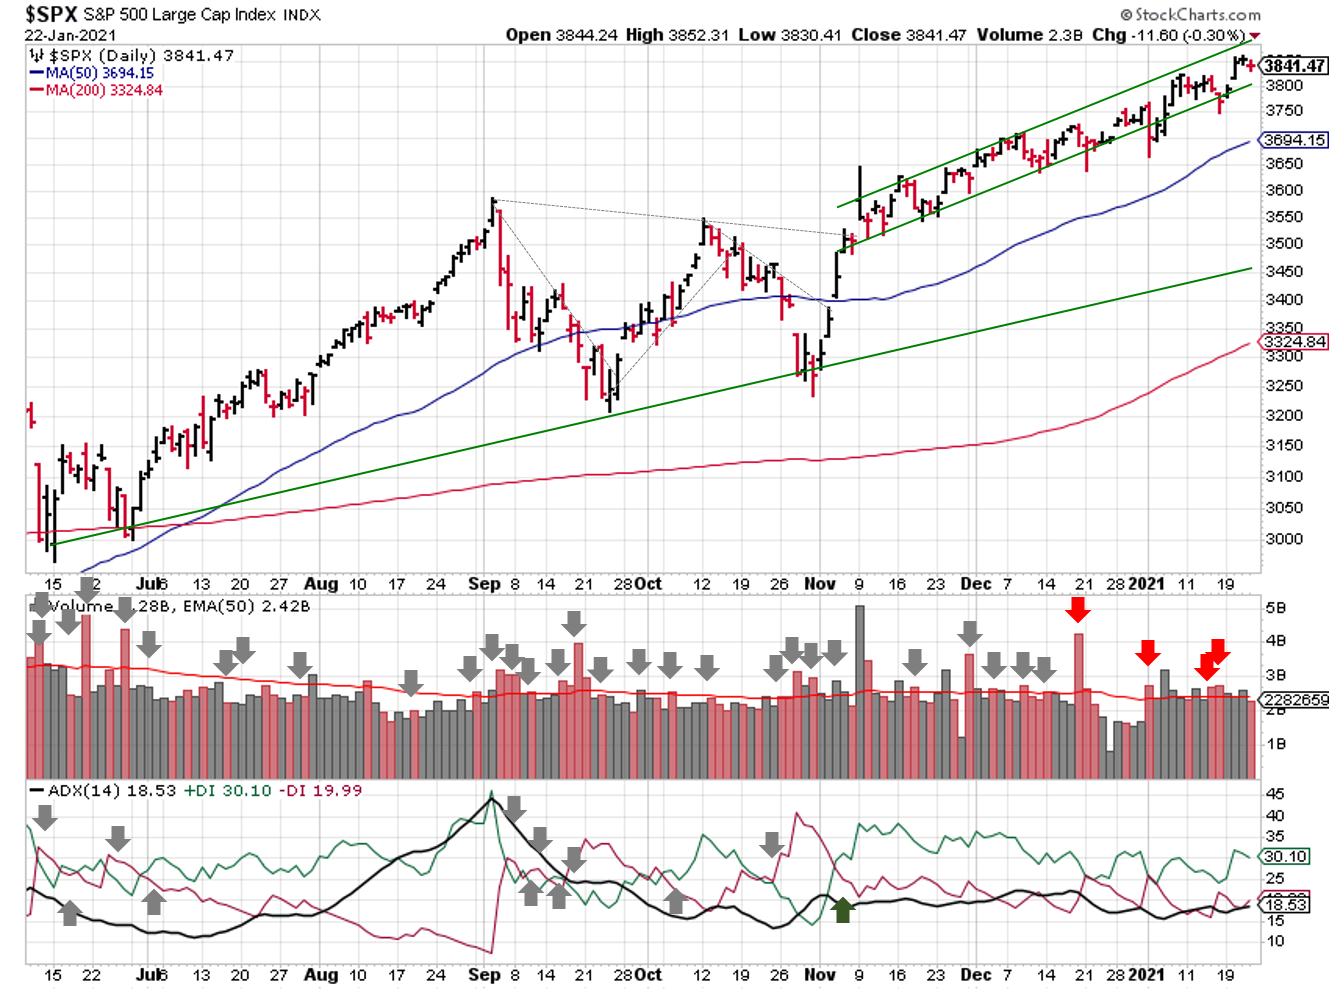
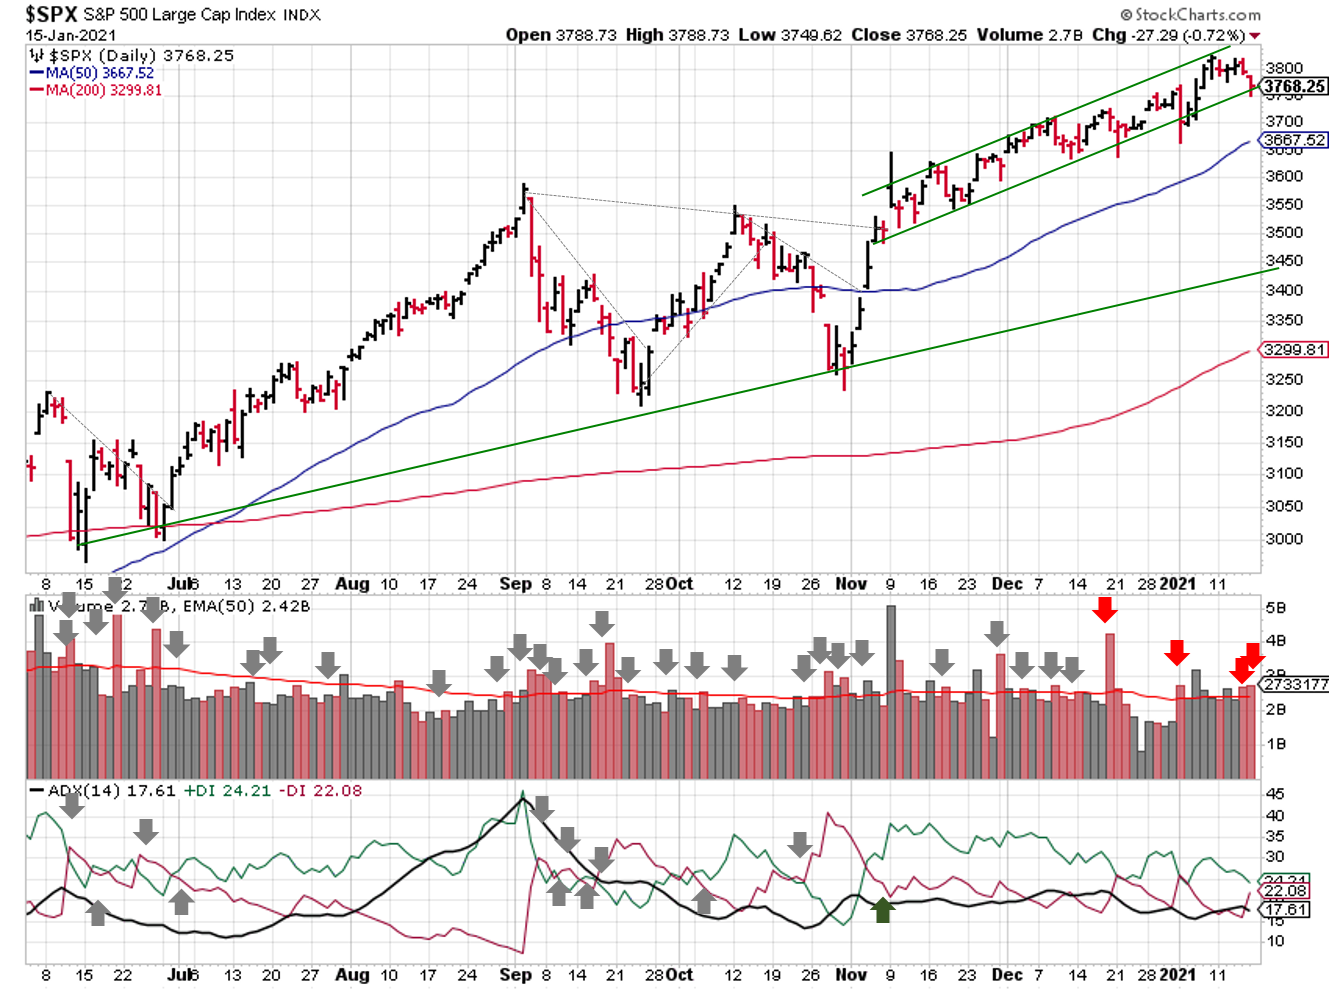
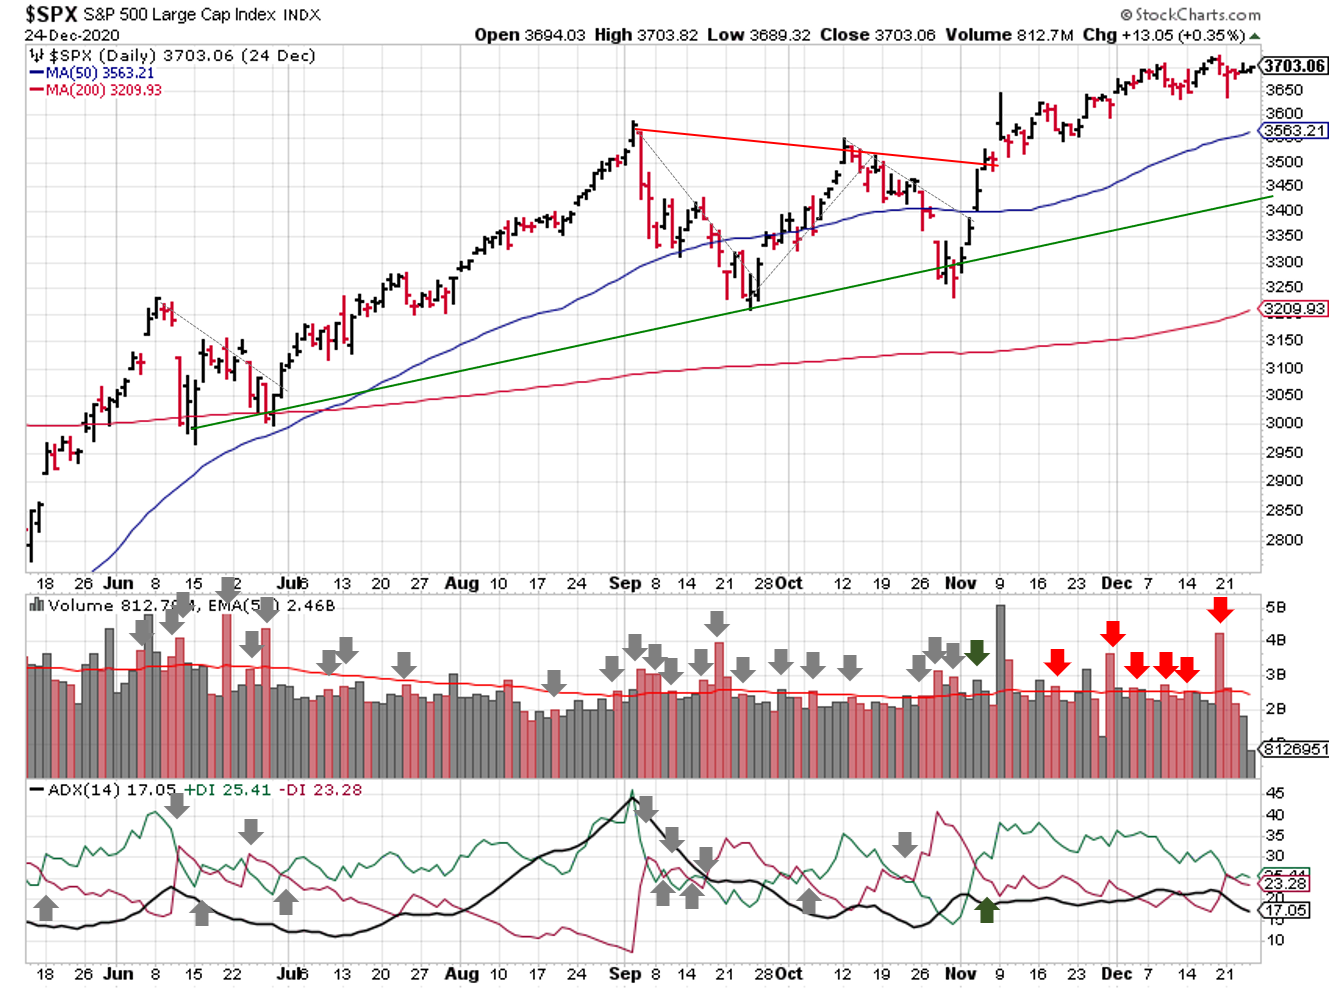
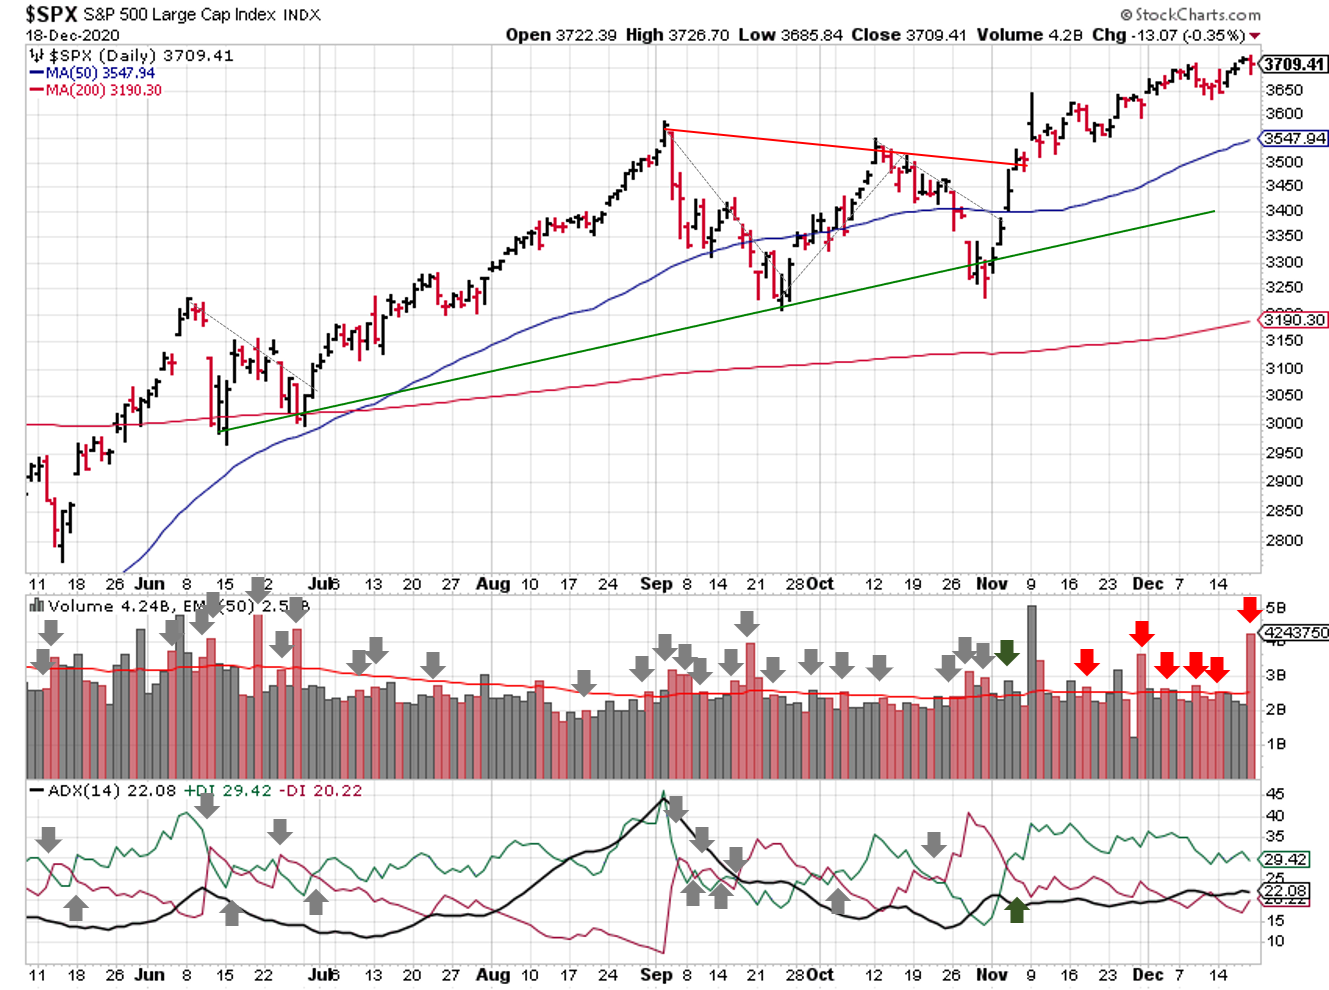
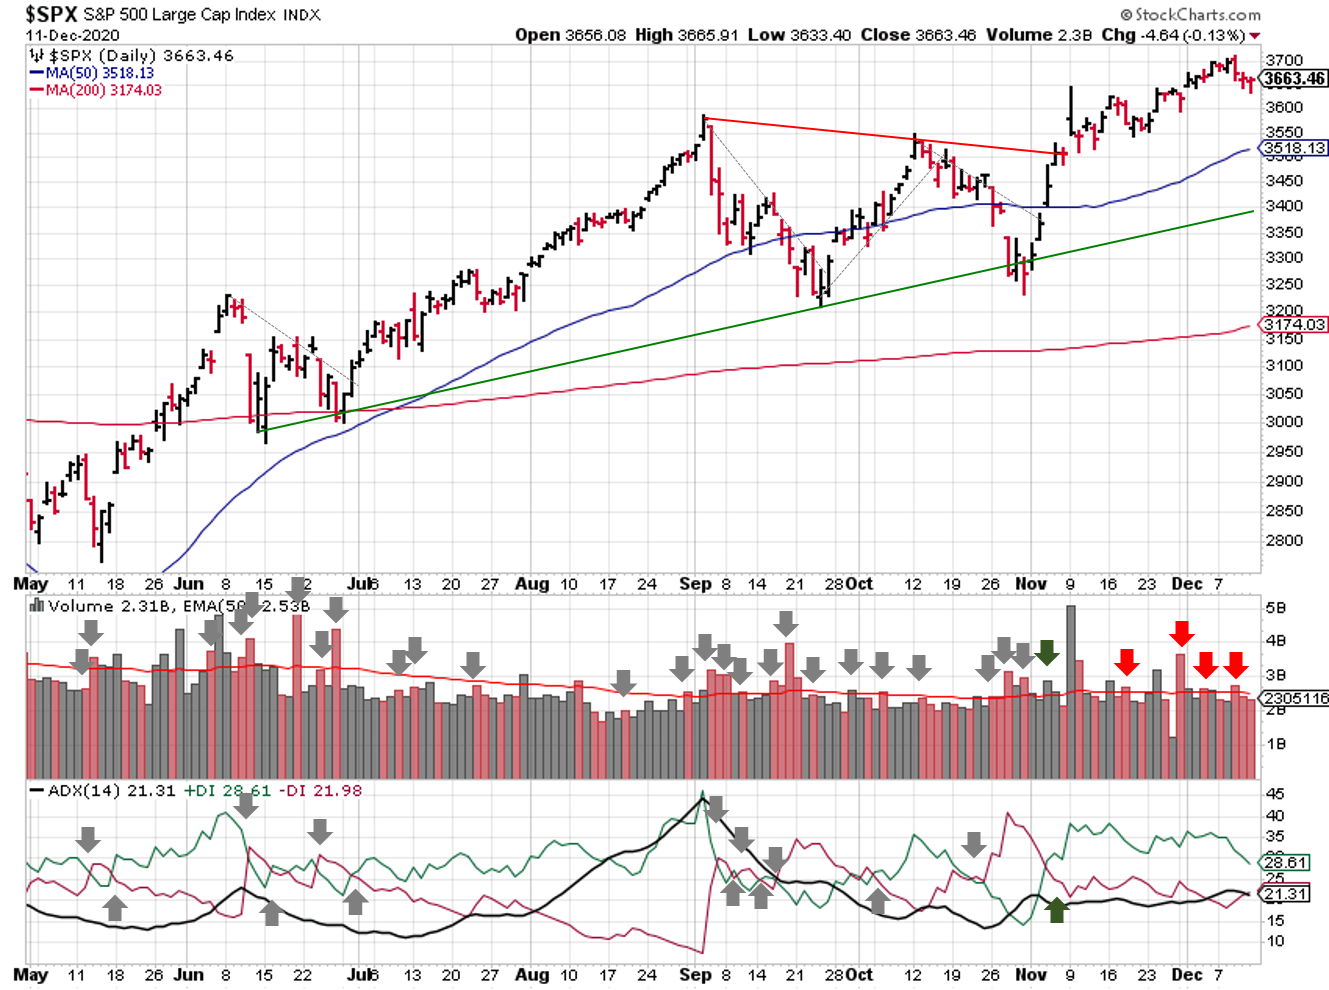
2021-01-24-SPX Trendline Analysis-Daily
The S&P500, ($SPX) sits in the middle of a rising price channel, maintaining a fairly constant gap to the 50 and 200 day moving averages since November.
The ADX reading is on the rise (a bullish sign), although the absolute value remains below the threshold for strong trends…not surprising considering the narrow price channel in place.
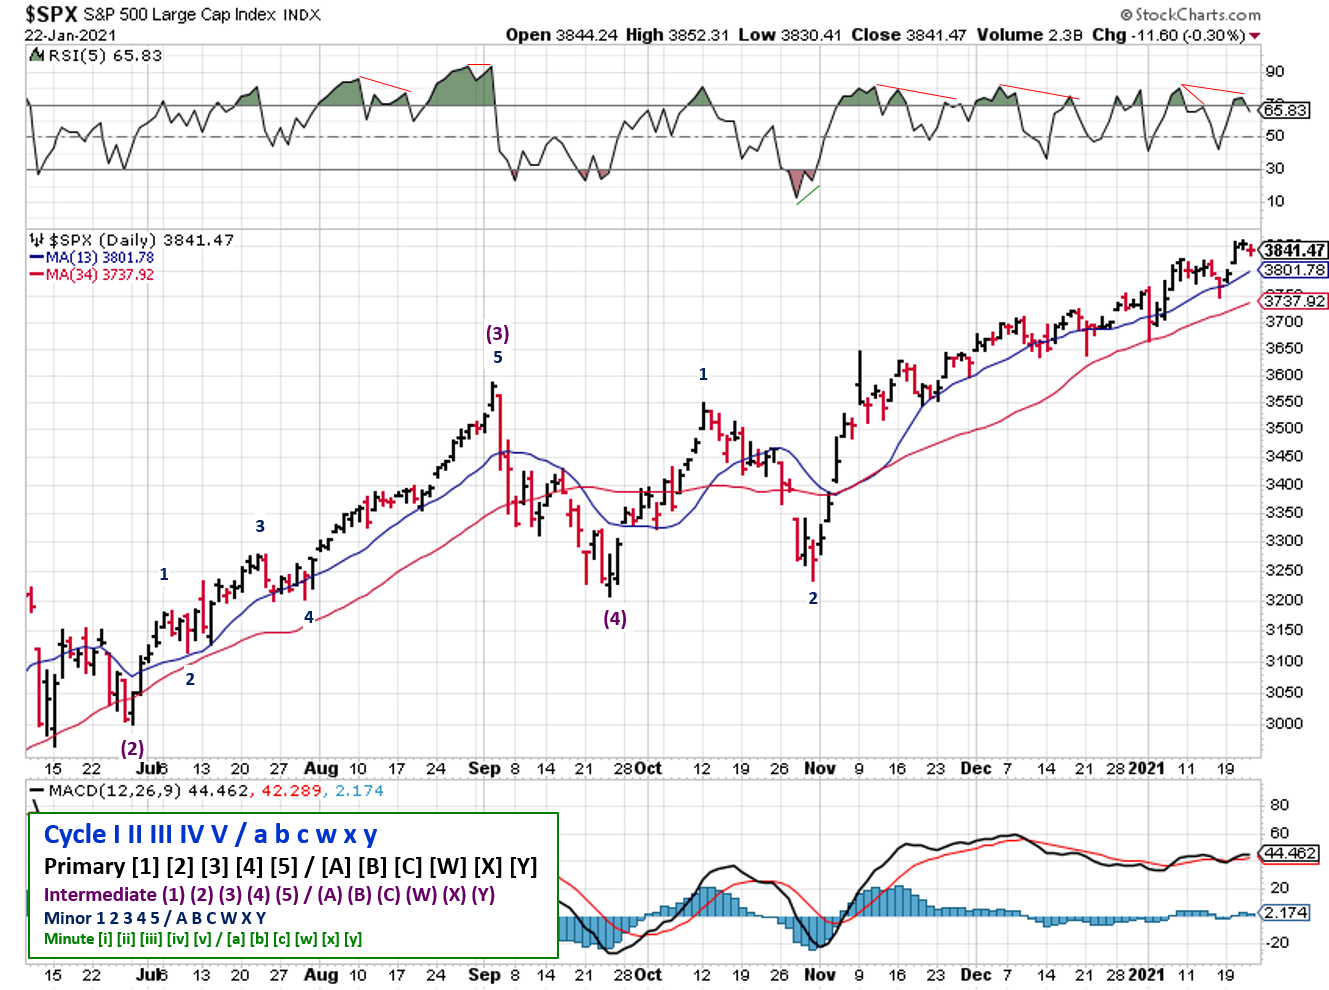
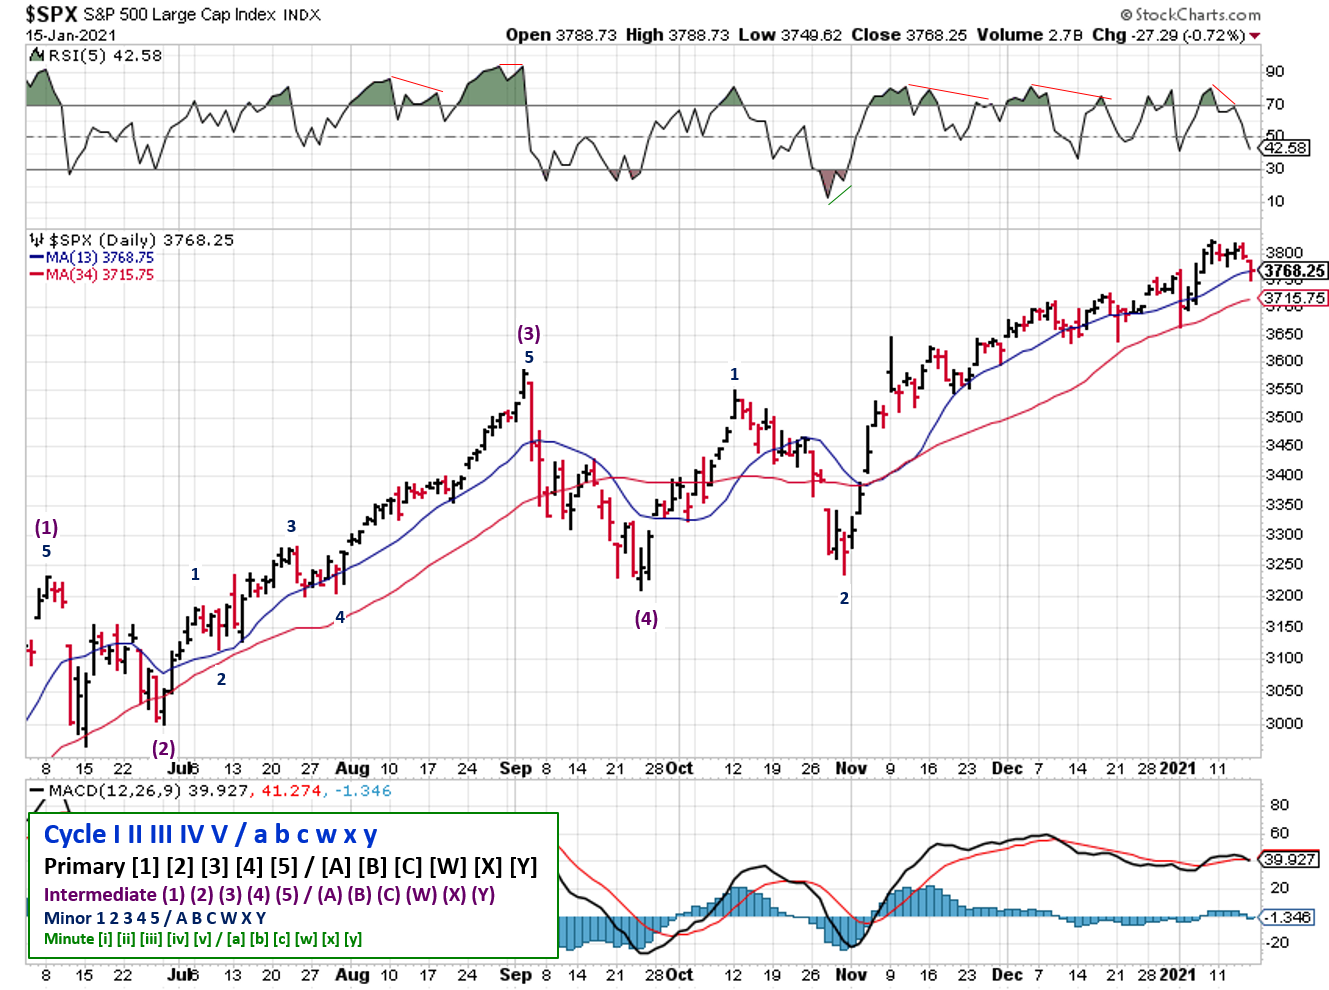
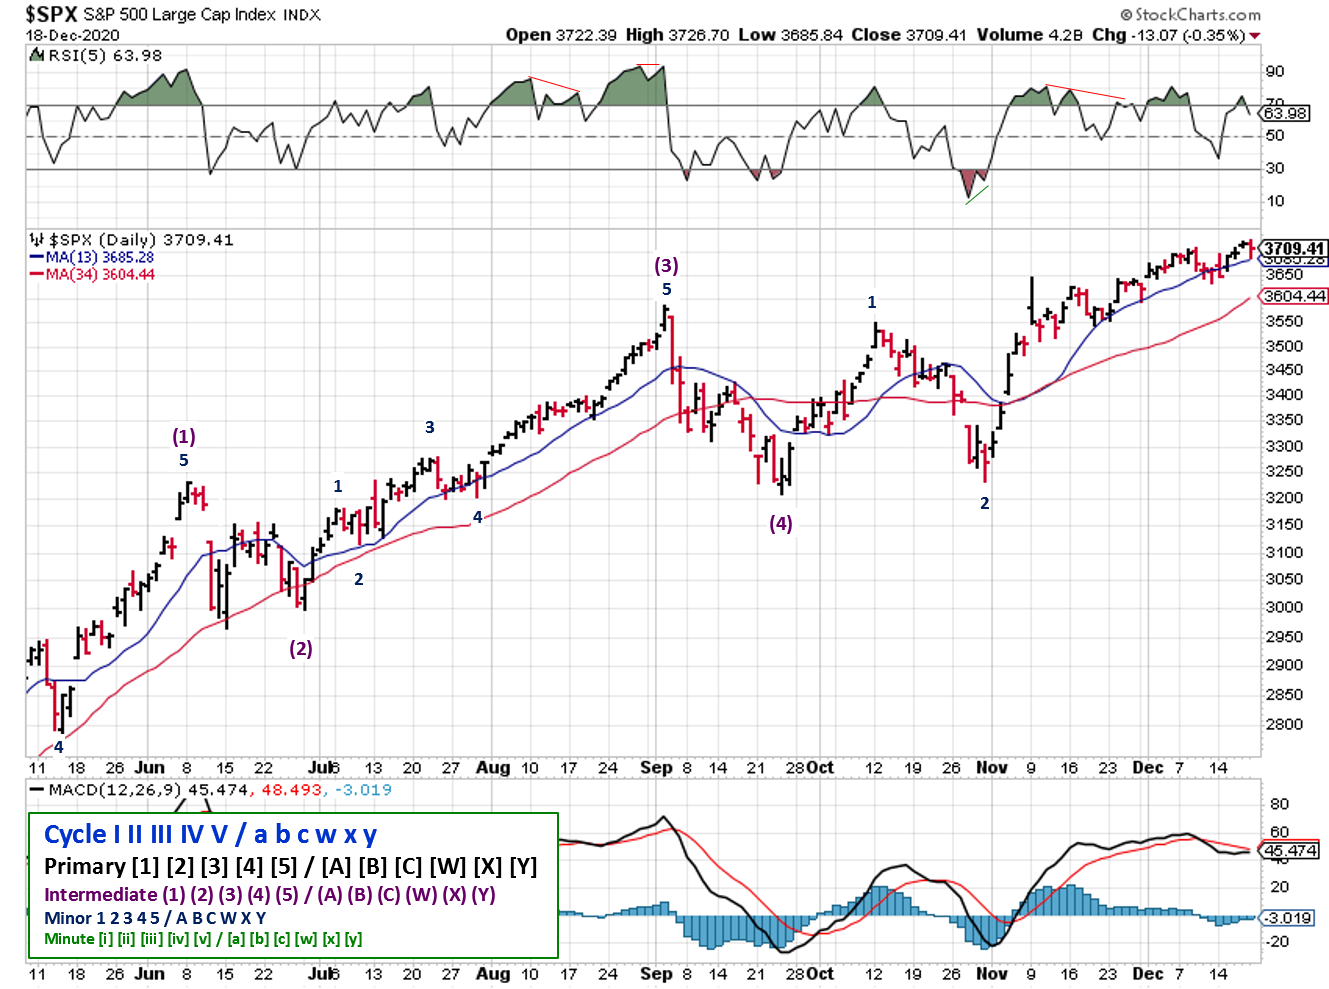
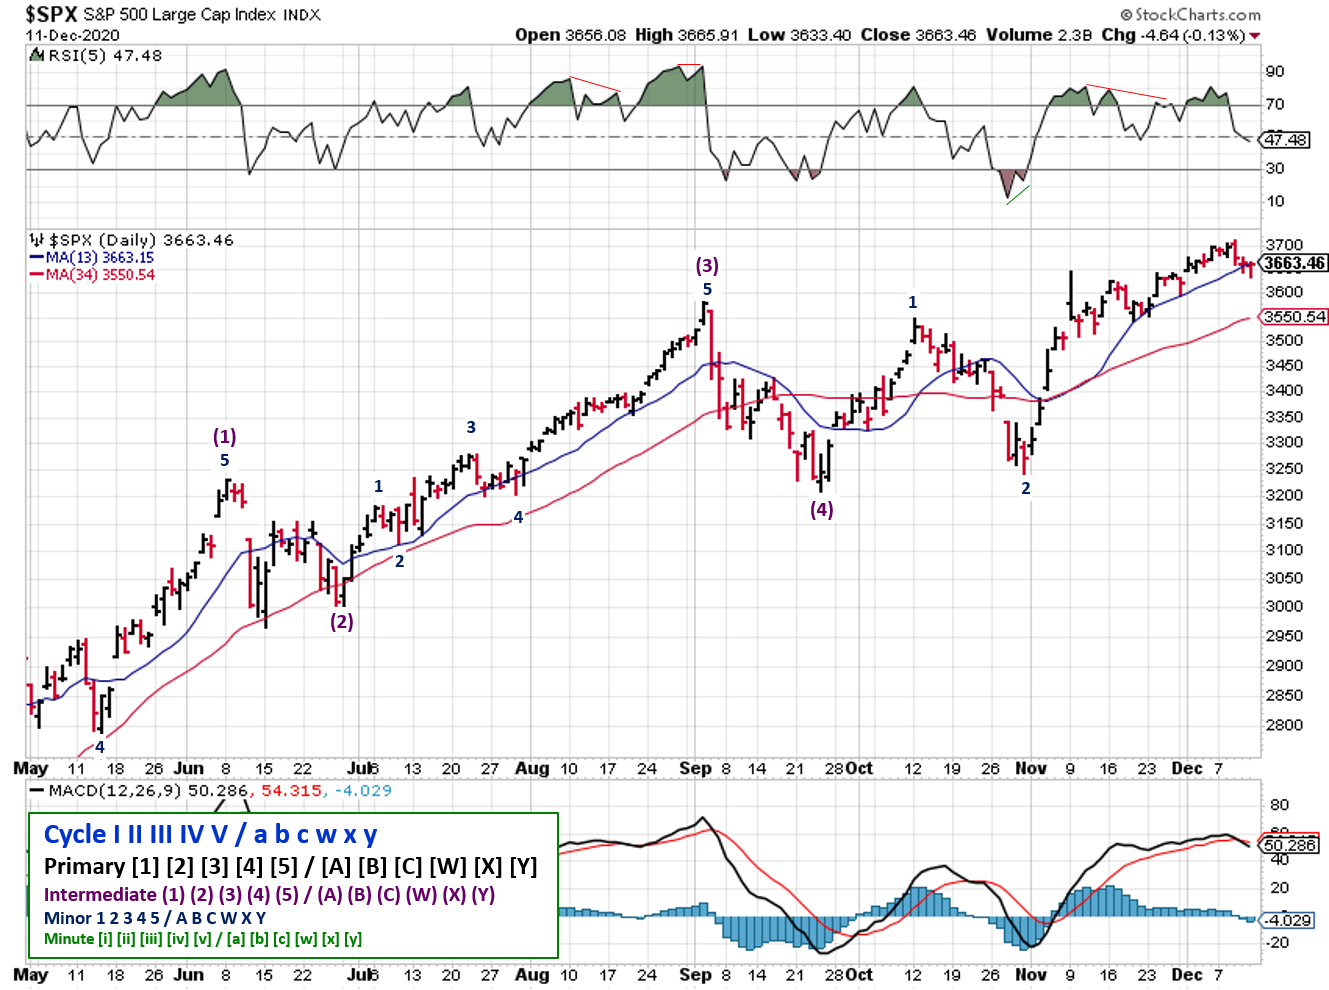
2021-01-24-SPX Elliott Wave Analysis-Daily-Primary1
Elliott Wave remains in an uptrend; the next correction likely takes the S&P back to the 3550-3600 support levels. By the time that happens, I’d guess the support trendline and the 200-day moving average will be near that level as well.
COMMENTARY
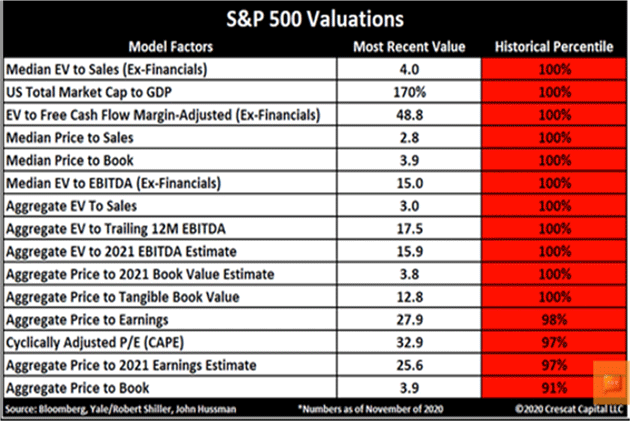
Another week, another round of quarterly earnings reports; a little over 20% of the S&P500 to be inexact. Good or bad, market prices are at historical extremes. Check out this chart from John Mauldin, courtesy of Doug Kass:
 https://ggc-mauldin-images.s3.amazonaws.com/uploads/newsletters/Image_5_20210122_TFTF.png
That’s not to say prices can’t go higher…just that the hamburgers are expensive, to reference a Buffett euphemism. For me, it means great trading opportunities are ahead, but relatively poor investing opportunities. Be ruthless when pruning your money tree; now is definitely NOT the time to be in love with your holdings (not that there is ever a good time for that).
Best to Your Week!