Stock Market Outlook entering the Week of October 19th = Uptrend
- Average Directional Index: Downtrend
- Institutional Activity: Uptrend
- On-Balance Volume: Uptrend
ANALYSIS
The stock market outlook continues to show an uptrend for U.S. equities.
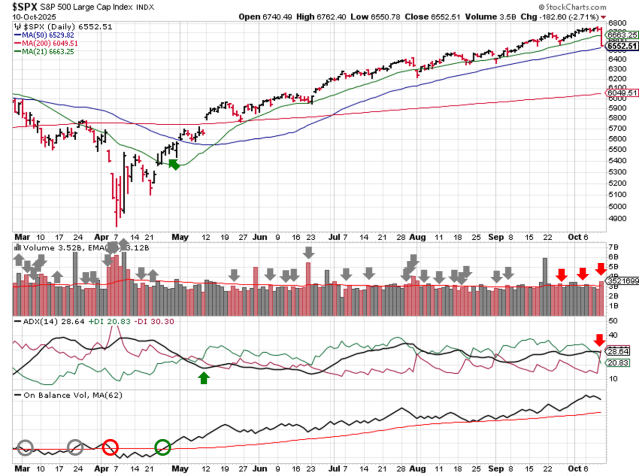
The S&P500 ( $SPX ) rose 1.7% last week. The index sits less than 2% above the 50-day moving average and ~10% above the 200-day moving average.
No change in the indicators from last week. The index added another distribution day, bringing the total 4; 5 or more is considered elevated.
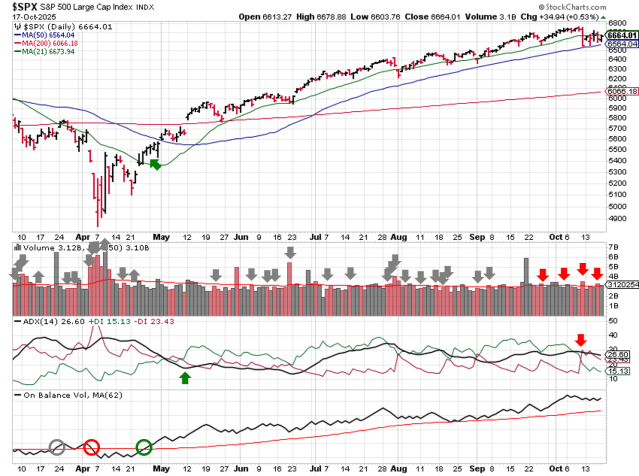
SPX Price & Volume Chart for Oct 19 2025
PERFORMANCE COMPARISONS
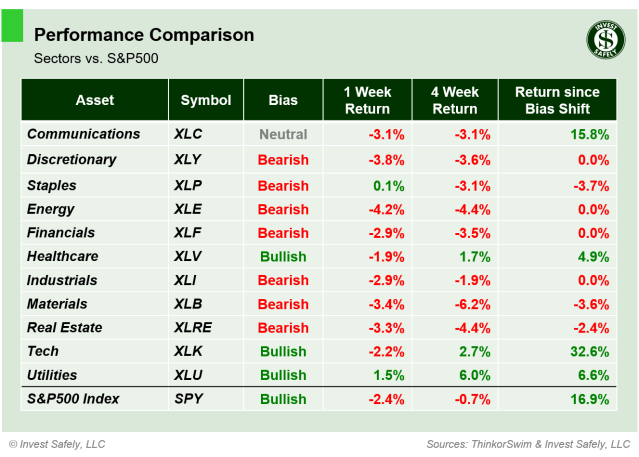
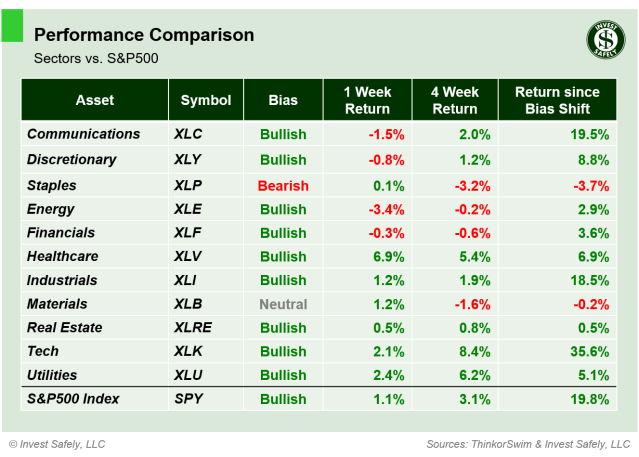
Real Estate ( $XLRE ) led sectors higher, while Financials ( $XLF ) underperformed; more on that sector in the commentary. Communications, Consumer Discretionary, and Real Estate ( $XLC, $XLY, $XLRE ) recovered to Bullish bias; Industrials ( $XLI ) eased back to Neutral.
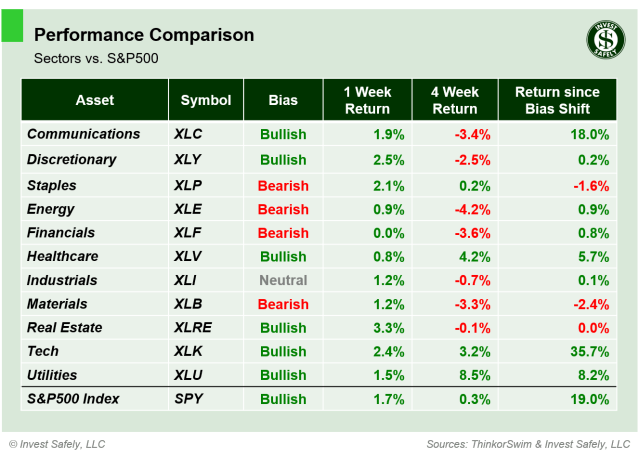
S&P Sector Performance from Week 42 of 2025
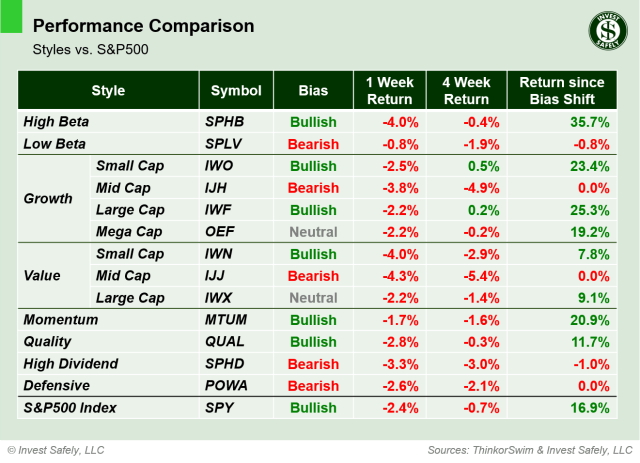
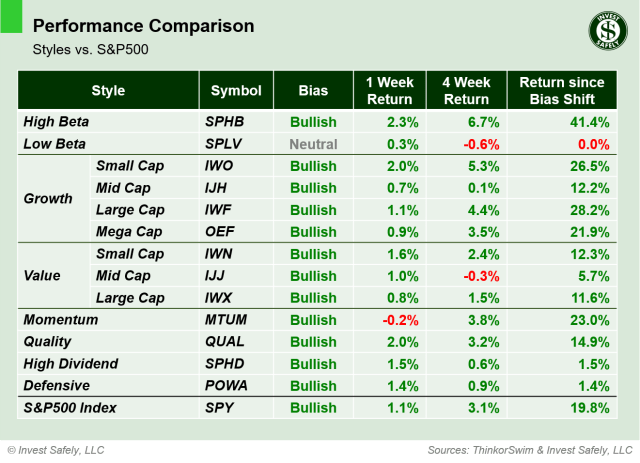
Reversing from the prior week, all sector styles registered a gain; High Beta ( $SPHB ) outperformed, Low Beta underperformed ( $SPLV ). Mega Cap Growth and Large Cap Value ( $OEF, $IWX, $POWA ) moved to Bullish bias; Mid Cap Growth and Value, ( $IJH, $IJJ ) eased back to Neutral bias.
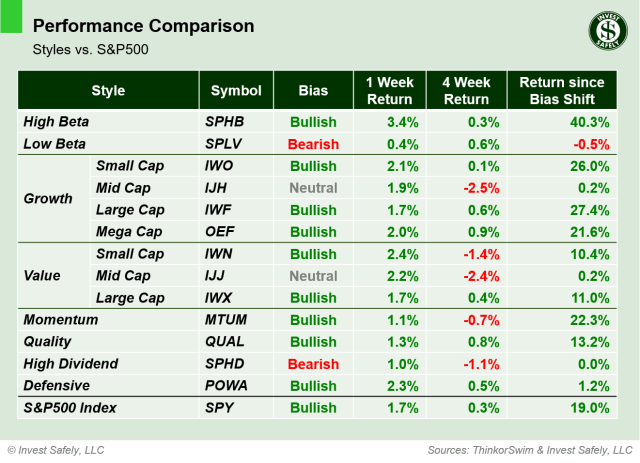
Sector Style Performance from Week 42 of 2025
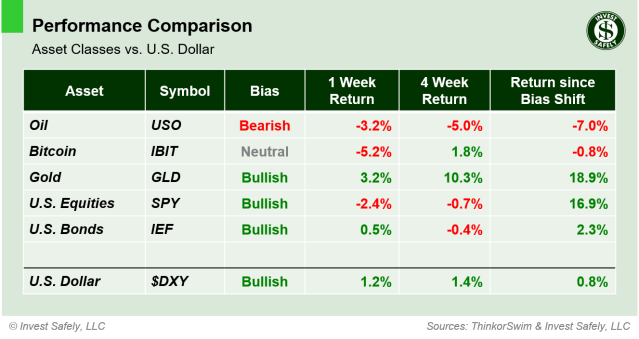
Gold outperformed all assets last week, despite the dip on Friday. Bitcoin ( $IBIT ) sold off again, and fell to Bearish bias. The U.S. Dollar moved back to Neutral bias.
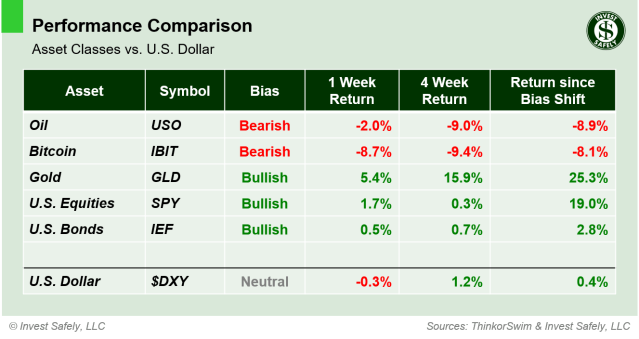
Asset Class Performance from Week 42 2025
COMMENTARY
Price and volume didn’t give many clues to the markets next move. The S&P500 spent the week consolidating the October 10th sell-off; no quick recovery, but no further sell-off. Volatility ( $VIX ) eased towards 20 on Friday, but made higher lows all week. The U.S. dollar faded towards oversold, but remains bullish.
Fraud allegations led to a sell off across the banking sector, on fears of broader commercial credit risks. Two regional banks revealed multi-million dollar losses tied to suspected loan fraud by borrowers. These disclosures follow bankruptcies by an auto parts supplier ( First Brands ) and car dealership ( Tricolor ), after these two borrowers engaging in off-balance-sheet debt and subprime loans to undocumented and no credit borrowers, respectively. Despite the boilerplate responses ( financial system is sound, credit quality is strong ), keep an eye out for more “cockroaches”, as Jamie Dimon put it.
With Gold up 25% since turning bullish, and last week’s move looking a bit parabolic, taking some profit is a good idea. The same goes for other sectors and styles with returns in the double digits (*cough* High Beta *cough*).
This week September CPI will be released, despite the government shutdown, since the Social Security Administration needs third-quarter CPI data for annual cost-of-living adjustments.
Best to Your Week!
P.S. If you find this research helpful, please tell a friend.
If you don’t, tell an enemy.