Stock Market Outlook – March 15 2026

Stock Market Outlook: March 15th = Downtrend

The stock market outlook enters week 6 of the current downtrend, as volatility continues to rise.

Oil, Energy and Momentum outperformed; Gold, Consumer Discretionary, Materials, and High Dividends underperformed.  Inflation data was mixed ahead of this week’s FOMC decision.

Read the full analysis, including charts and market commentary, at Invest-Safely.com: Stock Market Outlook – Week of March 15 2026

Best to Your Week!

P.S. If you find this research helpful, please tell a friend.
If you don’t, tell an enemy.


Posted in Historical Data, Market Trends | Tagged , , , | Comments Off on Stock Market Outlook – March 15 2026

Stock Market Outlook – March 08 2026

Stock Market Outlook: March 8th = Downtrend

The stock market outlook remains in a downtrend, as markets reprice the impact of international conflict.

Oil and Energy outperformed; Emerging Markets, Industrials, and Value Styles underperformed.  Volatility ramped across asset classes and NFP data surprised to the downside.

Read the full analysis, including charts and market commentary, at Invest-Safely.com: Stock Market Outlook – Week of March 08 2026

Best to Your Week!

P.S. If you find this research helpful, please tell a friend.
If you don’t, tell an enemy.


Posted in Historical Data, Market Trends | Tagged , , , | Comments Off on Stock Market Outlook – March 08 2026

Stock Market Outlook – March 01 2026

Stock Market Outlook: March 1st =Downtrend

The stock market outlook remains in a downtrend, with geopolitical risks primed to inject volatility into financial assets.

Gold, Utilities, and Low Beta outperformed; Crypto, Financials, and Value underperformed.  Producer prices came in higher than expected, which will sharpen the focus on this week’s employment data.

Read the full analysis, including charts and market commentary, at Invest-Safely.com: Stock Market Outlook – Week of March 01 2026

Best to Your Week!

P.S. If you find this research helpful, please tell a friend.
If you don’t, tell an enemy.


Posted in Historical Data, Market Trends | Tagged , , , | Comments Off on Stock Market Outlook – March 01 2026

Stock Market Outlook – February 22 2026

Stock Market Outlook: February 22th = Downtrend

The stock market outlook remains in a downtrend, though price has risen back to retest key levels.

Oil, Materials & Utilities, and High Beta outperformed; Consumer Staples lagged.  PCE was higher than expected, while Q4 GDP came in low due to the government shutdown.


TREND ANALYSIS

The S&P500 ( $SPX ) rose 1.1% last week, as price traded back to key levels:

  • At the 50-day moving average
  • ~6% above the 200-day moving average

The index bounced after sweeping the lows near 6800, but was unable to clear the 21 and 50 day moving averages with any conviction.
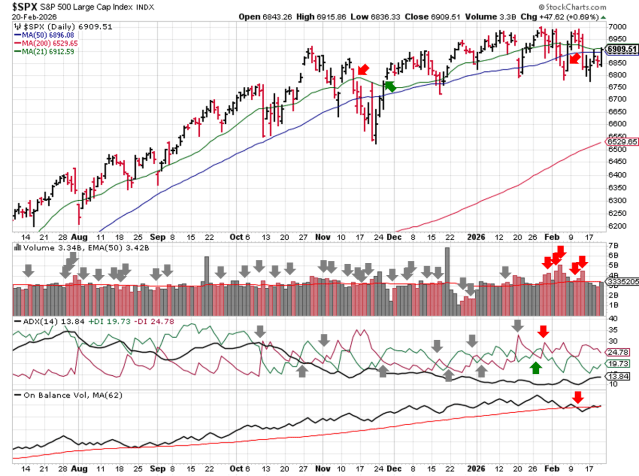
Technical analysis chart of $SPX showing 6 months of candlesticks with 21-day, 50-day, and 200-day moving averages, volume with EMA(50), ADX(14) with +DI and -DI, and OBV with MA(62) through 2026-02-22

SPX Price & Volume Chart – 2026-02-22


PERFORMANCE HIGHLIGHTS & COMPARISONS

S&P500 Sectors

Materials ( $XLB ) outperformed, closely following by Utilities ( $XLU ).  Consumer Staples ( $XLP ) underperformed.  Communications ( $XLC ) clawed its way back to neutral.
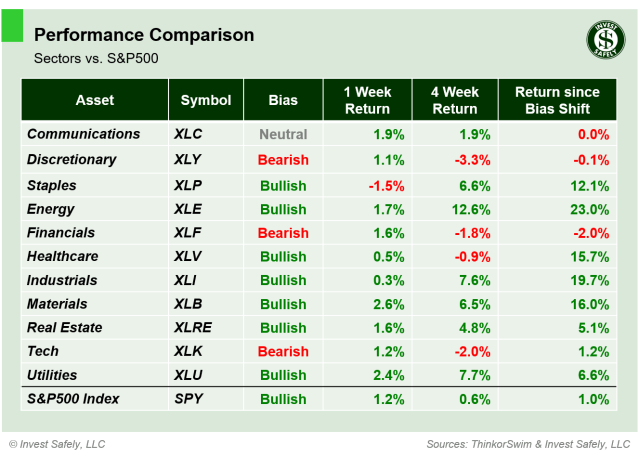
Performance comparison table of S&P500 sector ETFs ($XLC, $XLY, $XLP, $XLE, $XLF, $XLV, $XLI, $XLB, $XLRE, $XLK, $XLU, $SPY) showing 1-week, 4-week, and bias-shift returns

S&P Sector Performance – 2026-02-22

S&P500 Investing Styles

All investing styles ended the week in positive territory.  High Beta ( $SPHB ) led the way and Mega Cap Growth, High Dividend, and Defensives ( $OWF, $SPHD, $POWA ) brought up the rear.  Momentum ( $MTUM ) reclaimed a bullish bias.
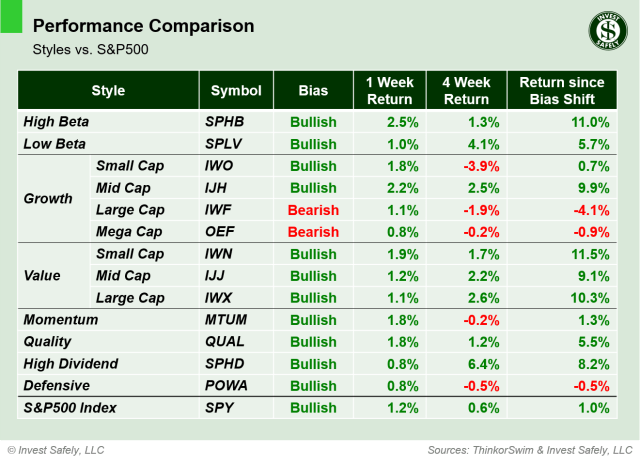
Performance comparison table of investment style ETFs ($SPHB, $SPLV, $IWO, $IJH, $IWF, $OEF, $IWN, $IJJ, $IWX, $MTUM, $QUAL, $SPHD, $POWA, $SPY) showing 1-week, 4-week, and bias-shift returns

Sector Style Performance – 2026-02-22

Asset Classes

All asset classes gained ground last week, with Oil ( $USO ) gaining almost 6% and U.S. Bonds adding 0.1%.  The U.S. Dollar ( $DXY ) strengthened to neutral bias after several weeks in bearish territory.
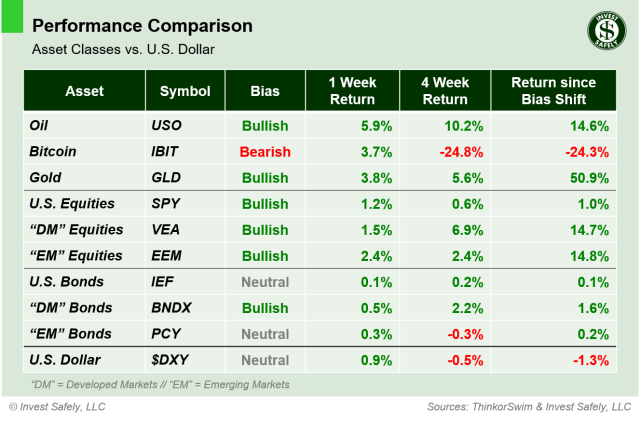
Weekly performance comparison of major asset class ETFs ($USO, $IBIT, $GLD, $SPY, $VEA, $EEM, $IEF, $BNDX, $PCY, $DXY) including 1-week, 4-week, and bias-shift returns relative to the U.S. Dollar

Sector Style Performance – 2026-02-22


COMMENTARY

Markets

Selling pressure took a breather last week; almost the entire dashboard registering a gain.  Defensive positioning remains in control, although Consumer staples experienced some profit taking.

The Volatility Index ( $VIX ) spent another week testing the “chop zone” (a reading from 20 to 30), supporting the risk-off signals provided by price and volume.

Macroeconomic Data & Policy

New orders for durable goods fell 1.4% in January, which was a bit less than expected.

Headline PCE Price Index rose 2.9% YoY, up from 2.8% in November and driven by the cost of services. Core PCE rose 3.0% YoY, versus 2.8% in November.

Real GDP grew 1.4% in Q4 2025, a sharp slowdown from 4.4% in Q3 and lower than 1.9% in 2024 Q4. Government spending contracted ~5% due to the fall 2025 shutdown, bringing down the overall figure by almost 1%.

FOMC minutes showed a hawkish pause in place,, with most members wanting to hold rates steady until inflation shows further improvement.

The Supreme Court ruled 6–3 that President Trump’s tariff program exceeded presidential authority under the International Emergency Economic Powers Act (IEEPA).  Within hours of the ruling, the Trump administration announced a new, 10% global tariff, citing authority under the Trade Act of 1974 instead of the IEEPA.

Geopolitics

The U.S. continues to build up military assets in the Middle East. Earlier in the week, there was some hope for an agreement as talks in Geneva resulted in some “guiding principles”. But the two sides remain far apart, per sources (Reuters.com: US and Iran slide towards conflict as military build-up eclipses talks).


EYES ON THE HORIZON

Several Fed members speak next week; PPI comes out Friday

  • Monday: —
  • Tuesday: 7 Fed Speeches
  • Wednesday: —
  • Thursday: —
  • Friday: PPI

Best to Your Week!

P.S. If you find this research helpful, please tell a friend.
If you don’t, tell an enemy.


Content Sources:
Bloomberg, CNBC, Federal Reserve Bank of St. Louis (FRED), Hedgeye, StockCharts.com,
TradingEconomics.com, U.S. Bureau of Economic Analysis, U.S. Bureau of Labor Statistics.

Performance Methodology:
All sector performance data is sourced from ThinkorSwim and reflects price‑only returns
calculated using end‑of‑week closing data. Bias classifications follow a proprietary
Invest Safely, LLC model and update only when trend conditions meet predefined thresholds.
All calculations are consistent across every chart on this page.

Disclaimer:
Invest Safely, LLC is an independent investment research and online financial media company.
Use of Invest Safely, LLC and any products available through Invest‑Safely.com is subject to
our Terms of Service and Privacy Policy.
Not a recommendation to buy or sell any security.

Posted in Historical Data, Market Trends | Tagged , , , | Comments Off on Stock Market Outlook – February 22 2026

Stock Market Outlook – February 15 2026

Stock Market Outlook: February 15th =
Downtrend

The stock market outlook remains in a downtrend after institutional selling sent price below key levels again.

Non-U.S. Developed Markets, Utilities, and and High Dividends outperformed; Bitcoin, Financials, and Mega-Cap Growth lagged.  Non-farm payrolls were stronger than expected and inflation eased slightly.


Read the full analysis, charts and market commentary at Invest-Safely.com:
Stock Market Outlook – Week of Feb 15 2026


Disclaimer:
Invest Safely, LLC is an independent investment research and online financial media company.
Use of Invest Safely, LLC and any products available through Invest‑Safely.com is subject to
our Terms of Service and Privacy Policy.
Not a recommendation to buy or sell any security.

Posted in Market Trends | Tagged , | Comments Off on Stock Market Outlook – February 15 2026

Stock Market Outlook – February 8 2026

Stock Market Outlook: February 8th = Downtrend

The stock market outlook shifted to a downtrend on Thursday, but may bullish biases remain intact.  A continuation from Friday’s reversal will make the change short lived.

Gold, Consumer Staples, and Mid-Cap Value outperformed; Oil/bitcoin, Communications, and Large-Cap growth lagged. Macro data was mixed, and non-farm payroll data was delayed until this week, joining retail sales, and CPI.


TREND ANALYSIS

The S&P500 ( $SPX ) fell 0.1% last week, as price traded to and through key levels:

  • ~1% above the 50-day moving average
  • ~7% above the 200-day moving average

Last week’s volatility whipped around the technical indicators; 2 of 3 were bearish as of Thursday’s close, moving the outlook to a downtrend.  Institutional activity recovered Friday; one more signal change is needed.

  • Average Directional Index: Bearish
    • ADX direction indicators remained bearish all week
  • Institutional Activity: Bullish
    • Price broke the 50 dma on elevated trading volume Thursday, moving the signal to bearish and shifting the outlook.
    • Price recovered bullishly Friday morning, flipping the indicator back to bullish.
  • On-Balance Volume: Neutral
    • On-balance volume moved to neutral on Tuesday, testing it’s trendline for the first time since August
Technical analysis chart of $SPX showing 6 months of candlesticks with 21-day, 50-day, and 200-day moving averages, volume with EMA(50), ADX(14) with +DI and -DI, and OBV with MA(62) through 2026-02-08

SPX Price & Volume Chart – 2026-02-08


PERFORMANCE HIGHLIGHTS & COMPARISONS

S&P500 Sectors

Consumer Staples ( $XLP ) outperformed, though several sectors kept pace.  Communications ( $XLC ) underperformed.  Consumer Discretionary and Technology ( $XLY, $XLK ) fell to bearish bias.  Communications and Utilities ( $XLC, $XLU ) moved to neutral, and Financials ( $XLF ) moved back up to bullish.

Performance comparison table of S&P500 sector ETFs ($XLC, $XLY, $XLP, $XLE, $XLF, $XLV, $XLI, $XLB, $XLRE, $XLK, $XLU, $SPY) showing 1-week, 4-week, and bias-shift returns

S&P Sector Performance – 2026-02-08

S&P500 Investing Styles

Mid-cap growth ( $IJH ) led upside performance, and Large Cap Growth ( $IWF ) was the worst style. Last week’s bias changes reversed:  Mega Cap Growth ( $OEF ) returned to neutral bias, and Defensives ( $POWA ) to bullish.

Performance comparison table of investment style ETFs ($SPHB, $SPLV, $IWO, $IJH, $IWF, $OEF, $IWN, $IJJ, $IWX, $MTUM, $QUAL, $SPHD, $POWA, $SPY) showing 1-week, 4-week, and bias-shift returns

Sector Style Performance – 2026-02-08

Asset Classes

Gold ( $GLD ) led asset class returns. Oil reversed course from last week’s gains, but Bitcoin ( $IBIT ) was the biggest loser again.  DM bonds ( $BNDX ) moved up to neutral bias, and EM bonds ( $PCY ) retreated to neutral.

Weekly performance comparison of major asset class ETFs ($USO, $IBIT, $GLD, $SPY, $VEA, $EEM, $IEF, $BNDX, $PCY, $DXY) including 1-week, 4-week, and bias-shift returns relative to the U.S. Dollar

Asset Class Performance – 2026-02-08


COMMENTARY

Markets

Institutions were selling, but selectively.  Index prices fell below key levels, then recovered.  The S&P500 trend indicators flipped to bearish, but the $SPY bias is back to bullish.  Some names broke out, some broke down.  Talk about mixed messages.

  • Traders sold large cap growth ( $IWF ) and technology stocks ( $XLC, $XLY, $XLK ).
  • Traders bought Staples, Energy, Industrials, Materials ( $XLP, $XLE, $XLI, $XLB ) and value stocks ( $IWN, $IJJ, $IWX ).

Tech companies are the largest weights in general indexes, like the S&P500 and the Nasdaq 100, so their capital flows have an oversized impact on index price movement.  Check out the equal weight version of the S&P500 ( $RSP ): price broke out to new highs on Friday!

Price chart of $RSP showing 2 months of candlesticks with 20-day and 50-day moving averages and volume through 2026-02-08

$RSP Price & Volume Chart – 2026-02-08

I’d say the market is mixed, the goal of these weekly exercises is preserving capital and reducing losses, so erring on the side of caution is the correct course of action.  There is always another trade, but you have to have capital to participate.

Macroeconomic Data & Policy

January ISM Manufacturing PMI improved to 52.6%, representing the first expansion in 12 months. ISM Services PMI remained steady at 53.8%.

Job openings (JOLTs) fell year over year, signaling softer labor demand.  And consumer sentiment was better than expected, but well below last year’s levels.

Non-farm payrolls were delayed a week due to the government shutdown.

Geopolitics

According to a U.S. trade representative, the U.S. is developing plans with Mexico, the European Union and Japan to implement minimum prices for critical, rare-earth minerals, triggering a sell-off in the sector.

The partial U.S. government shutdown ended last week.


EYES ON THE HORIZON

This week brings several important data releases:

  • Monday: —
  • Tuesday: Retail Sales
  • Wednesday: Rescheduled NFP
  • Thursday: Existing Home Sales
  • Friday: CPI

Best to Your Week!

P.S. If you find this research helpful, please tell a friend.
If you don’t, tell an enemy.


Content Sources:
Bloomberg, CNBC, Federal Reserve Bank of St. Louis (FRED), Hedgeye, StockCharts.com,
TradingEconomics.com, U.S. Bureau of Economic Analysis, U.S. Bureau of Labor Statistics.

Performance Methodology:
All sector performance data is sourced from ThinkorSwim and reflects price‑only returns
calculated using end‑of‑week closing data. Bias classifications follow a proprietary
Invest Safely, LLC model and update only when trend conditions meet predefined thresholds.
All calculations are consistent across every chart on this page.

Disclaimer:
Invest Safely, LLC is an independent investment research and online financial media company.
Use of Invest Safely, LLC and any products available through Invest‑Safely.com is subject to
our Terms of Service and Privacy Policy.
Not a recommendation to buy or sell any security.

Posted in Historical Data, Market Trends | Tagged , , , | Comments Off on Stock Market Outlook – February 8 2026

Stock Market Outlook – February 1 2026

Stock Market Outlook: February 1st = Uptrend

The stock market outlook continues to show an uptrend in place for the S&P500, indicated by bullish designations for 2 of 3 technical indicators.

Oil, Energy, and High Dividend payers outperformed, metals / crypto crashed, reaction to earnings was mixed, and the FOMC held rates steady.  A partial government shutdown, ISM survey results and jobs data will shape the week ahead.


TREND ANALYSIS

The S&P500 ( $SPX ) rose 0.3% last week, continuing to trade above key levels:

  • ~1% above the 50-day moving average
  • ~8% above the 200-day moving average

Despite the volatile price action, indicators start the week unchanged:

  • Average Directional Index: Bearish
    • ADX direction indicators flipped to bearish during the week, but reversed on Thursday
  • Institutional Activity: Bullish
    • Selling volume increased last week, but only triggered one distribution day and price remains above the 50 dma, keeping a bullish trend in place
  • On-Balance Volume: Bullish
    • On-balance volume remains above its trendline
Technical analysis chart of $SPX showing 6 months of candlesticks with 21-day, 50-day, and 200-day moving averages, volume with EMA(50), ADX(14) with +DI and -DI, and OBV with MA(62) through 2026-02-01.

SPX Price & Volume Chart for 2026-02-01


PERFORMANCE HIGHLIGHTS & COMPARISONS

S&P500 Sectors

Energy ( $XLE ) outperformed for the second consecutive week; Healthcare ( $XLV ) underperformed.  Technology ( $XLK ) eased back to neutral after a slew of Mag  7 earnings, while Financials ( $XLF ) regained neutral bias.

Performance comparison of S&P500 sector ETFs ($XLC, $XLY, $XLP, $XLE, $XLF, $XLV, $XLI, $XLB, $XLRE, $XLK, $XLU, $SPY) showing 1-week, 4-week, and bias-shift returns.

S&P Sector Performance – 2026-02-01

S&P500 Investing Styles

High Dividend ( $SPHD ) led upside performance, which hasn’t happened in a long time.  But it was Small Cap Growth falling 3% that really stood out within sector styles.  Mega Cap Growth ( $OEF ) returned to bullish bias, and Defensives ( $POWA ) hit neutral.

Performance comparison of investment style ETFs ($SPHB, $SPLV, $IWO, $IJH, $IWF, $OEF, $IWN, $IJJ, $IWX, $MTUM, $QUAL, $SPHD, $POWA, $SPY) showing 1-week, 4-week, and bias-shift returns.

Sector Style Performance – 2026-02-01

Asset Classes

The moves in metals continue to dominate global headlines.  Oil ( $USO ) quietly led asset classes higher last week, gaining almost 8%.  Bitcoin ( $IBIT ) was the biggest loser, as the leverage continues to be unwound across the cryptocurrency space.  U.S. Bonds ( $IEF ) moved up to neutral bias, and EM bonds ( $PCY ) improved to bullish.

Weekly performance comparison of major asset class ETFs ($USO, $IBIT, $GLD, $SPY, $VEA, $EEM, $IEF, $BNDX, $PCY, $DXY) including 1-week, 4-week, and bias-shift returns relative to the U.S. Dollar.

Asset Class Performance vs. U.S. Dollar – 2026-02-01


COMMENTARY

Markets

The metals rally we discussed last weekend reversed violently on Thursday:  Silver futures collapsed from a high of $121.79 to a low of $74! That’s a 39% peak‑to‑trough unwind in less than 2 days. Platinum’s overall move was similar, but took a few more sessions.

Macroeconomic Data & Policy

Mega‑cap tech delivered generally good headline numbers, but weaker than expected guidance and/or margin compression caused a few names to sell off.

December PPI rose 3.0% year-on-year, unchanged from November but higher than expectations for 2.7%.  Increases in services prices drove the surprise upside.

The FOMC held rates steady and emphasized a data‑dependent path forward. On Friday, President Trump announced Kevin Warsh as his nominee to replace Powell as head of the Federal Reserve.  A lot of ink was spilled on what Mr. Warsh has said in the past, regarding Fed policy.  What he will do if/once he’s confirmed as Chairman is another matter.  The current expectation is a mix:  hawkish on the balance sheet ( reducing liquidity ) and dovish on interest rates ( potential cuts ).

Geopolitics

A partial U.S. government shutdown began over the weekend; a funding package passed the Senate late Friday, but still needs approval from the House of Representatives on Monday.


EYES ON THE HORIZON

This week brings several important data releases:

  • Monday: ISM Manufacturing PMI
  • Tuesday: December JOLTs Job Openings
  • Wednesday: ISM Services PMI
  • Thursday: —
  • Friday: Non Farm Payrolls & Michigan Consumer Sentiment

Best to Your Week!

P.S. If you find this research helpful, please tell a friend.
If you don’t, tell an enemy.


Content Sources:
Bloomberg, CNBC, Federal Reserve Bank of St. Louis (FRED), Hedgeye, StockCharts.com,
TradingEconomics.com, U.S. Bureau of Economic Analysis, U.S. Bureau of Labor Statistics.

Performance Methodology:
All sector performance data is sourced from ThinkorSwim and reflects price‑only returns
calculated using end‑of‑week closing data. Bias classifications follow a proprietary
Invest Safely, LLC model and update only when trend conditions meet predefined thresholds.
All calculations are consistent across every chart on this page.

Disclaimer:
Invest Safely, LLC is an independent investment research and online financial media company.
Use of Invest Safely, LLC and any products available through Invest‑Safely.com is subject to
our Terms of Service and Privacy Policy.
Not a recommendation to buy or sell any security.

Posted in Historical Data, Market Trends | Tagged , , , | Comments Off on Stock Market Outlook – February 1 2026