Stock Market Outlook: March 8th = Downtrend
The stock market outlook remains in a downtrend, as markets reprice the impact of international conflict.
Oil and Energy outperformed; Emerging Markets, Industrials, and Value Styles underperformed. Volatility ramped across asset classes and NFP data surprised to the downside.
TREND ANALYSIS
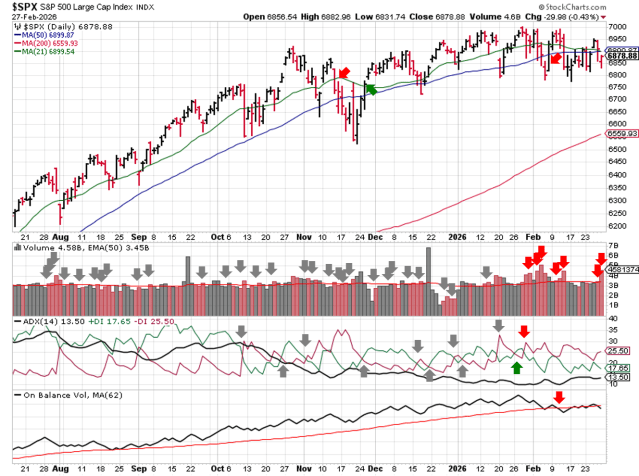
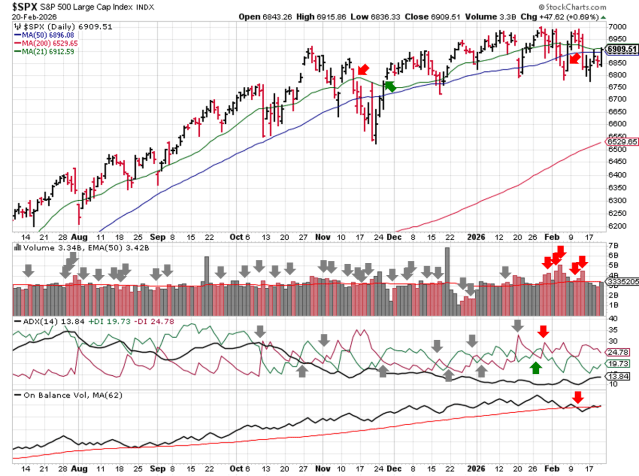
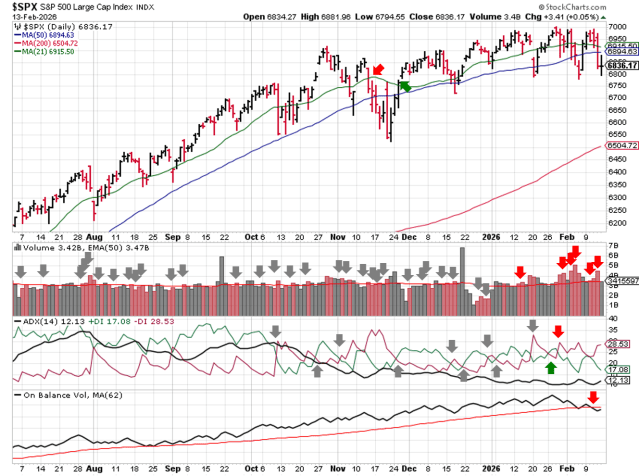
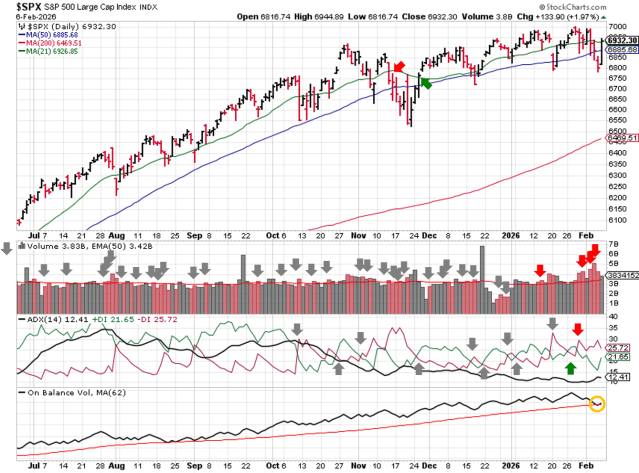
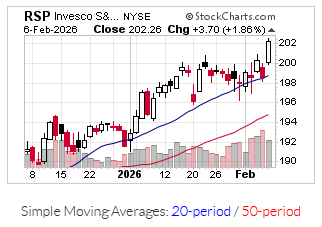
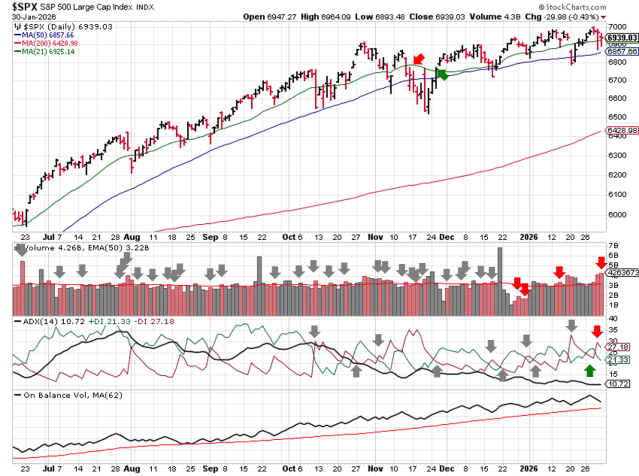
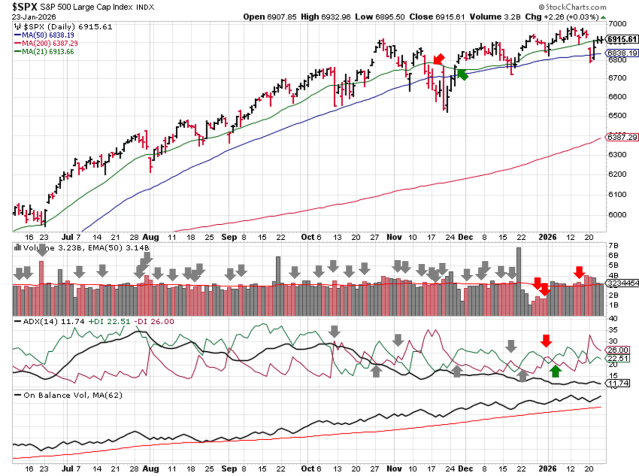
The S&P500 ( $SPX ) dropped 2% last week:
- ~2.5% below the 50-day moving average
- ~2.5% above the 200-day moving average
All 3 technical indicators continue to highlight price weakness:
- Average Directional Index: Bearish
- The base ADX number is on the rise, signaling a strengthening trend
- Institutional Activity: Bearish
- Price fell further below the 50-day moving average
- On-Balance Volume: Bearish
- Remains below the long-term average
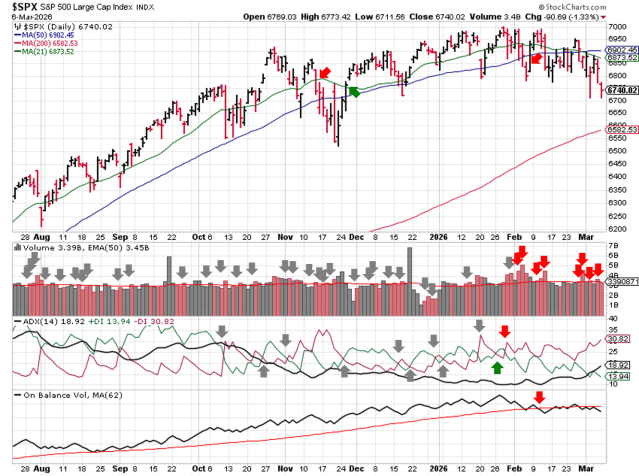
SPX Price & Volume Chart – 2026-03-08
PERFORMANCE HIGHLIGHTS & COMPARISONS
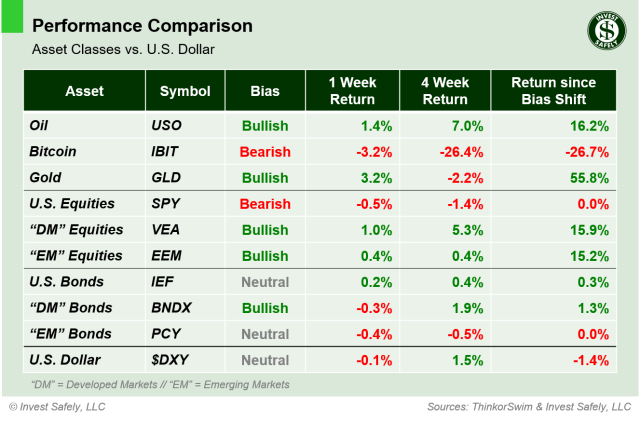
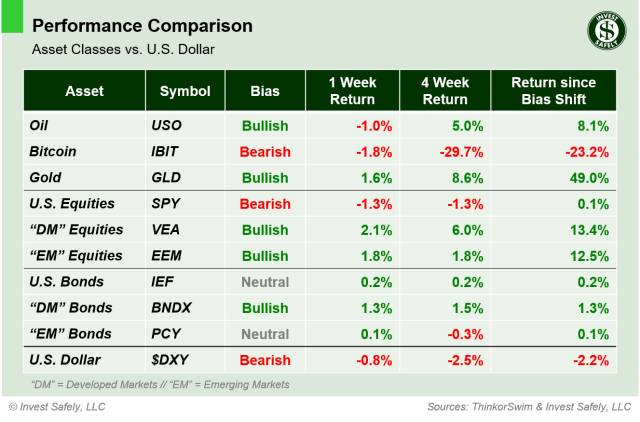
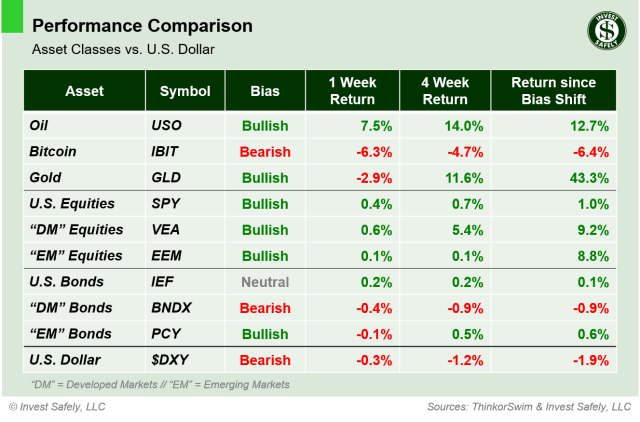
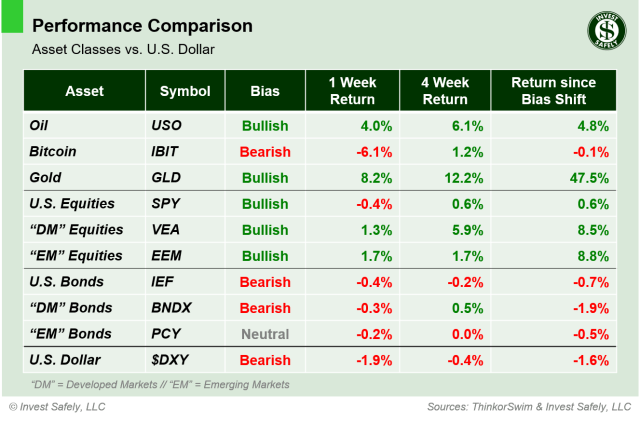
Asset Classes
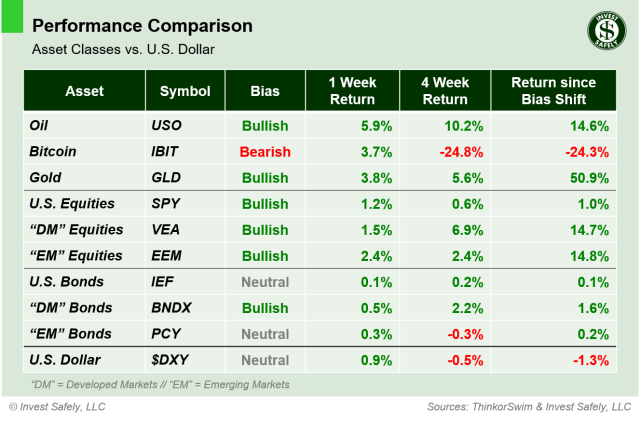
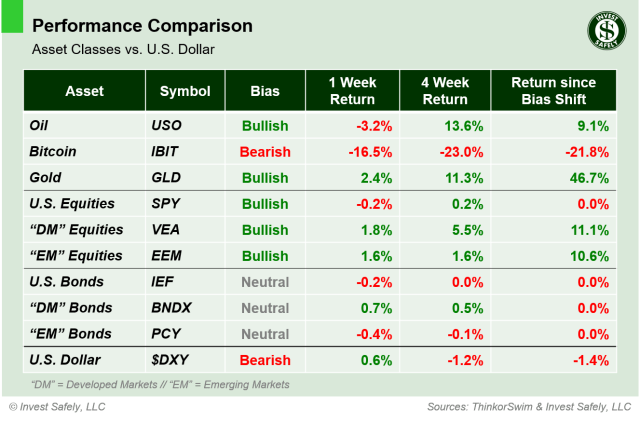
Oil ( $USO ) rocketed higher last week, gaining ~33%. Yes, you read that right…not a typo. Emerging Market Equities ( $EEM ) led to the downside, losing more than 8%. Emerging Market Equities and Bonds ( $EEM, $PCY ) moved to bearish bias, Development Market Equities ( $VEA ) to Neutral, and the U.S. dollar ( $DXY ) to bullish.
Asset Class Performance – 2026-03-08
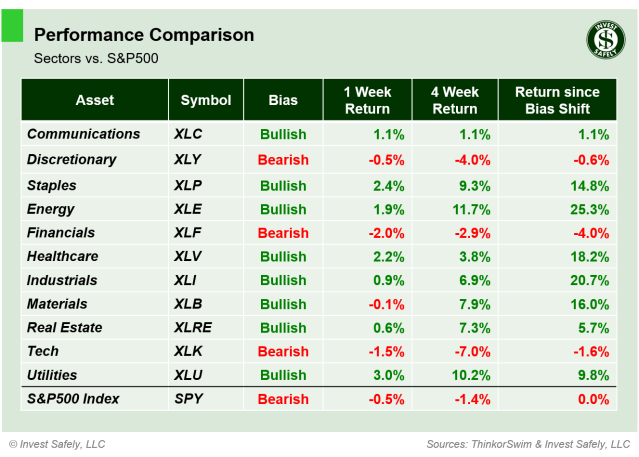
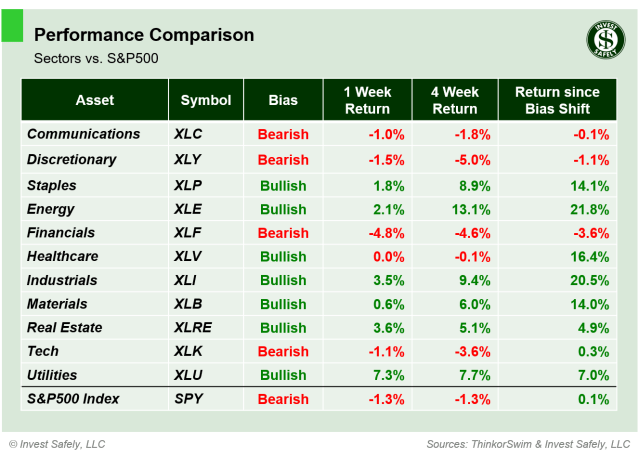
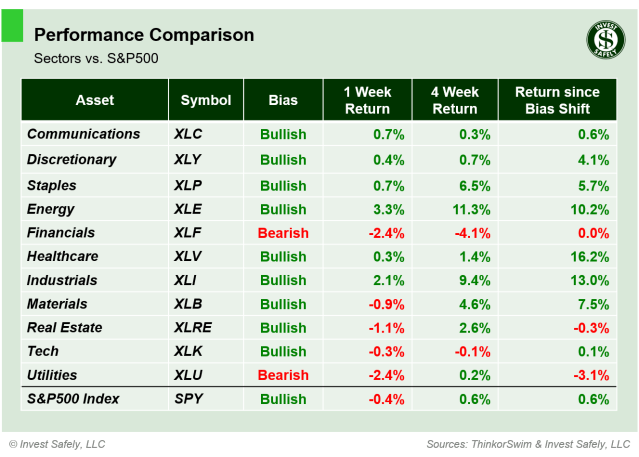
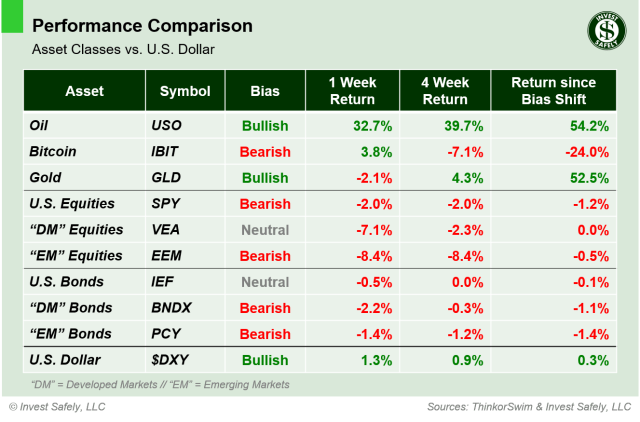
S&P500 Sectors
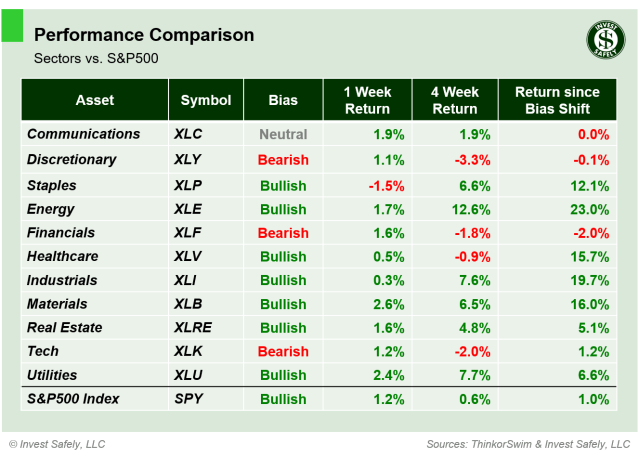
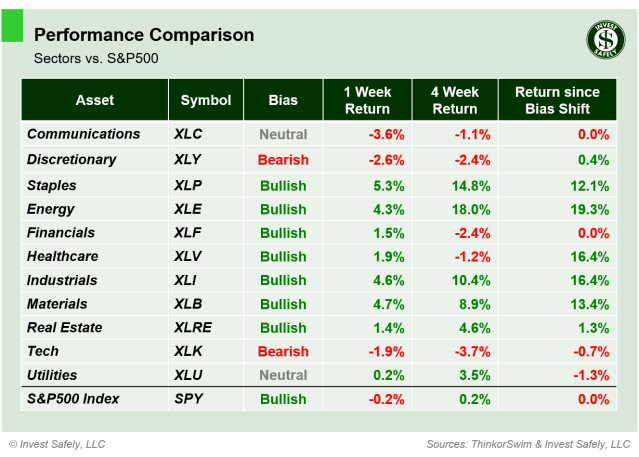
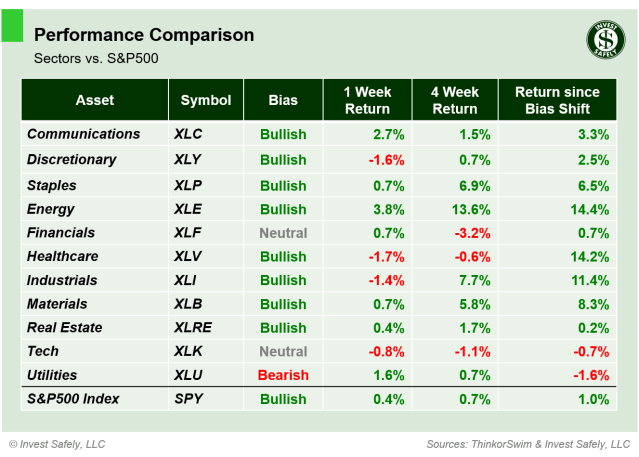
Energy ( $XLE ) was the lone gainer; Industrials ( $XLI ) led to the downside. Healthcare ( $XLV ) moved to bearish, Industrials to neutral.
S&P Sector Performance – 2026-03-08
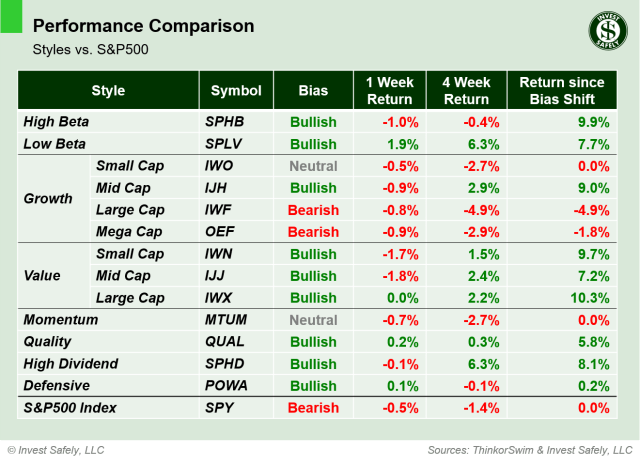
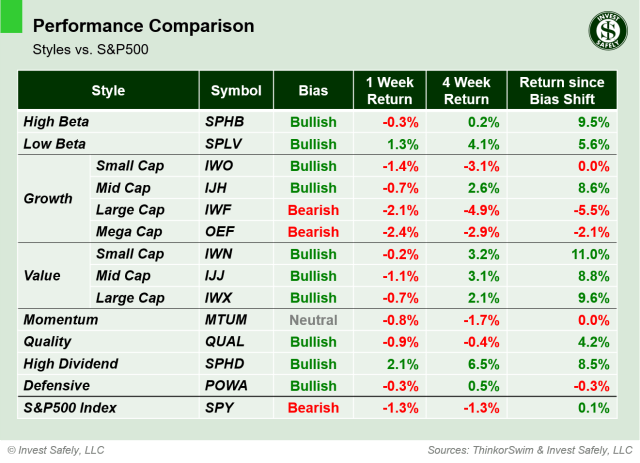
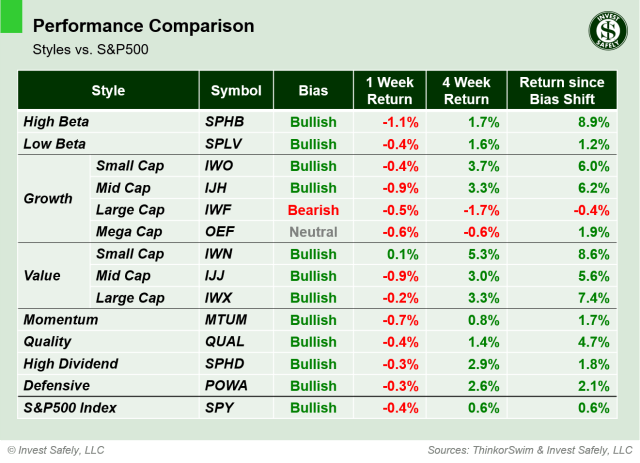
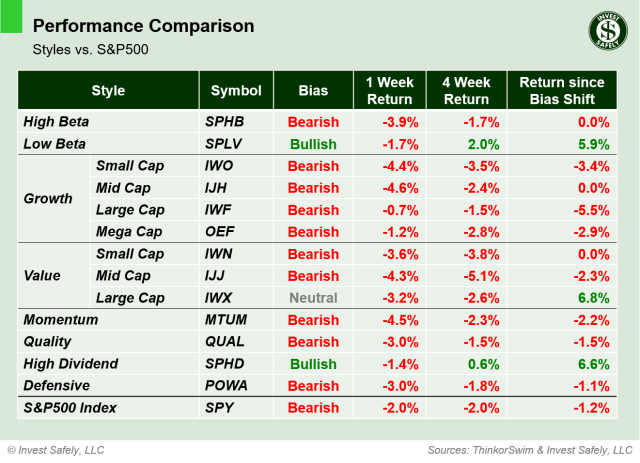
S&P500 Investing Styles
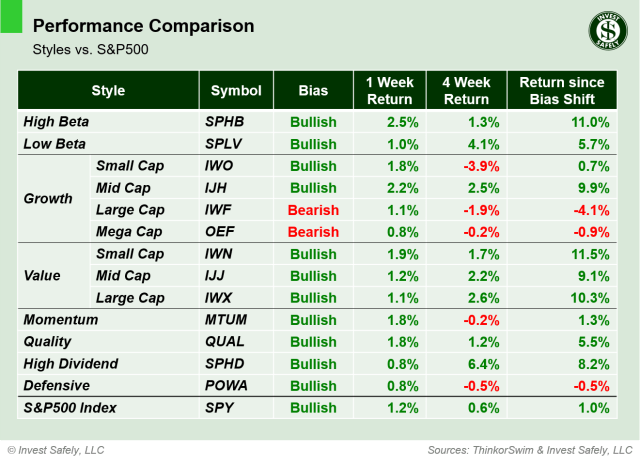
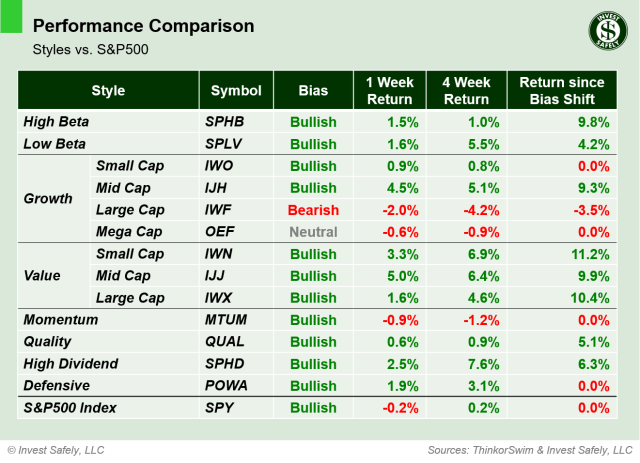
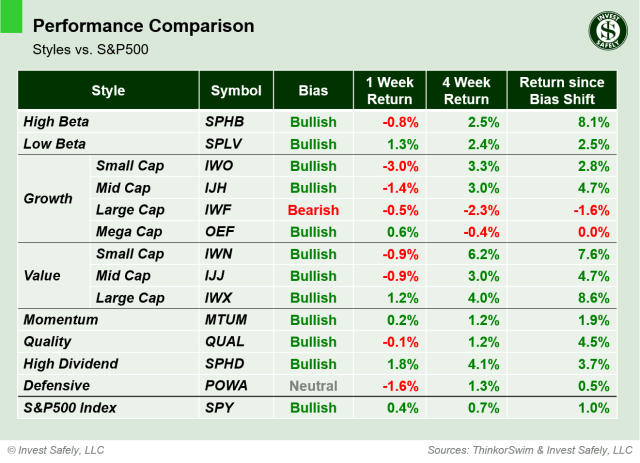
Investors fled all style factors last week. Large Cap Growth outperformed by falling less than 1%. Mid Cap Growth ( $IJH ) fell the most, although it had plenty of company ( $IWO, $IJJ, $MTUM ).
High Beta, Small Cap Growth & Value, Mid-Cap Growth & Value, Momentum , Quality, and Defensives ( $SPHB, $IWO, $IWN, $IJH, $IJJ, $MTUM, $QUAL, $POWA ) all dropped to bearish bias. Large Cap Value moved to neutral.
Sector Style Performance – 2026-03-08
COMMENTARY
Markets
The S&P500’s Volatility Index ( $VIX ) ramped higher last week, hitting 29.9 on Friday. Equities are essentially “uninvestable” when the reading is above 29; that level signals a high probability of large price swings…particularly the negative kind. Both the Nasdaq and Russell 2000 volatility readings ended the week above 30 as well.
When equity markets enter a sell off or a downtrend with accelerating volatility, the entire asset class gets impacted. Small Caps & Large Caps, Growth & Value, Technology & Consumer Staples, Emerging & Developed Markets; they’re all just different flavors of equities. So it’s no surprise that we encountered a broad sell-off last week, negatively impacting all sectors and styles. Energy was the only “winner”, but even that performance required a +30% rally in Oil.
Speaking of oil; what a move! Up ~13% on Friday alone. The commodity also experience a massive move in volatility, reaching levels on par with the COVID crisis, as price responded to news out of West Asia ( more below ).
Treasury yields also rallied off of lows last week, sending bond funds lower.
Given the broad rise in volatility, it’s reasonable to expect large price moves to the downside next week. Many institutional trading methodologies mechanically adjust holdings at pre-defined volatility levels. The speed of the moves will boil down to urgency; can positions be shopped around in an orderly fashion, or do they have to be liquidated immediately ( e.g. margin call ).
For individual investors, it’s still the game of minimizing holdings with bearish bias ( capital preservation ) and managing positions ( trimming at overbought, adding at oversold ) that are bullish.
Macroeconomic Data & Policy
Manufacturing and Services PMI surveys showed increased activity year over year, but also showed a high level of ongoing pricing pressure.
On Wednesday, ADP employment data showed 63k jobs were added in February 2026. On Friday, Non-Farm Payrolls showed a loss of 92k jobs during the same period, well below expectations for a gain of 59k.
Retail Sales decreased for the month of January, but beat expectations and were actually higher year over year.
Geopolitics
Hostilities in Western Asia continue to roil global markets, particularly oil and gas. Threats to ships traversing the Strait of Hormuz led several nations ( UAE, Iraq, Kuwait ) to reduce their oil production after running out of storage space. Saudi Arabia and Qatar halted refinery activity after experiencing drone attacks.
EYES ON THE HORIZON
The latest inflation data ( CPI & PCE ) hits the wires this week, along with the second Q4 GDP update and another jobs report.
- Monday: —
- Tuesday: —
- Wednesday: CPI
- Thursday: —
- Friday: PCE, Q4 GDP ( 2nd Revision ), JOLTS
Best to Your Week!