Stock Market Outlook entering the Week of August 1st = Uptrend
-
- ADX Directional Indicators: Uptrend
- Price & Volume Action: Mixed
- Elliott Wave Analysis: Uptrend
ANALYSIS
The stock market outlook uptrend slide into August with sideways price action, which aligns with some of the weakness we discussed in last weeks post.
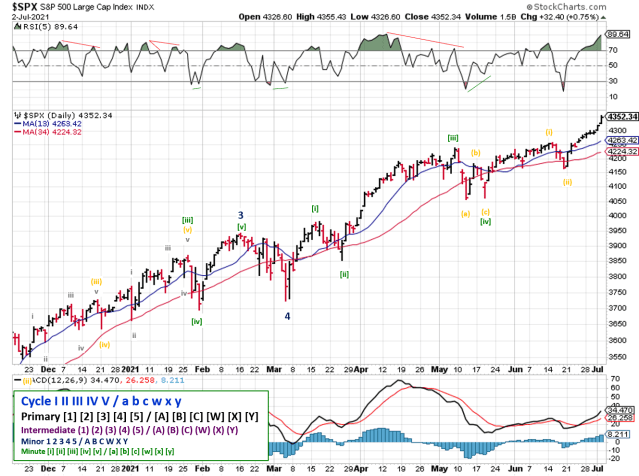
Fairly flat week for the S&P500 ($SPX) with the index hitting resistance at the upper channel line twice. It currently sits just off all time highs, ~3% above the 50-day moving average, and more than 10% above the 200-day moving average.

SPX Price Chart for the Week of August 01 2021
The ADX remains bullish, but the overall trend is weaken again.
The S&P also picked up 2 distribution days, coincidentally after testing the upper channel. At first glance, it appears to have added 3 distribution days, but 1 didn’t meet the price movement criteria. Wednesday’s close (vs. Tuesday’s close) dropped less than 0.2%. Either way, the count remains elevated, so the signal stays at “mixed” with price above the 50-day.

SPX Price Chart for the Week of August 01 2021
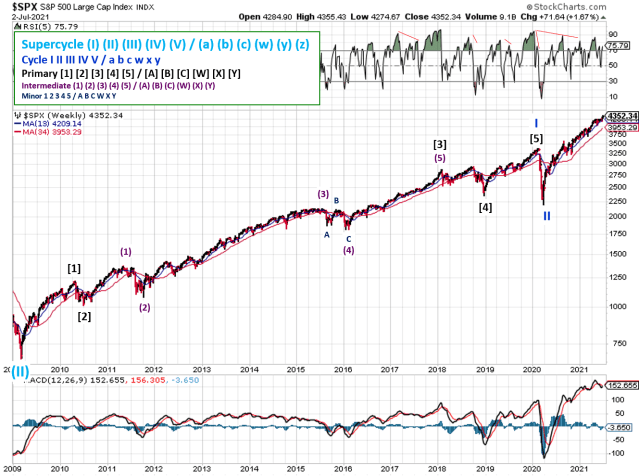
The uptrend signal from Elliott Wave rolls into another week…If wave i peaked on Thursday, wave ii could drop as low as 4225 before running back to all time highs. We haven’t checked the longer-term view in a while. The chart on the left aligns with the chart above, showing the 5th wave extension we’ve discussed a few times in the past. The chart on the right is an alternative view, proposed by a reader, asking what the count looks like if the Primary 1 wave ended with August’s sell-off. In both cases, it appears a correction is closer than it is farther away.

SPX Price Chart for the Week of August 01 2021
COMMENTARY
Earnings season started off pretty well, though some well known technology companies sold off surprisingly hard after reporting. But it’s next quarter’s earnings when we’ll begin to see post-COVID performance become the baseline for y-o-y comparisons.
A nothing-burger from the Fed last week; appears that they will continue to think about when to start thinking about telling us their thinking about normalizing financial policy.
Best to Your Week!