Weekend Stock Market Outlook – March 6 2022

Stock Market Outlook entering the Week of March 6th = Downtrend

    • ADX Directional Indicators: Downtrend
    • Price & Volume Action: Downtrend
    • Elliott Wave Analysis: Downtrend

ANALYSIS
The stock market outlook “downtrend” signal continues, after another week of geopolitical turmoil.

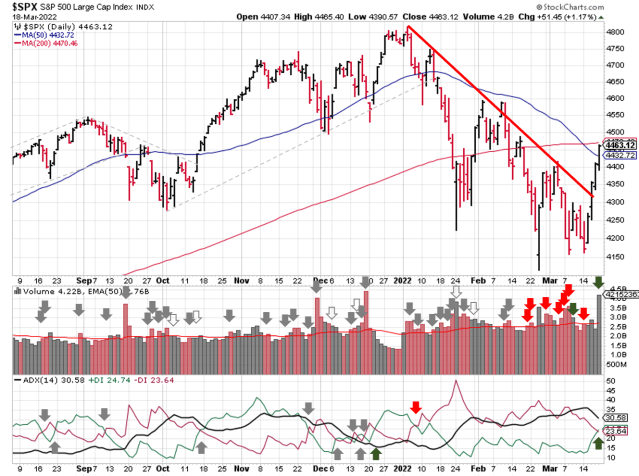
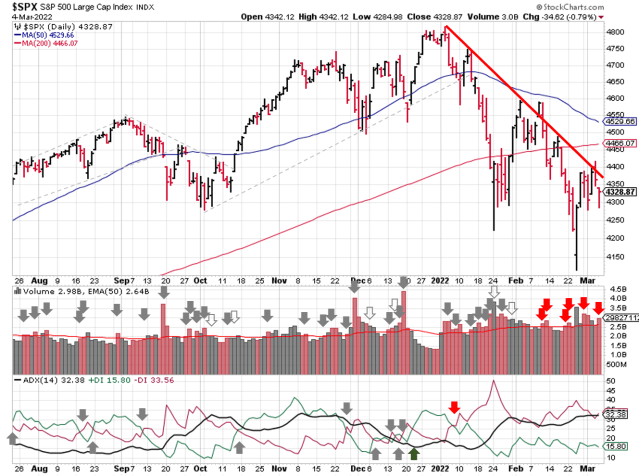
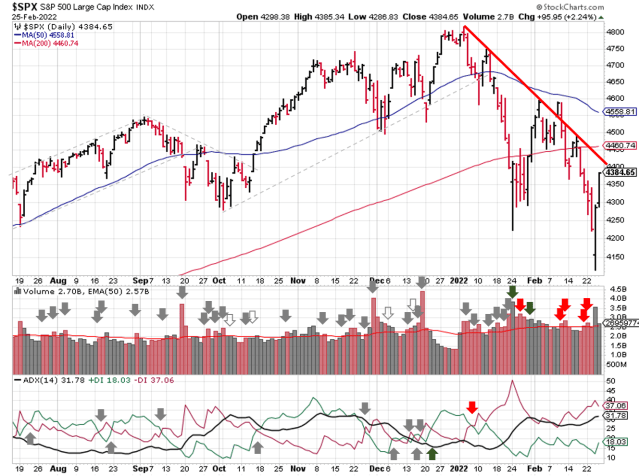
The S&P500 ($SPX) lost 1.3% for the week, and currently sits ~4% below the 50-day moving average and 3% below the 200-day.  The index briefly broke above the downward trendline after trading opened on Thursday, but quickly reversed lower.

Technical analysis of daily SPX prices

SPX Price & Volume Chart for the Week of March 06 2022

The ADX signal shows a strong bearish trend.  Price and volume continues to show a downtrend as well, with the SPX below the 50-day moving average, several distributions days, and limited signs of accumulation from institutions.

Technical analysis of daily SPX prices

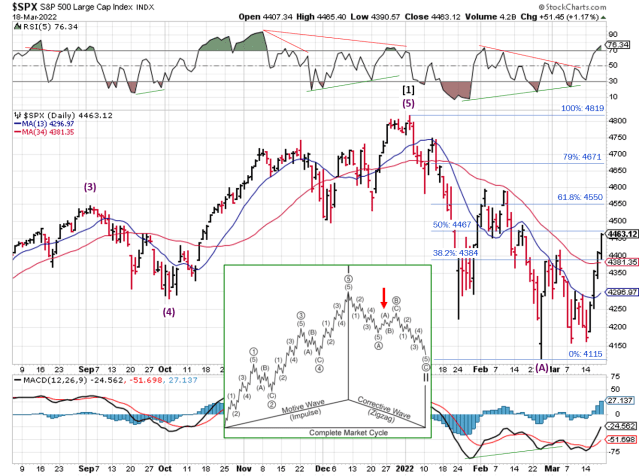
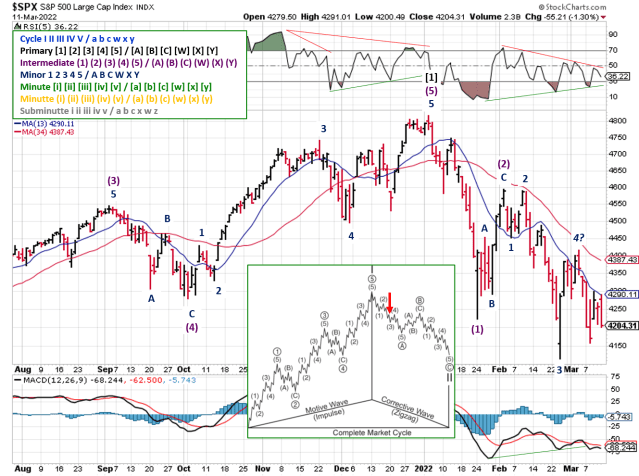
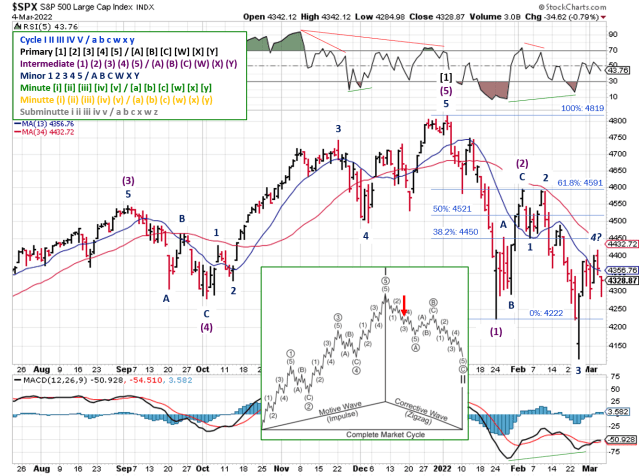
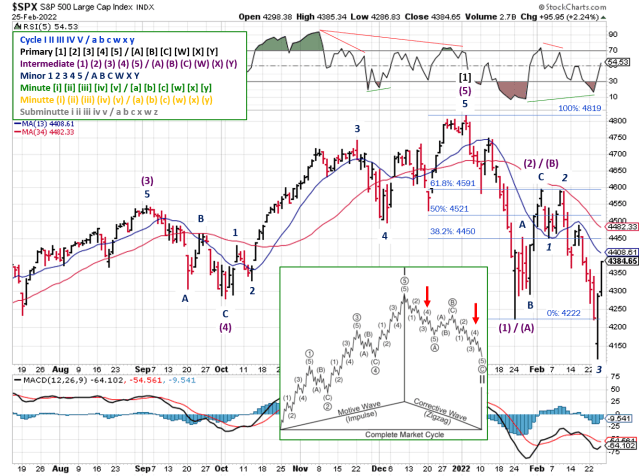
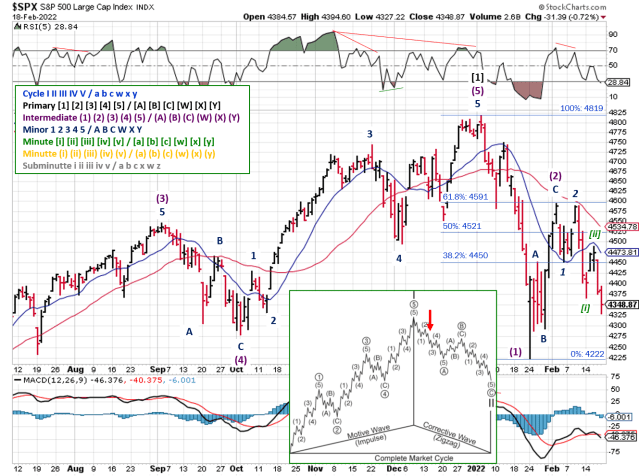
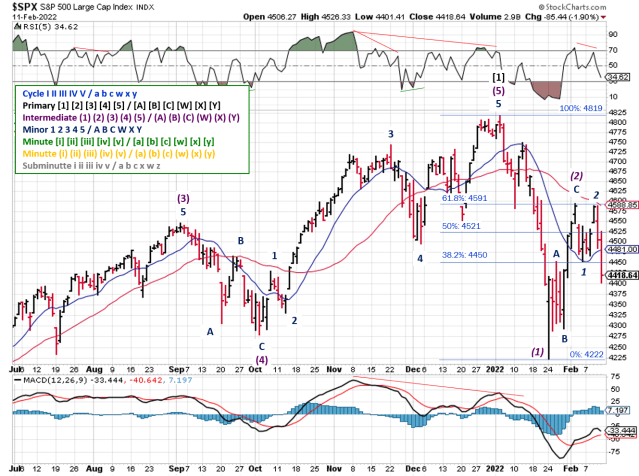
SPX Elliott Wave Analysis for the Week of March 06 2022

Elliott Wave continues to show a downtrend.  The Minor 4 wave may have ended Thursday.  That count would be invalidated if the SPX rallies above the Minor 1 low (4451.5).  Positive divergences developed in the RSI and MACD; the first “green shoots” we’ve seen this spring.  As mentioned last week, the current bearish count is invalidated if the SPX rises above 4450.

COMMENTARY
Russia intensified its attack on Ukraine last week. Since we live in a connected society now, instability in one region affects us all more acutely than in years past. Most of the world is concerned about the humanitarian impact the conflict, and looking for ways to help.  I’ve read stories about people using renting rooms and homes in Eastern Europe using AirBnB, as a way to get quickly get money directly to Ukrainians in need.

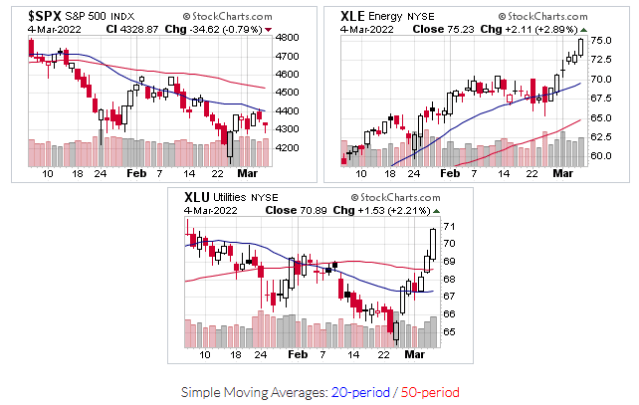
On the economic front, the immediate reaction to the war is the mooning of energy and commodity prices. Oil jumped 25%, copper rose ~10%, the Energy Select Sector SPDR Fund (XLE) was up 9.2%.

Utilities (XLU) also “benefited”, but otherwise there’s a LOT of red out there.

The U.S. jobs report showed 678,000 jobs added to the rolls in February; consensus estimates were looking for 390,000. That’s a pretty big beat, and brought the unemployment rate down to 3.8%. U.S. Fed Chairman testified last week too, doing about as much as humanly possible to announce a 0.25% rate hike without actually announcing it.

At this point, a rate hike next week is probably “priced in”, so we shouldn’t see too much volatility when it’s actually announced.  But all signs point to the Fed increasing interest rates into an economic slowdown (i.e. GDP falling year over year, which would create more headwinds for markets to overcome.

Investing during the early 2020s has required a different mindset than investing in the 2010s. We’re still dealing with supply chain issues from the pandemic that started 2 years ago, so it’s quite possible that we’re still dealing with the ripple effects of the war long after the shooting stops.  It’s not clear when sanctions will be lifted either; they could get worse before they get better.

The only thing that is certain is that our path forward is uncertain.  Uncertainty breeds volatility, and volatility is not something we had a lot of in the past decade.  You’ll need to revisit your position sizing rules, in terms of how much you’re willing to lose before exiting a trade.  You may need to lower your position size to feel comfortably weathering larger swings.

Best To Your Week!

Invest Safely, LLC is an independent investment research and online financial media company.  Use of Invest Safely, LLC and any other products available through invest-safely.com are subject to our Terms of Service and Privacy Policy. Not a recommendation to buy or sell any security.
Posted in Historical Data, Market Trends | Tagged , , , , | Comments Off on Weekend Stock Market Outlook – March 6 2022

Weekend Stock Market Outlook – February 27 2022

Stock Market Outlook entering the Week of February 27th = Downtrend

    • ADX Directional Indicators: Downtrend
    • Price & Volume Action: Downtrend
    • Elliott Wave Analysis: Downtrend

ANALYSIS
The stock market outlook remains in a downtrend, although stocks rebounded broadly to close the week.

Despite the Russian invasion of Ukraine, the S&P500 ($SPX) actually ended up 0.8% last week after a massive rally on Thursday that spilled over into Friday.  The index currently sits ~2% below the 200-day moving average and ~4% below the 50-day.

Technical analysis of daily SPX prices

SPX Price & Volume Chart for the Week of February 27 2022

The ADX signal continues to show a bearish trend in place, and has done so since the directional indicators crossed over on January 4th.

The price/volume signal also shows a downtrend.  Distribution days have come in pairs since late January, so the selling hasn’t been THAT bad.  Rather, a lack of buyers seems to be the issue.

Not surprisingly, the price charts of leading companies look awful; very few are showing price patterns associated with accumulation.

Technical analysis of daily SPX prices

SPX Elliott Wave Analysis for the Week of February 27 2022

Elliott Wave continues to show a downtrend.  The potentially bullish count bit the dust last week, while both Bearish counts remain in play.

Technical analysis of daily SPX prices

SPX Elliott Wave Analysis for the Week of February 27 2022

Some people have said last week’s low was the bottom (i.e. the entire ABC correction).  I’m skeptical, but will trade based the price and volume action.  Both bearish counts are invalidated if the SPX rises above 4450.

COMMENTARY
The situation in Ukraine went from bad to worse, as cooler heads did not prevail.  Something changed in the Russian calculus, where an actual invasion / occupation of Ukraine is beneficial.

The U.S. and European countries imposed economic sanctions on Russia’s financial and technology sectors, although oil and energy were not included (yet).  As of this weekend, certain Russian banks are set to be expelled from SWIFT, the highly secure global network used for global financial transactions.

The conflict is still in the early stages, and so far, the long-term impact to the U.S. markets appears to be limited.  That said, the U.S. economy already faced significant challenges that aren’t made any easier by the conflict.

The U.S. yield curve continues to flatten, as the bond traders come to grips with upcoming Fed rate hikes and higher levels of inflation.  Watch for an inversion (long-term higher than short term), which would indicate lower expectations for future growth and has a good track record of being a leading indicator for recessions.

I’m reminded of a line from the movie “National Treasure”:  “Cooperation only lasts as long as the status quo is unchanged“.   Unfortunately, the status quo has changed.  The longer this conflict drags on, the more former areas of cooperation are at risk.

Best To Your Week!


Invest Safely, LLC is an independent investment research and online financial media company.  Use of Invest Safely, LLC and any other products available through invest-safely.com are subject to our Terms of Service and Privacy Policy. Not a recommendation to buy or sell any security.
Posted in Historical Data, Market Trends | Tagged , , , , | Comments Off on Weekend Stock Market Outlook – February 27 2022

Weekend Stock Market Outlook – February 20 2022

Stock Market Outlook entering the Week of February 20th = Downtrend

    • ADX Directional Indicators: Downtrend
    • Price & Volume Action: Downtrend
    • Elliott Wave Analysis: Downtrend

ANALYSIS
The stock market outlook remains in a downtrend after another down week for U.S. equities. The S&P500 ($SPX) briefly reclaimed the 200-day moving average mid-week, before plunging back below that level ahead of the long weekend. The index currently sits ~5% below the 50-day moving average and 2.5% below the 200-day.

Technical analysis of daily SPX prices

SPX Price & Volume Chart for the Week of February 20 2022

The ADX signal continues to show a bearish trend in place. A few more distribution days fell off the count, but the price/volume signal still shows a downtrend too.

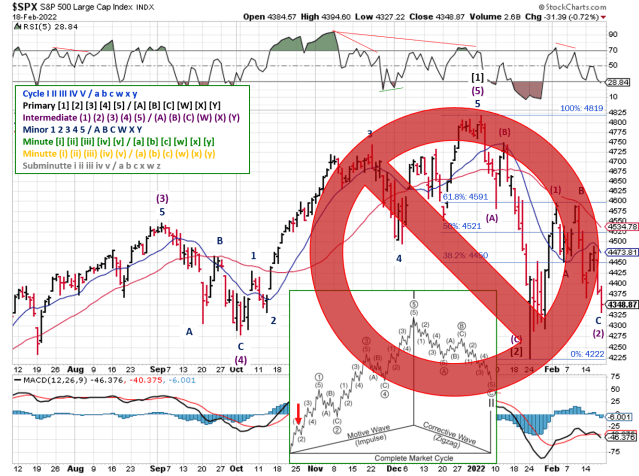
Elliott Wave also shows a downtrend, with two possible counts depending on your level of bearishness. I discovered a bullish count as well…possible, but not probable as of today.

Technical analysis of daily SPX prices

SPX Elliott Wave Analysis for the Week of February 20 2022

The first bearish count has the market in the 3rd wave ( Minor 3 ) of the first down wave of Primary [2] (Intermediate (A) ). This count implies the downtrend is just getting started. This count would be invalidated if the SPX rises above 4450.

Technical analysis of daily SPX prices

SPX Elliott Wave Analysis for the Week of February 20 2022

The second bearish count has the market in the 3rd wave (Minor 3) of the third down wave of Primary [2] (Intermediate (C) ). This count implies the downtrend is more than halfway complete. This count would be invalidated if the SPX rallies above 4450.

Technical analysis of daily SPX prices

SPX Price & Volume Chart for the Week of February 20 2022

And the bullish count shows the SPX completed the entire Primary [2] back on Jan. 24th, and is currently working through the first correction of the new uptrend (The Minor C wave of Intermediate (2) ). This count would be invalidated if the SPX falls below 4222.

COMMENTARY
The Russia-Ukraine situation continues to drive uncertainty into the markets, with each day seeming to to unearth a new set of will they/won’t they narratives.

Russia’s a global player in the energy market, so it’s no surprise that a potential conflict is driving up energy prices. Terrible for consumers and inflation; great for investments allocated to the energy sector.

No surprise rate hike from the Fed’s emergency meeting last week, which is a good thing. And the hysteria around a potential half point rate hike died down as well.

But the Fed’s job doesn’t get any easier, as each of the next 4 weeks has potentially market moving data releases. First, we’ll have to see what happens on Thursday (24th) when GDP is released. Keep in mind that the change verses last year is the most important number, as it will tell us if growth is starting to slow.

Shortly thereafter is the next jobs report (Friday, March 4), and then the next inflation reading (Thursday, March 10). All of which will need to be digested by the Fed, prior to releasing the actual size of the next interest rate hike on March 15-16th.

Best To Your Week!


Invest Safely, LLC is an independent investment research and online financial media company.  Use of Invest Safely, LLC and any other products available through invest-safely.com are subject to our Terms of Service and Privacy Policy. Not a recommendation to buy or sell any security.
Posted in Historical Data, Market Trends | Tagged , , , , | Comments Off on Weekend Stock Market Outlook – February 20 2022

Weekend Stock Market Outlook – February 13 2022

Stock Market Outlook entering the Week of February 13th = Downtrend

    • ADX Directional Indicators: Downtrend
    • Price & Volume Action: Downtrend
    • Elliott Wave Analysis: Downtrend

ANALYSIS
The stock market outlook still shows a downtrend after a particularly rough week for U.S. equities.

The S&P500 ($SPX) tried to rally back to the 50-day moving average, and briefly got past the downward trendline.  But the initial move was no match for the latest inflation report, which sent stocks back below the 200-day moving average.

Technical analysis of daily SPX prices

SPX Price & Volume Chart for the Week of February 13 2022

The ADX remains bearish.  The price/volume signal moved back to a downtrend, as the index sliced through the 200-day moving average on higher volume.  Friday’s close also put the index back below the Jan 21st follow-through day.

Technical analysis of daily SPX prices

SPX Elliott Wave Analysis for the Week of February 13 2022

The Elliott Wave signal remains bearish as well. The SPX tried to break through resistance at the 61.8% Fibonacci level of Intermediate (1) on Wednesday and Thursday, but retreated on both attempts.  On Friday, the index fell farther, losing support at the 38.2% Fibonacci level.

COMMENTARY
Following January’s surprise jobs report, January’s consumer price index also surprised to the upside, showing a 7.5% increase year over year, above the 7.3% expectation.  Core CPI (which excludes food and energy) was still up 6%.

Those readings sent yield on the 10-year Treasury past 2% for the first time since 2019.  And as expected, rate sensitive stocks took a nose dive (we see you $QQQ).  St. Louis Fed President Bullard added fuel to the fire by calling for raising interest rates by 1% by the end of June.

While it’s highly likely that we’re at the peak of y-o-y inflation readings, it’s also highly likely that the price increases we’ve seen over the past year are going to be around for a while (i.e. they’re sticky).

The next policy meeting occurs in March (15th-16th).  On Friday (Feb 10th), the Board announced a closed door meeting, taking place under “expedited procedures”, to take place tomorrow (Monday, Feb 14).  There’s speculation that this is an emergency meeting to raise interest rates, in response to the higher than expected CPI numbers.

We know that interest rates are headed higher.  Now we need to watch GDP releases.  Slowing growth and rising rates are the land of bear markets; next release is Feb 24th.

We’re also coming off the highest level of margin debt ever (as a percent of GDP); higher than the peak in 2000, 2008, and 2018.  With rates set to rise, margin debt is about to get more expensive.  And the sectors benefiting the most from margin on the way up will be the ones punished on the way down.

Hopefully, you’ve used the run-up to reallocate your holdings, book longer-term gains and cut your losses.  At the very least, now is not the time to go all in.  The markets will get back into bull mode eventually (they always do).

And let’s not overlook the current situation in Ukraine.  Hopefully cooler heads prevail.

Best To Your Week!


Invest Safely, LLC is an independent investment research and online financial media company.  Use of Invest Safely, LLC and any other products available through invest-safely.com are subject to our Terms of Service and Privacy Policy. Not a recommendation to buy or sell any security.
Posted in Historical Data, Market Trends | Tagged , , , , | Comments Off on Weekend Stock Market Outlook – February 13 2022

Weekend Stock Market Outlook – February 6th 2022

Stock Market Outlook entering the Week of February 6th = Downtrend

    • ADX Directional Indicators: Downtrend
    • Price & Volume Action: Mixed
    • Elliott Wave Analysis: Downtrend

ANALYSIS
The stock market outlook remains in a downtrend, and current sits between the 50 and 200-day moving average.

The S&P500 ($SPX) rallied hard, then eased into the close, gaining ~1.5% for the week.  The downward trendline remains in place, with the index closing near that level on Wednesday then retreating.

Technical analysis of daily SPX prices

SPX Price & Volume Chart for the Week of February 06 2022

The ADX remains bearish. The price/volume signal moved back to mixed last Monday. Jan 24th marked the start of a possible rally attempt, and Monday’s trading action marked a follow-through day, with a rise on higher trading volume.  But the index remains below the 50-day moving average, and the price charts of most leading companies are far from proper buy points.  Most are still working on the left-side (corrective side) of new price patterns, like the “cup with handle”.  When companies with excellent fundamentals start breaking out of proper price patterns, you’ll know the market is ready to rally.

Technical analysis of daily SPX prices

SPX Elliott Wave Analysis for the Week of February 06 2022

For Elliott Wave, the signal remains bearish. Wednesday’s close was higher than the Jan 10th low, so that invalidates the Minor 1 wave from last week.  Considering last week’s discussion of time compression, it’s possible/probable that the entire Intermediate (1) completed on Feb 24th.

Technical analysis of daily SPX prices

SPX Elliott Wave Analysis for the Week of February 06 2022

The SPX was range-bound between the 62% and 32% Fibonacci levels. last week. Since the index retraced more than 50% of the decline from the Jan 3rd high, so price action meets the minimum criteria for a corrective Intermediate Wave (2) move (remember that during downtrends, corrective moves are to the upside – i.e. a rally).

Looking ahead, it’s entirely possible we plunge further from here, but heading back toward all time highs isn’t out of the question either. Wave (2) can retrace all of (1); back to the Jan 3rd high, and remain valid.   That’s why other signals are important; they’re likely to turn bullish before  Elliott Wave sorts itself out.

COMMENTARY
Last week’s January jobs report blew away expectations, and likely sealed the deal in terms of the Fed raising interest rates in March.  The next question is how much, followed by what’s next.  The interest rate futures curve implies that there’s now a 33% chance the Fed raises rates 0.5% in March.  And many investment banks are making headlines for their predictions of up to SIX rate hikes this year!  Regardless, until the Fed actually raises rates, we’re likely to see continued volatility in the market.

Speaking of volatility, there was a lot of that to go around last week; this time tech companies like Facebook/Meta, Amazon, Google, Snapchat.   Weighted indexes like the SPX will avoid the carnage as long as mega-cap stocks like Apple, Google, and Amazon hold up.  Quarterly earnings drove the the unusual movements, so keep in mind that year-over-year increases are increasingly harder to achieve thanks to great numbers in 2020.  In the current market environment, companies that miss on headline numbers (revenue/profit) see their stock prices severely punished (i.e. Facebook $FB).

Best To Your Week!


Invest Safely, LLC is an independent investment research and online financial media company.  Use of Invest Safely, LLC and any other products available through invest-safely.com are subject to our Terms of Service and Privacy Policy. Not a recommendation to buy or sell any security.
Posted in Historical Data, Market Trends | Tagged , , , , | 1 Comment

Weekend Stock Market Outlook – January 30 2022

Stock Market Outlook entering the Week of January 30th = Downtrend

    • ADX Directional Indicators: Downtrend
    • Price & Volume Action: Downtrend
    • Elliott Wave Analysis: Downtrend

ANALYSIS
The stock market outlook is in a downtrend heading into the final trading day of January.

The S&P500 ($SPX) actually gained just under 1% last week, closing near the top of it’s trading range.  The index spent the entire week below the 200-day moving average, but rallied Friday to close the day and the week at that level.

stock-market-outlook-2022-01-30

SPX Price & Volume Chart for the Week of January 30 2022

The ADX and price/volume are both showing bearish price action.

For Elliott Wave, the remaining “uptrend” count bit the dust when price fell below 4279 Monday.  That leaves the Primary [2], “crying Jordan” correction.

Technical analysis of daily SPX prices

SPX Elliott Wave Analysis for the Week of January 30 2022

The current count is Minor Wave 5 of Intermediate (1) of Primary [2].  If it holds, I’d expect the price to fall below the Jan 24th low to complete Intermediate (1), and then rally back towards the Jan 3rd high, retracing 38% to 61% of the entire Intermediate  (1) wave.  Important to note that during down waves (2,4), the numbered waves (i.e. impulse waves) are to the downside and lettered waves (i.e. corrective waves) are the uptrends.

One thing to note about downtrends, thanks to the fractal nature of market moves, is time compression during periods of high volatility. When price moves rapidly, time compresses.  So you’ll need to look at multiple timeframes (daily –> hourly or 15 minute) to see some of the waves more clearly on price charts (e.g. Minutte/Minute).

COMMENTARY
A wild week in the markets, with more on the way.  Caution will be the word of the month in February, as investors and traders position themselves for March and beyond.

Barring something catastrophic, March will see Fed-sponsored stimulus end and the first interest rate hike in a LONG time.  The Fed is doing it’s best to give investors a lot of advanced warning.  Based on the market response, they weren’t exactly thrilled.

As we’ve discussed before, less liquidity means more volatility.  Higher interest rates mean a lower value for future cashflows.  The NASDAQs P/E ratio has already fallen from a high near 35 to something closer to 27 on the announcement alone.

There are A LOT of theories about how many hikes in 2022; some are projecting 5!  The number of rate hikes will likely be determined by the overall size of rate hikes.  Five 0.25% rate hikes probably won’t happen…but it’s a lot more probable than five 1% rate hikes.  A 1% rate hike, by itself, is also unlikely.

We know interest rates will rise, so watch GDP.  A combination of rising interest rates and falling GDP is a bearish environment for equities, and add to that the fact that earnings are likely to disappoint because the year over year comparisons now include last year’s reopening trades.

Best To Your Week!


Invest Safely, LLC is an independent investment research and online financial media company.  Use of Invest Safely, LLC and any other products available through invest-safely.com are subject to our Terms of Service and Privacy Policy. Not a recommendation to buy or sell any security.
Posted in Historical Data, Market Trends | Tagged , , , , | Comments Off on Weekend Stock Market Outlook – January 30 2022

Weekend Stock Market Outlook – January 23 2022

Stock Market Outlook entering the Week of January 23rd = Downtrend

    • ADX Directional Indicators: Downtrend
    • Price & Volume Action: Downtrend
    • Elliott Wave Analysis: Mixed

ANALYSIS
The stock market outlook shifted to a downtrend after significant selling took the SPX down more than 5% last week.

The S&P500 ($SPX) found no technical support last week: not at the two trendlines, not at the 50-day moving average, not even at the 200-day.  The higher lows mentioned last week?  Tuesday took care of that trend too, as well a few other things.

First things first, the ADX directional indicators are solidly bearish and showing a strengthening trend.

Technical analysis of daily SPX prices


SPX Price & Volume Chart for the Week of January 23 2022

The price & volume signal moved from mixed to a downtrend on Tuesday, tripping three different alarms.

  1. The index made a new lower low (vs Jan 10)
  2. The index closed below the follow-through day for the uptrend (Dec 15)
  3. The selling came on higher trading volume

The SPX followed that up by closing below the rally starting point (Dec 6), just to make sure traders got the message.  Not that investors and traders needed a reminder, given that most individual stocks, especially technology names, have been selling off for some time now.

Technical analysis of daily SPX prices

SPX Elliott Wave Analysis for the Week of January 23 2022

For Elliott Wave, the 3 most bullish counts bit the dust when the SPX fell below 4495 on Thursday.

Technical analysis of daily SPX prices

SPX Elliott Wave Analysis for the Week of January 23 2022

That leaves us 1 uptrend and 1 downtrend remaining…a mixed signal if there was one.

Technical analysis of daily SPX prices

SPX Elliott Wave Analysis for the Week of January 23 2022

It’s possible that Minor 2 is still in progress. If that count is correct, we’re in the final leg of the sell-off and the SPX won’t get lower than 4279…that’s another 2.5% or so.

Technical analysis of daily SPX prices

SPX Elliott Wave Analysis for the Week of January 23 2022

Or, if the index can’t hold 4279, it’s likely that Primary [1] ended January 3rd and we’re all “crying Jordan’s” in a Primary [2] correction.

Technical analysis of weekly SPX prices

SPX Elliott Wave Analysis from 2009 to 2022

If we zoom out, here’s what the long term count looks like at the moment.

COMMENTARY
The 10-year treasury yield spiked last week to a 2-year high, driving money out of stocks (especially the technology sector), and spiking volatility.  While talking heads express shock at the moves, market action is pretty consistent with the beginning of Fed tightening cycles.  Not to mention the uniqueness of the current cycle, coming off of zero and near-zero interest rate policy.

More than likely you noticed the selling a while ago in individual companies.  The indexes were buoyed by megacap’s like Facebook, Amazon, Netflix and Google.

I’m not saying we don’t go lower from here; just that the selling isn’t abnormal from a long term perspective.  Even crypto!

Best To Your Week!


Invest Safely, LLC is an independent investment research and online financial media company.  Use of Invest Safely, LLC and any other products available through invest-safely.com are subject to our Terms of Service and Privacy Policy. Not a recommendation to buy or sell any security.
Posted in Historical Data, Market Trends | Tagged , , , , | 2 Comments