Weekend Stock Market Outlook – December 12 2021

Stock Market Outlook entering the Week of December 12th = Uptrend

    • ADX Directional Indicators: Uptrend
    • Price & Volume Action: Uptrend
    • Elliott Wave Analysis: Uptrend

ANALYSIS
The stock market outlook maintains an uptrend heading into Monday’s trading session, with all three signals showing green. This week, be on the lookout for November PMI and retail sales, as well as U.S. Fed meetings Wednesday and Thursday.

Last week capped another volatile week for the ($SPX); this time to the upside. The index rallied off the 50-day moving average and now sits ~3% above that level.

Technical analysis of daily SPX prices

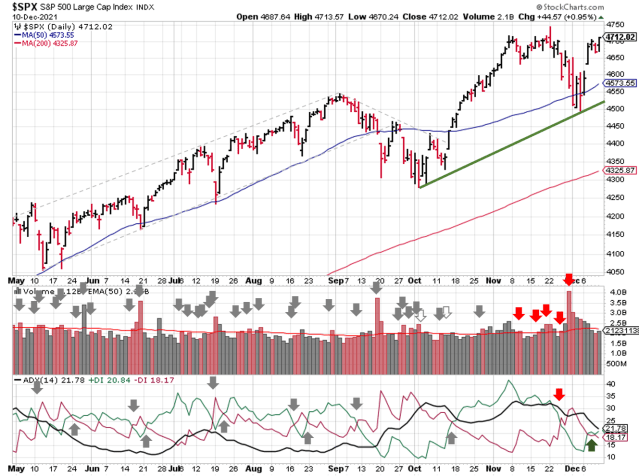
SPX Price & Volume Chart for the Week of December 12 2021

I called last week a make or break week for the market, and the investors chose “make”, so  I was a bit premature putting the trendline out to pasture.

The ADX directional indicators flipped back to bullish last Tuesday. The price/volume signal dropped last week’s asterisk from it’s uptrend signal.

Technical analysis of daily SPX prices

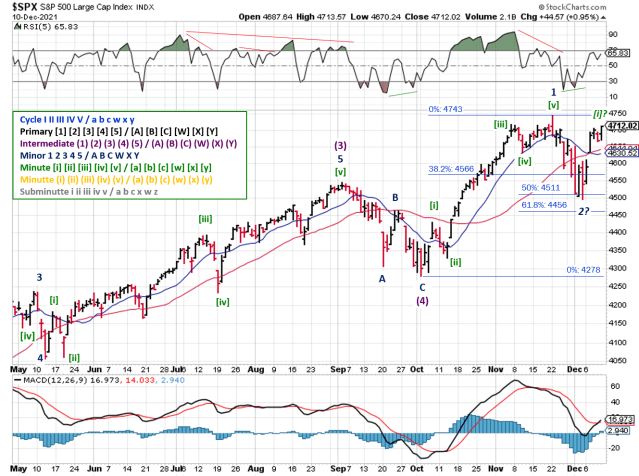
SPX Elliott Wave Analysis for the Week of December 12 2021

For Elliott Wave, the December 3rd low of 4495 looks to be the end of Minor Wave 2 and the recent correction. That wave didn’t quite make it to the 61.8% Fibonacci level, but did pass the typical minimum of a 50% retracement.

It’s still possible for the December 3rd low to be first part of a larger Minor Wave 2 correction; the A-wave of an ABC zigzag pattern, similar to the one from late September.  For now, the count puts the S&P into the first wave of a Minor Wave 3.

COMMENTARY
As expected, inflation came in hot for November (CPI at 6.8%).  Anyone who’s buying pretty much anything knows that prices have increased this year.

While the monthly jobs report may have underwhelmed, the overall unemployment rate is below 5%, so you’ve probably noticed that discussion getting less and less airtime. Instead, be prepared for a breathless discussion of tapering and interest rates this week, ahead of the Dec 15 & 16 Fed meeting.

As far as your investing process is concerning, tapering means removing liquidity from financial markets, and less liquidity means higher volatility.  Higher volatility means larger price swings, which impacts your entry and exit signals.

Rising rates change the valuation of future cashflows, which changes financial estimates for all sorts of fundamental analysis. And changes to underlying financials will impact sector performance, as well as your overall asset allocation strategy.

Best to Your Week!


Invest Safely, LLC is an independent investment research and online financial media company.  Use of Invest Safely, LLC and any other products available through invest-safely.com are subject to our Terms of Service and Privacy Policy. Not a recommendation to buy or sell any security.
Posted in Historical Data, Market Trends | Tagged , , , , | Comments Off on Weekend Stock Market Outlook – December 12 2021

Weekend Stock Market Outlook – December 5 2021

Stock Market Outlook entering the Week of December 5th = Uptrend

    • ADX Directional Indicators: Downtrend
    • Price & Volume Action: Uptrend
    • Elliott Wave Analysis: Uptrend

ANALYSIS
The stock market outlook still shows an uptrend in place, even with last week’s volatile trading and a loss of 1.2%.  This week is likely make or break for the uptrend, with price at key support levels.

A rising trendline bit the dust, and the index is still looking for support from the 50-day moving average. Yet in spite of last week’s performance, the ($SPX) still sits less than 5% from an all time high.

Technical analysis of daily SPX prices

SPX Price & Volume Chart for the Week of December 05 2021

As far as the signals are concerned, there’s no change from last week.  The ADX directional indicators remain bearish.

The price/volume signal continues to show an uptrend, with the distribution day count slightly elevated and price at the 50-day.  That’s not to say it’s currently a strong signal, because trading volume around the 50-day definitely skewed to the downside.  A close below the low’s of last week would change this signal to bearish and the outlook to a downtrend.

Technical analysis of daily SPX prices

SPX Elliott Wave Analysis for the Week of December 05 2021

Elliott Wave shows the Minor 2 corrective wave in play.  As mentioned last week, a 2nd wave typically hits the 61.8% Fibonacci retracement level of the first wave, or 4,455 on the SPX.

Friday’s trading session low was 4,495, which is greater than the 50% Fibonacci retracement level.  The low also came with positive divergences for the RSI and MACD histogram, so I’m looking for the start of a 3rd wave to the upside.

That doesn’t mean we can’t or won’t go lower from here. A close below 4,278 would negate the current count, and put this signal into a downtrend.

COMMENTARY
Volatility ramped up last week, with the VIX jumping into the mid-30’s and the S&P500 oscillating more than 1% each day. As far as the cause, you can pick your narrative:

  • Spread of the Omicron variant
  • Weak November employment numbers
  • The flattening yield curve
  • “Transitory” no longer being used to describe inflation
  • Expectations for faster tapering
  • Hedge fund liquidations
  • Month end portfolio adjustments
  • And, and, and…

What matters is impact, and while there weren’t many places to hide from the selling, the size of losses varied greatly. If you were long small caps, commodities, or crypto; ouch. If you were long gold or industrial’s; not too bad.

Given the level of uncertainty investors face, do be surprised if the markets remain volatile. Asset and sector allocation will be key, as it’s likely that institutions will look to maximize Q4 performance and end the year strong.  In other words, a “buy the dip opportunity” exists, but keep your stops tight in case you’re looking in the wrong place!

Best to Your Week!


Invest Safely, LLC is an independent investment research and online financial media company.  Use of Invest Safely, LLC and any other products available through invest-safely.com are subject to our Terms of Service and Privacy Policy. Not a recommendation to buy or sell any security.
Posted in Historical Data, Market Trends | Tagged , , , , | Comments Off on Weekend Stock Market Outlook – December 5 2021

Weekend Stock Market Outlook – November 28 2021

Stock Market Outlook entering the Week of November 28th = Uptrend

    • ADX Directional Indicators: Downtrend
    • Price & Volume Action: Uptrend
    • Elliott Wave Analysis: Uptrend

ANALYSIS
The stock market outlook still shows an uptrend in progress, despite a rough week for U.S. stocks.  After reaching an all time high to start last week, COVID concerns derailed the rally and the S&P500 ($SPX) ended the week down 2.2%. The index now sits ~1.5% and 7% above the 50 and 200 day moving averages, respectively.

Technical analysis of daily SPX prices

SPX Price & Volume Chart for the Week of November 28 2021

The ADX directional indicators flipped to a downtrend on Friday, but price/volume signal remains in an uptrend. Price remains above the 50-day moving average, and 2 more distribution days brings the total to 5.

Technical analysis of daily SPX prices

SPX Elliott Wave Analysis for the Week of November 28 2021

Elliott Wave also maintains an uptrend overall, with the S&P in a 2nd wave correction. Not too surprising given the weakness / 5th wave characteristics mentioned last week. With a completed Minor 1, we’re now looking for the bottom of minor 2, which could be anywhere between the current price and the October low near 4275.

The typical expectation for a second wave is a 61.8% retrace of the first wave. Minor Wave 1 was 465 points, so the retrace would be 287 points from the top (4743): 4455 or so (another ~3% drop from Friday’s close).

COMMENTARY
The news of a new COVID strain hit the wires at the worst possible time; ahead of a traditionally low-volume trading day with most market participants away from their desks.  Automated trading programs and algorithms probably keyed on all the news reports related to COVID and sold holdings to be on the safe side.  In that light, Friday’s volatility isn’t too surprising and is most likely a knee-jerk reaction.

That said, corrections are a healthy part of market action, and this one may not be over yet.  Keep an eye on government and corporate responses to the Omicron variant.  Travel bans and lockdowns, even if they’re short-lived, won’t do stock markets any favors.  But they may offer you an early gift, in the form of another buying opportunity heading into year end.

Best to Your Week!


Invest Safely, LLC is an independent investment research and online financial media company.  Use of Invest Safely, LLC and any other products available through invest-safely.com are subject to our Terms of Service and Privacy Policy. Not a recommendation to buy or sell any security.
Posted in Historical Data, Market Trends | Tagged , , , , | Comments Off on Weekend Stock Market Outlook – November 28 2021

Weekend Stock Market Outlook – November 21 2021

Stock Market Outlook entering the Week of November 21st = Uptrend

    • ADX Directional Indicators: Uptrend
    • Price & Volume Action: Uptrend
    • Elliott Wave Analysis: Uptrend

ANALYSIS
The stock market outlook remains in an uptrend, as the S&P500 ($SPX) spent the week grinding higher.  From a moving average perspective, the index starts the week in roughly the same position as it did last week: ~4% and 10% above the 50 and 200 day, respectively.

Technical analysis of daily SPX prices

SPX Price & Volume Chart for the Week of November 21 2021

The ADX continues to highlight bullish price action and trend, as does price/volume.  Friday was a lower close on higher volume, thanks in part to November options expiration.  But the price movement wasn’t larger enough to qualify for a distribution day.

Technical analysis of daily SPX prices

SPX Elliott Wave Analysis for the Week of November 21 2021

Elliott Wave maintains an uptrend.  Both the RSI and MACD show negative divergences verses the rising price action; common for 5th waves, but also a sign of a weak rally.

COMMENTARY
A short trading week on tap in the U.S., due to the Thanksgiving Holiday (markets closed Thursday and shortened trading hours Friday).

Historically, Thanksgiving week is a positive one for the markets, but the possible nomination of the next chairperson of the Federal Reserve is a wildcard this year. Personal spending and income data and the PCE index for October are released on Wednesday, which are sure to add fuel to the inflation debate.

Best to Your Week!


Invest Safely, LLC is an independent investment research and online financial media company.  Use of Invest Safely, LLC and any other products available through invest-safely.com are subject to our Terms of Service and Privacy Policy. Not a recommendation to buy or sell any security.
Posted in Historical Data, Market Trends | Tagged , , , , | Comments Off on Weekend Stock Market Outlook – November 21 2021

Weekend Stock Market Outlook – November 14 2021

Stock Market Outlook entering the Week of November 14th = Uptrend

    • ADX Directional Indicators: Uptrend
    • Price & Volume Action: Uptrend
    • Elliott Wave Analysis: Uptrend

ANALYSIS
The stock market outlook remains in an uptrend, as the S&P500 ($SPX) took a bit of a breather last week. The index sits ~4% and 10% above the 50 and 200 day moving averages, respectively.

Near-term, the U.S. economy and inflation are on the rise, stocks and commodities will continue doing well.  As far as sectors are concerned, industrial, technology, and energy have all benefited. 

SPX Price & Volume Chart for the Week of November 14 2021

The ADX continues to highlight bullish price action and trend, as does price/volume.  Elliott Wave maintains an uptrend. The Nov 5 high could be the end of Wave [iii]…that said, the low last Wednesday could have been the end of Wave [iv] as well. Once the first minor wave completes, we’ll have a better idea of potential targets.

Technical analysis of daily SPX prices

SPX Elliott Wave Analysis for the Week of November 14 2021

COMMENTARY
Inflation? Inflation.

As expected (at least if you read this blog), inflation readings continue to come in above expectations on both ends of the economic spectrum. The Producer Price Index (PPI), which measures the inflation seen by people that make something, came in at a whopping 8.6% year over year. The Consumer Price Index (CPI), which measures the price increases that you and I see when we buy something, increased 6.2% y-o-y. This figure is referred to as the “headline” CPI number or “total” inflation.

When you hear or read about the U.S. Fed’s inflation target of 2%, that refers to “Core CPI”. Core CPI excludes food and energy prices from the calculation, because those goods tend to have volatile prices. This omission usually provides the Fed some wiggle room, because inflation levels are almost always lower when you remove two of the biggest components. But even Core CPI rose 4.6% y-o-y, so that measure doesn’t provide the Fed any cover at the moment.

The insidious part about inflation is the impact; what it leaves in its wake.  Next year, prices could be just slightly above today’s level, which would show something like 1% inflation y-o-y. The Fed could claim that all is well!  Prices have stopped going up, and inflation was indeed transitory.

For consumers, the sting of inflation remains, because the prices that we pay are still “high”; they’re just not getting any “higher”. The actual impact of inflation is only transitory for you and me if prices go back down to earlier levels, which requires deflation and deflationary policy.

What does all this mean for your investments?

Near-term, the U.S. economy and inflation are likely to continue their rise.  In that type of environment, stocks and commodities would continue doing well.  As far as sectors are concerned, industrial, technology, and energy would benefit.

Eventually, the inflation numbers will begin to decline, if for other reason than the comparison with 2021’s higher than normal increases.  At that point, growth will be the wildcard.  If economic growth continues, then stocks remain good plays.  If growth slows, then equities aren’t as attractive overall, and defensive sectors like utilities likely to outperform.  In both cases, your asset allocation strategy is key (assets, sectors within asset classes, strategies, etc.).

Best to Your Week!


Invest Safely, LLC is an independent investment research and online financial media company.  Use of Invest Safely, LLC and any other products available through invest-safely.com are subject to our Terms of Service and Privacy Policy. Not a recommendation to buy or sell any security.
Posted in Historical Data, Market Trends | Tagged , , , , | Comments Off on Weekend Stock Market Outlook – November 14 2021

Weekend Stock Market Outlook – November 07 2021

Stock Market Outlook entering the Week of November 7th = Uptrend

    • ADX Directional Indicators: Uptrend
    • Price & Volume Action: Uptrend
    • Elliott Wave Analysis: Uptrend

ANALYSIS
The stock market outlook remains in an uptrend, as the S&P500 ($SPX) accelerated higher the first week in November.  The past 5 trading days added another 2% to the S&P’s already impressive October performance. The index sits ~11% above the 200-day, and 5% above the 50-day. Year to date, the S&P500 is up an impressive 25%.

Technical analysis of daily SPX prices

SPX Price & Volume Chart for the Week of November 07 2021

The ADX shows bullish price action and trend, as does price/volume.

Technical analysis of daily SPX prices

SPX Technical Analysis for the Week of November 07 2021

Elliott Wave still shows an uptrend; the 3rd wave of Minor wave 1 rolls on.

COMMENTARY
As signaled for several months, the U.S. Federal Reserve will start to taper monthly bond purchases, reducing them by $15 billion per month. They’re starting from $120 billion per month, so the program won’t be completely stopped until next June.

But the Fed still sees inflation as transitory, so there’s no rush to raise interest rates. Basically, this means that the Fed will continue to provide stimulus to the economy, just not as much as they have been.

Historically, November and December are positive months for the S&P. Add the better than expected October jobs report, and you’ve got good reason to be bullish heading into 2022.

But don’t blindly chase! The VIX hit 15 mid-week, which has been the low end of it’s price range for some time now. The S&P’s price level, relative to the 200 day, is also extended. So use consolidations and corrections to your advantage, knowing that they have a high probability of being a buy the dip opportunities.

Best to Your Week!


Invest Safely, LLC is an independent investment research and online financial media company.  Use of Invest Safely, LLC and any other products available through invest-safely.com are subject to our Terms of Service and Privacy Policy. Not a recommendation to buy or sell any security.
Posted in Historical Data, Market Trends | Tagged , , , , | Comments Off on Weekend Stock Market Outlook – November 07 2021

Weekend Stock Market Outlook – October 31 2021

Stock Market Outlook entering the Week of October 31st = Uptrend

    • ADX Directional Indicators: Uptrend
    • Price & Volume Action: Uptrend
    • Elliott Wave Analysis: Uptrend

ANALYSIS
The stock market outlook remains in an uptrend. Happy Halloween!

Technical analysis of daily SPX prices

SPX Price & Volume Chart for the Week of October 31 2021

The S&P500 ($SPX) continued higher to close out October. The index now sits ~9% above the 200-day, and 3% above the 50-day. Over the past 19 trading days, the S&P rose ~325 pts (~7.5%). If that pace continues over the rest of 2021 (43 trading days left), the S&P would end the year near 5300!

The ADX and price/volume indicators remain bullish, and the index added 1 distribution day last week.

Technical analysis of daily SPX prices

SPX Technical Analysis for the Week of October 31 2021

Elliott Wave still shows an uptrend; appears to be the 3rd wave of a Minor 1 wave. A small divergence developed in the RSI; a short, 4th wave correction isn’t out the question near term.

COMMENTARY
While September and October lived up to their reputation as volatile months, October gave investors a lot more treats than tricks this year. Essentially hitting the low on the first trading day, the S&P rallied higher for most of the month!  Not even the disappointing results from Amazon and Apple or rising treasury yields were enough to slow it’s roll.

A little over half of the S&P500 has reported earnings so far, and Q3 earnings continue to exceed expectations (some big tech names notwithstanding).

The biggest issue facing the economy right now isn’t COVID or infrastructure spending packages. It’s the supply chain; more specifically throughput. There’s either too much supply verses the capacity to move it, or there’s not enough supply to meet demand. Underpinning both are labor issues. And unfortunately, there are no easy fixes…let alone quick ones.

With the S&P at all time highs, last week was an excellent time for some profit taking / asset reallocation. The smart move was to prune your winners and move the profits to other areas that were taking a break. That could have been something like commodities, if that’s part of your portfolio.  Or, if you’re focused on stocks, it could have been something like energy/financial sector ETFs…even the Russell 2000 index.

Happy Halloween and Best to Your Week!


Invest Safely, LLC is an independent investment research and online financial media company.  Use of Invest Safely, LLC and any other products available through invest-safely.com are subject to our Terms of Service and Privacy Policy. Not a recommendation to buy or sell any security.
Posted in Historical Data, Market Trends | Tagged , , , , | Comments Off on Weekend Stock Market Outlook – October 31 2021