Weekend Stock Market Outlook – April 24 2022

Stock Market Outlook entering the Week of April 24th = Downtrend

    • ADX Directional Indicators: Downtrend
    • Price & Volume Action: Downtrend
    • Elliott Wave Analysis: Downtrend

ANALYSIS
As you might have guessed, the stock market outlook shifted back to a downtrend on Thursday last week.

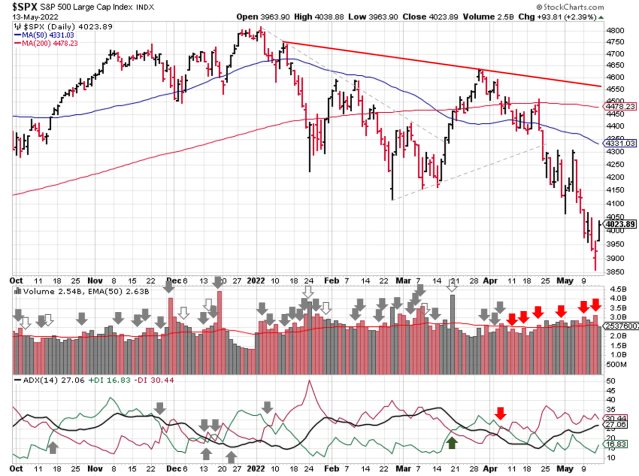
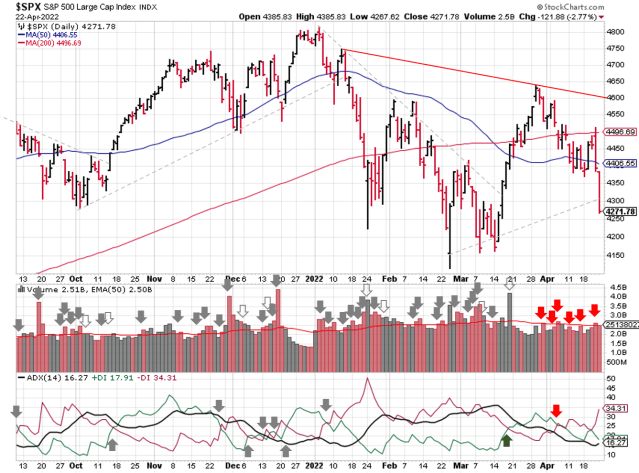
The S&P500 ($SPX) dropped 2.7%…that’s just short of 5% in the past two weeks. The index started off well, rallying from support at the 50-day moving average to 200-day. From there, the index fell back to the 50-day on higher volume and then kept falling into the close on Friday.

Technical analysis of daily SPX prices

SPX Price & Volume Chart for the Week of April 24 2022

The ADX is still below 20, so the trend is weak, but the directional indicators are bearish.

The price/volume signal shows a downtrend in place. Institutional investors sold after late-March rally, evidenced by many distributions days during the past 5 weeks. Thursday’s session ticked the box mentioned last week, in terms of distribution days and price action needed to shift the signal.

Technical analysis of daily SPX prices

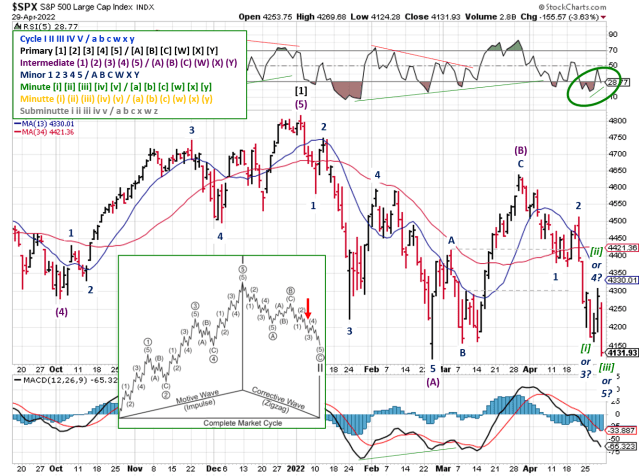
SPX Elliott Wave Analysis for the Week of April 24 2022

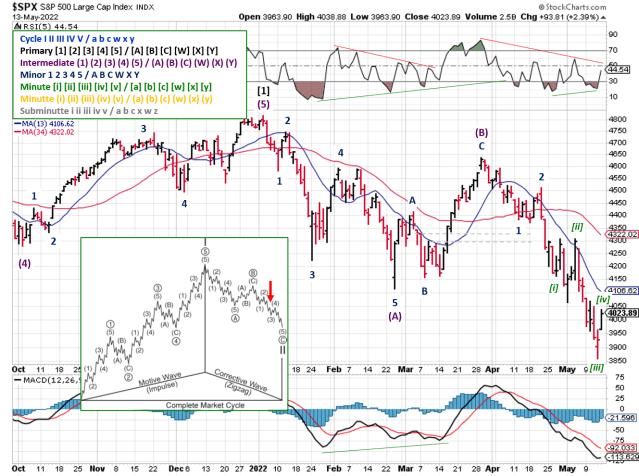
Elliott Wave confirmed the downtrend as well, although the Minor 2 was shorter than expected. Overall, Primary 2 is acting like zigzag corrective wave (5 waves down, 3 waves up, 5 waves down). We’ll have to see what price action is like this week, but the current Minor 3 kicked off with a lot of volatility, just like the past Minor 3 in mid-January.

COMMENTARY
The Fed continues to talk about its inflation fight, and Powell confirmed a 0.5% rate hike is on the table for May.  Based on the last announcement, he’s probably telling everyone that the Fed will hike rates 0.5%, without actually saying it.

There is a growing expectation that the Fed will hike rates until “something breaks”, and the 2022 Fed Funds Futures is pricing in 10 rate hikes.  I expect something to break before we get there, but stranger things have happened.

As you can see above, this week is jam packed with the earnings releases of companies that are widely held by all sorts of investors.  There are several names from the Dividend Aristocrats and Dividend Kings lists, as well as 4 of the 5 largest components of the S&P reporting:

  • Apple = ~7% of the index’s total value
  • Microsoft = ~6%
  • Alphabet = ~4% (Class A + Class C Shares)
  • Amazon = ~4%

If last week was any indication, we’re in for a lot of volatility this week.  Weak earnings are one thing, but lowering guidance or mentioning headwinds and slow downs will cause investors to press the sell button;  HCA Healthcare ($HCA) and Verizon ($VZ) come to mind.

If you’re looking for shelter from the inflation storm, energy, utilities, and consumer staples will probably be the “least bad”, while technology and consumer discretionary get hurt the most.

Several readers emailed me last week, commenting that their signaling process had already shifted to a downtrend and/or bearish outlook.  I think that’s fantastic! One, because they made some moves that saved them from losing money. And two, because they created a process and executed it!

This stock market outlook is just an example of how to evaluate market conditions, as well as how to make improvements over time.  It’s better than nothing, but use it as a tool to get you started.  Every investor has a different situation and different needs, so every investor needs their own process with their own signal(s) for the things they are trading.

Best To Your Week!


Invest Safely, LLC is an independent investment research and online financial media company.  Use of Invest Safely, LLC and any other products available through invest-safely.com are subject to our Terms of Service and Privacy Policy. Not a recommendation to buy or sell any security.
Posted in Historical Data, Market Trends | Tagged , , , , | Comments Off on Weekend Stock Market Outlook – April 24 2022

Weekend Stock Market Outlook – April 17 2022

Stock Market Outlook entering the Week of April 17th = Uptrend

    • ADX Directional Indicators: Downtrend
    • Price & Volume Action: Mixed
    • Elliott Wave Analysis: Mixed

ANALYSIS
The stock market outlook remains unchanged from last week; an uptrend while we wait for confirmation of a change. Short update this week, on account of the Easter Holiday.

The S&P500 ($SPX) fell 2.1% for the week, unable to break free from the pull of the 50-day moving average.

Technical analysis of daily SPX prices

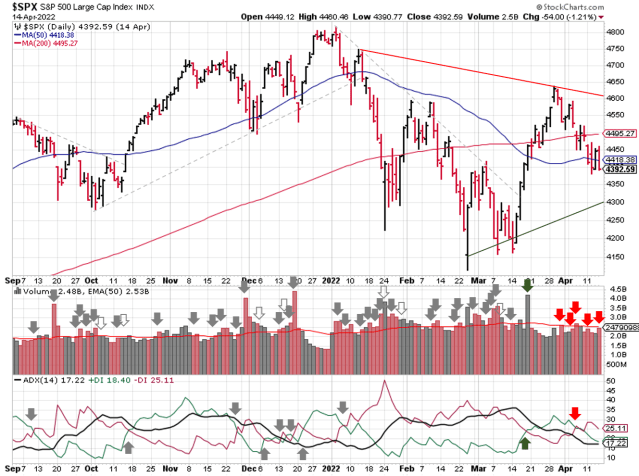
SPX Price & Volume Chart for the Week of April 17 2022

The ADX remains continues to signal a downtrend with the directional indicators growing more bearish over the week.

The price/volume signal shifts from an uptrend to mixed. SPX dropped below the 50-day moving average, and also closed below the April 18 follow-through day.  Distribution days are also piling up (5), so a down day this week on elevated volume would put this signal into a downtrend, as well as the overall outlook.

Technical analysis of daily SPX prices

SPX Elliott Wave Analysis for the Week of April 17 2022

For Elliott Wave, the count remains mixed.  The bounce back to 4650 didn’t happen.  Instead, the SPX added a 5th wave down, and appears to have completed an impulse wave (rather than a corrective wave).  Which means the March 29th high was the likely end of our bear market rally.  If so, Minor Wave 2 should now take the market back towards 4650.

COMMENTARY
We got Consumer Price Index (CPI) data last week, and it showed that inflation remains high (duh).

Not to be outdone, the Producer Price Index numbers (PPI) came in at an all time high: 11.2% year-over-year!  Those increases haven’t hit consumers yet.

The “good” news, if you can call it that, is inflation has probably peaked unless there’s a massive shock. For y-o-y figures to continue rising, the price of oil needs to reach 180+.  If that happens, we’ll have things other than inflation to worry about.

Q1 earnings continue this week, with Bank of America, Tesla, and Netflix reporting.

Last week, Taiwan Semiconductor Manufacturing (TSM) crushed their numbers for the first quarter AND guided higher for Q2.  TSM gapped up at the open, and then sold off throughout the day, ending down ~3%.  If we were in a strong bull market, that wouldn’t have happened.

Best To Your Week!


Invest Safely, LLC is an independent investment research and online financial media company.  Use of Invest Safely, LLC and any other products available through invest-safely.com are subject to our Terms of Service and Privacy Policy. Not a recommendation to buy or sell any security.
Posted in Historical Data, Market Trends | Tagged , , , , | Comments Off on Weekend Stock Market Outlook – April 17 2022

Weekend Stock Market Outlook – April 10 2022

Stock Market Outlook entering the Week of April 10th = Uptrend

    • ADX Directional Indicators: Downtrend
    • Price & Volume Action: Uptrend
    • Elliott Wave Analysis: Mixed

ANALYSIS
The stock market outlook remains in an uptrend while we wait for confirmation of its next move. The signal could go either way based on market action this week.

The S&P500 ($SPX) fell 1.3% for the week. The index remains above the 50-day moving average, but did break the 200-day before coming to rest at that level to end the week.

Technical analysis of daily SPX prices

SPX Price & Volume Chart for the Week of April 10 2022

The ADX fell below 20, meaning the market is no longer trending.  The directional indicators crossed over mid-week, and remained bearish by a few tenths of a point.

Price and volume wasn’t much help either.  The index is still above the 50-day while 2 distribution days popped up.

Technical analysis of daily SPX prices

SPX Elliott Wave Analysis for the Week of April 10 2022

Elliott Wave is still mixed, since the SPX is still between confirmation levels.  4650 – 4670 to the upside and 4300 to the downside, though a close below 4416 would probably be enough.

COMMENTARY
The U.S. Federal Reserve released minutes from their March meeting last week.  There’s nothing truly “new”; instead, the minutes show the likely path the Fed will take to try and lower inflation.

In addition to 0.5% rate hikes, which are now more probable rather than just a possibility, Fed members are in agreement on reducing the Fed’s balance sheet (so-called Quantitative Tightening).  Per Bloomberg, the treasury market is pricing in ~9 rate quarter-point rate hikes by the end of 2022!  Seems unlikely, but stranger things have happened…

Markets are closed for Good Friday, making this a shorter trading week. But that doesn’t mean there aren’t opportunities for fireworks. March CPI data will be released Tuesday before market open, and retail sales come out on Thursday.  And members of the Fed have speeches almost every day! So the stock market gets a few chances to show us what’s already being priced in versus what still needs to be digested.

Q1 earnings season also kicks off this week, with several major banks reporting on Wednesday and Thursday).

And finally, the third Friday in April is options expiration, so monthly/weekly option expiration will shift to Thursday due to the market closure.

Best To Your Week!


Invest Safely, LLC is an independent investment research and online financial media company.  Use of Invest Safely, LLC and any other products available through invest-safely.com are subject to our Terms of Service and Privacy Policy. Not a recommendation to buy or sell any security.
Posted in Historical Data, Market Trends | Tagged , , , , | Comments Off on Weekend Stock Market Outlook – April 10 2022

Weekend Stock Market Outlook – April 02 2022

Stock Market Outlook entering the Week of April 2nd = Uptrend

    • ADX Directional Indicators: Uptrend
    • Price & Volume Action: Uptrend
    • Elliott Wave Analysis: Mixed

ANALYSIS
The stock market outlook starts Q2 in an uptrend. The question is how long it will stay that way.  The S&P500 ($SPX) continues to trade above the 50 and 200 day moving averages, but only managed to climb 0.1% for the week.  During the first quarter of 2022, the index dropped ~4.6%.

Technical analysis of daily SPX prices

SPX Price & Volume Chart for the Week of April 03 2022

Two of the three indicators used for the stock market outlook (ADX & price/volume) remain bullish.

Technical analysis of daily SPX prices

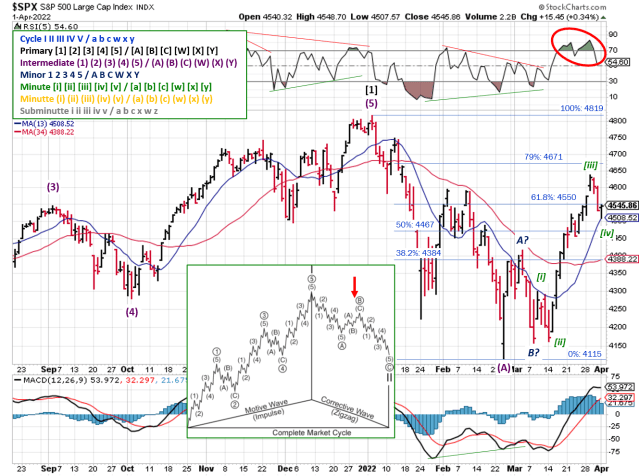
SPX Price & Volume Chart for the Week of April 03 2022

Elliott Wave shifts to mixed, with the current wave count suggesting the downtrend is back underway or will be shortly. The SPX met retracement requirements for a typical B-wave, so Tuesday’s high could mark the end of the bear-market rally.

There wasn’t a divergence in the RSI or the MACD.  Even though divergences aren’t a must-have, they’re useful confirmations.  The RSI actually made a higher high, which is usually associated with a 3rd wave. That’s shown in the chart and puts the SPX in a Minute [iv].

Based on that analysis, I’m looking for one more run at the 4650 – 4670 before the Minor C / Intermediate B-wave completes.  A drop below 4300 invalidates the [iv], and means that Tuesday’s high was indeed the completion of Intermediate B and the uptrend.

COMMENTARY
Guessing you heard something about the yield curve last week? If not, the “tens and twos” inverted, meaning that the yield on the 10-year treasury note was lower than the yield on the 2-year treasury note.

Normally, financial conditions farther out into the future are more uncertain, which means more risk of loss. To compensate, investors require higher yields. When the curve (or sections of it) inverts, the bond market expects higher uncertainty in the near term.

Right now, the curve appears to be adjusting to the Fed’s rate hike plans. The 3-month sits just above the rate set by the Fed (~.25%) and the 2-year yield is ~2.45%, which is basically where the Fed wants to be after all their rate hikes.

Last week’s jobs report contained all kinds of “positive” information: unemployment fell to 3.6%, average hourly earnings increased by 5.6% year-over-year, and labor force participation is climbing. These figures will be used as a sign that the economy is doing well, supporting the Fed’s planned rate hikes.

But you know the name of the game is really GDP.  If GDP is on the rise, then tightening monetary conditions will be uncomfortable but tolerable; the so-called “soft landing” mentioned by the talking-heads.  If GDP is dropping, then tightening monetary conditions will be very painful and cause a lot of asset classes to lose value.  In that case, better to run through your diversification checklist and resulting asset allocations before that happens.

In terms of stocks, you may find some cover in sectors like consumer staples, health care, and utilities, but that’s not a guarantee.  Each cycle is different.

And diversification doesn’t necessarily mean you’ll make money; sometimes you’ll just lose less. It’s all relative. If you reference the S&P500 like most investors, then a 5% drop in the SPX is your baseline for Q1, for example. If your portfolio only lost 3%, you actually outperformed the SPX by 2%. Diversification achieved!

Finally, sometimes cash is your best/only choice.  And while it’s true that adjusting for inflation means cash is losing value, that same adjustment makes losses in the stock market even worse.

Best To Your Week!


Invest Safely, LLC is an independent investment research and online financial media company.  Use of Invest Safely, LLC and any other products available through invest-safely.com are subject to our Terms of Service and Privacy Policy. Not a recommendation to buy or sell any security.
Posted in Historical Data, Market Trends | Tagged , , , , | Comments Off on Weekend Stock Market Outlook – April 02 2022

Weekend Stock Market Outlook – March 27 2022

Stock Market Outlook entering the Week of March 27th = Uptrend

    • ADX Directional Indicators: Uptrend
    • Price & Volume Action: Uptrend
    • Elliott Wave Analysis: Uptrend

ANALYSIS
The stock market outlook uptrend designation remains in place for a second week, with the S&P500 ($SPX) rising 1.8%.  Can we make it three in a row?

The index rose above the 200-day moving average and stayed there.  And the three indicators (ADX, price/volume, and Elliott Wave) show bullish price action in place.  Looking good so far, but a deeper look reveals concerning undercurrents.

SPX Price & Volume Chart for the Week of March 27 2022

The biggest issue is trading volume, which decreased throughout the week.  If you discount the quarterly, monthly, and weekly option expiration on March 18, trading volume has fallen for almost the entire uptrend!  Rising prices on decreasing volume is a sign of weakness, not strength.  When there’s a lack of sell order volume, it takes a relatively low level of buying to clear out those orders and move prices higher.

Technical analysis of daily SPX prices

SPX Elliott Wave Analysis for the Week of March 27 2022

From a technical analysis standpoint, the SPX is knocking on the door of the resistance levels mentioned last week.  The 61.8% Fibonacci retracement sits 7 points above Friday’s close of 4543, and that’s a stone’s throw away from the early February resistance at 4595.  A negative divergence in the RSI(5) also popped up last week as the market made new highs.

COMMENTARY
As of Friday’s close, the SPX sits ~9% from the mid March low. Essentially, the market has halved it’s losses from the start of the year despite all the geopolitical turmoil and interest rate variability!  Mega-cap tech stocks also rebounded nicely the past 2 weeks (e.g. $AAPL, $GOOGL, $AMZN, $TSLA, etc.).

But the gains aren’t evenly distributed.  If you look at sector performance for Q1, energy ($XLE) is by far the star, gaining ~39%.  Since the S&P is down ~5%, that means it’s outperformed the index by 44%! Utilities ($XLU), and financials ($XLF) also outperformed, while telecom ($XLC), consumer discretionary ($XLY), and real estate ($XLRE) underperformed.

As we head into Q2, remember that most companies will have extremely tough year-over-year comparisons to overcome, in terms of revenue and profitability.  This is especially true for sectors like technology ($XLK) and consumer discretionary ($XLP).  And most “passive investors” are overexposed here, because the mega-cap stocks in these sectors make up a large part of most capitalization-weighted index funds.

So regardless of whether you’re bullish or bearish overall, last week was an excellent time to reallocate holdings.

Best To Your Week!


Invest Safely, LLC is an independent investment research and online financial media company.  Use of Invest Safely, LLC and any other products available through invest-safely.com are subject to our Terms of Service and Privacy Policy. Not a recommendation to buy or sell any security.
Posted in Historical Data, Market Trends | Tagged , , , , | Comments Off on Weekend Stock Market Outlook – March 27 2022

Weekend Stock Market Outlook – March 20 2022

Stock Market Outlook entering the Week of March 20th = Uptrend

    • ADX Directional Indicators: Uptrend
    • Price & Volume Action: Uptrend
    • Elliott Wave Analysis: Uptrend

ANALYSIS
Yes, you read that correctly.  The stock market outlook shifted to an uptrend after a vicious bear market rally.

The S&P500 ($SPX) soared 6.2% last week, breaking through a downward trendline and recapturing the 50-day moving average.  The index starts this week just below the 200-day moving average, since the 50 & 200 crossed the week prior.

Technical analysis of daily SPX prices

SPX Price & Volume Chart for the Week of March 20 2022

The ADX directional indicators flipped on Friday, so the ADX signal switches to bullish.

Price and volume moves back to an uptrend, after reclaiming the 50-day moving average on massive volume.  Granted, that volume came on massive options expiration ($3.5 trillion), but the signal is the signal. This time around, the case for an uptrend was supported by leading stocks breaking out of proper price patterns.

Technical analysis of daily SPX prices

SPX Elliott Wave Analysis for the Week of March 20 2022

For Elliott Wave, last week’s rally broke through resistance at 4415 and invalidates the prior wave count as well as several other potential bearish counts.

After a lot of back and forth, I’m not sure what the count is at the moment. There are bearish counts that show the SPX is “correcting” higher in the overall bear market.  There’s a bullish count showing the entire Primary 2 correction is over.  It’s possible, but not probable, given the current headwinds facing stocks. The jump in RSI reading shows a shift in price action,and the signal turns to an uptrend heading into this week.

It’s not clear if the worst has past or if this is just the eye of the storm, so to speak.  Best hypothesis is that we’re in the eye of the storm. In terms of Fibonacci levels, a B-wave (if that’s what we’re in) typically retraces 38% to 79% of Wave A.  Key levels to watch are 4550-4600 for resistance and 4158 for support.

COMMENTARY
As mentioned last week and the week prior, the 0.25% rate hike announced by the U.S. Fed was totally expected.  The fact that we did not get any surprises (i.e. 0.5% rate hike, more than a hike a meeting) was seen positively by market participants.

Shorter term, ~3.5 trillion dollars worth of options expired last week (weekly, monthly, and quarterly expiration).  This is probably the main driver of last week’s melt-up in stocks (versus the rate hike or any geopolitical news).

Even though the signal switched to an uptrend, keep an eye on your holdings.  If you haven’t done so already, use the current strength to your advantage and rebalance your holdings.  Q2 earnings season is going to be difficult for many companies, particularly technology-related names.

Best To Your Week!


Invest Safely, LLC is an independent investment research and online financial media company.  Use of Invest Safely, LLC and any other products available through invest-safely.com are subject to our Terms of Service and Privacy Policy. Not a recommendation to buy or sell any security.
Posted in Historical Data, Market Trends | Tagged , , , , | Comments Off on Weekend Stock Market Outlook – March 20 2022

Weekend Stock Market Outlook – March 13 2022

Stock Market Outlook entering the Week of March 13th = Downtrend

    • ADX Directional Indicators: Downtrend
    • Price & Volume Action: Downtrend
    • Elliott Wave Analysis: Downtrend

ANALYSIS
No change in the stock market outlook; the downtrend remains firmly in place.

The S&P500 ($SPX) lost 2.9% last week, and starts this week 6.4% below the 50-day moving average and 6.2% below the 200-day.  All three signals continue to show bearish trends unfolding.

Technical analysis of daily SPX prices

SPX Price & Volume Chart for the Week of March 13 2022

The ADX is bearish and shows that trend is actually strengthening(!). Analyzing price and volume action shows institutional selling continued to accelerate as the market dropped early last week. One bit of bullish news was that trading volume decelerated as the market fell on Friday.

Technical analysis of daily SPX prices

SPX Elliott Wave Analysis for the Week of March 13 2022

Elliott Wave shows the SPX moving through Minor 5 of Intermediate (3). Price levels to watch are 4417 on the upside and 4115 on the downside.

COMMENTARY
February CPI data was published last week and prices rose 7.9% year over year (Core CPI came in at 6.4%).  The previous reading was 7.5%, showing the inflation continues to accelerate.  And this reading DOES NOT take into account the recent moves in energy.

The new fed funds rate will be announced on Wednesday (2pm), followed by Fed Chair Jerome Powell news conference at 2:30 pm.  As mentioned last week, a 0.25% rate hike is largely priced in, so I expect any volatility to be short lived.

I thought we’d start to see year-over-year inflation readings start to decline by now, but I also thought that Russian wouldn’t invade Ukraine.  Both examples highlight the need to remain open to possibilities and adjust based on what “is” happening and how that will impact the future, versus what you think “should” be happening.

With that in mind, here’s something to watch as we move forward this year.  Ukraine / Russia are major exporters of wheat, corn, barely, and sunflower oil.  Spring planting season is just around the corner, and it’s not clear how large of an impact the war will have on Ukrainian farming.  Russia, on the other hand, faces sanctions that decrease global supply, especially if those sanctions remain in place come harvest time.

Best To Your Week!


Invest Safely, LLC is an independent investment research and online financial media company.  Use of Invest Safely, LLC and any other products available through invest-safely.com are subject to our Terms of Service and Privacy Policy. Not a recommendation to buy or sell any security.
Posted in Historical Data, Market Trends | Tagged , , , , | Comments Off on Weekend Stock Market Outlook – March 13 2022