Stock Market Outlook entering the Week of November 9th = Uptrend
- Average Directional Index: Bearish
- Institutional Activity: Mixed
- On-Balance Volume: Bullish
ANALYSIS
The stock market outlook shows an uptrend for U.S. equities, but signs of weakness are showing in the technical indicators.
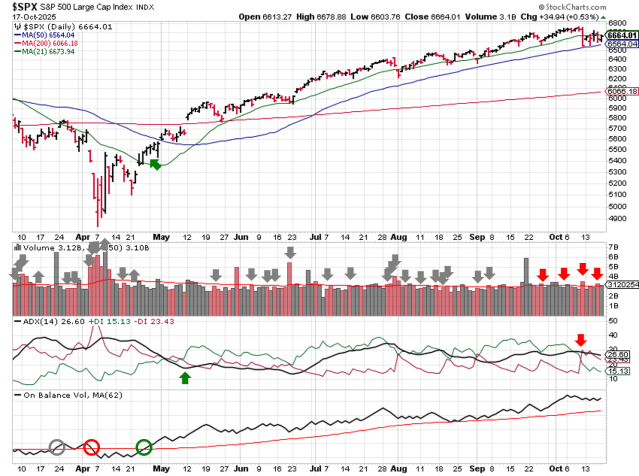
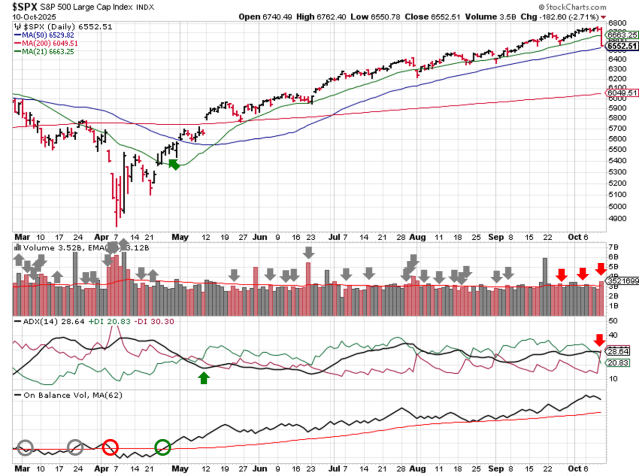
The S&P500 ( $SPX ) fell 1.6% last week. The index sits ~1% above the 50-day moving average and ~10% above the 200-day moving average.
The ADX flipped to bearish early in the week. Institutional activity shows elevated selling ( 5 distribution days ), but price recovered to 50-day moving average by Friday’s close, so the indicator is mixed into the week. On Balance Volume remains bullish. Since technical indicators are mixed, the overall outlook remains bullish for another week.
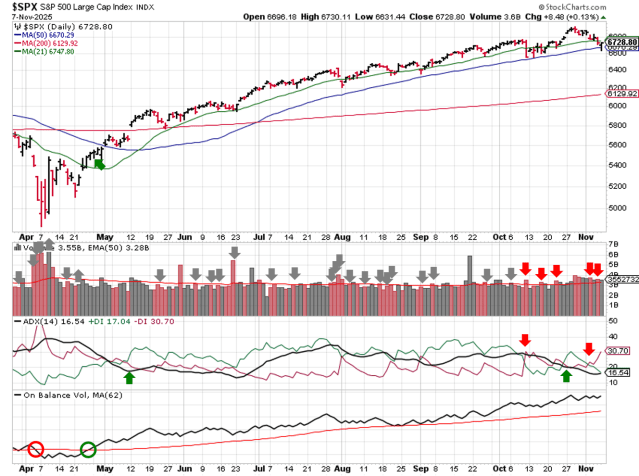
SPX Price & Volume Chart for Nov 09 2025
PERFORMANCE COMPARISONS
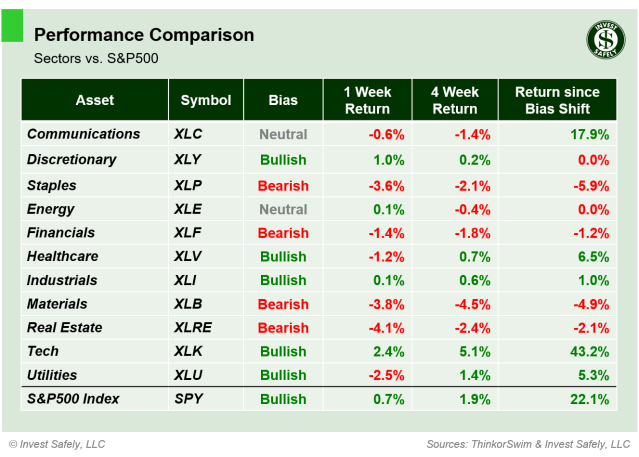
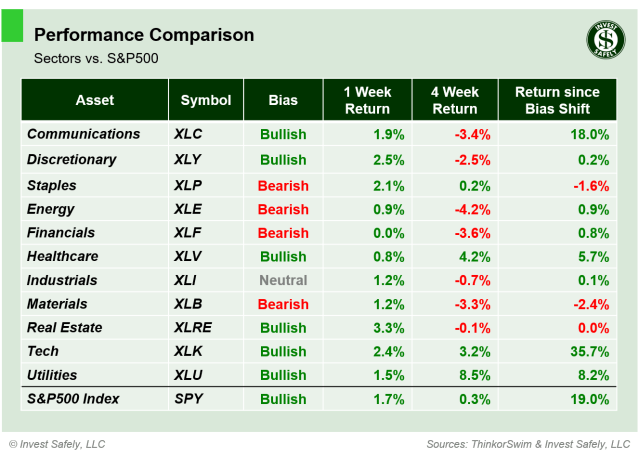
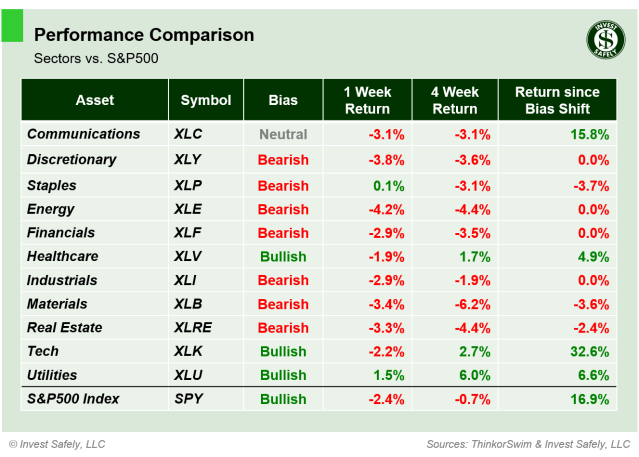
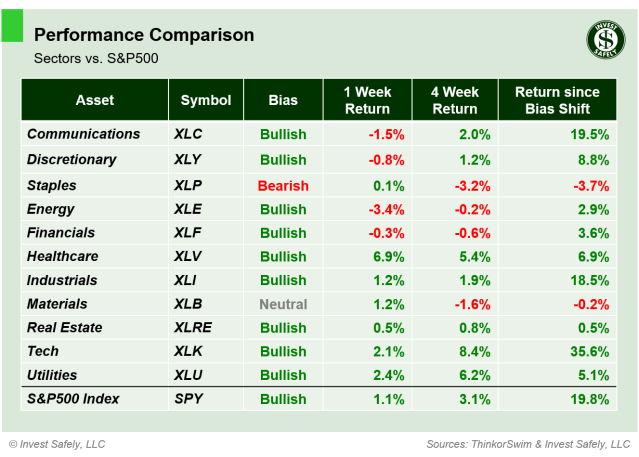
Healthcare ( $XLV ) led sectors higher, while Technology ( $XLK ) underperformed significantly.
Consumer Discretionary and Industrials ( $XLY, $XLI ) fell to neutral bias; Communications ( $XLC ) downshifted to bearish.
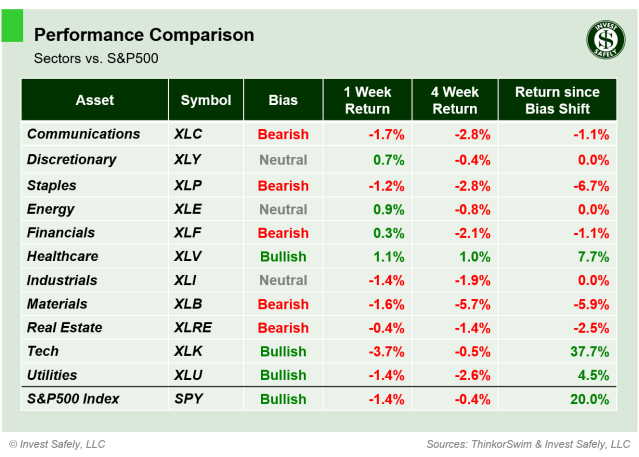
S&P Sector Performance from Week 45 of 2025
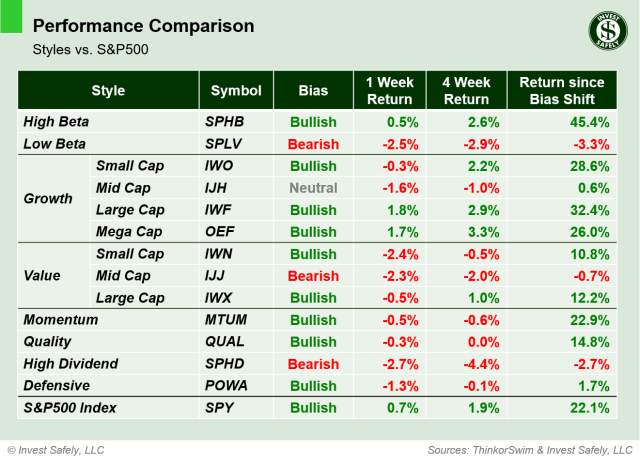
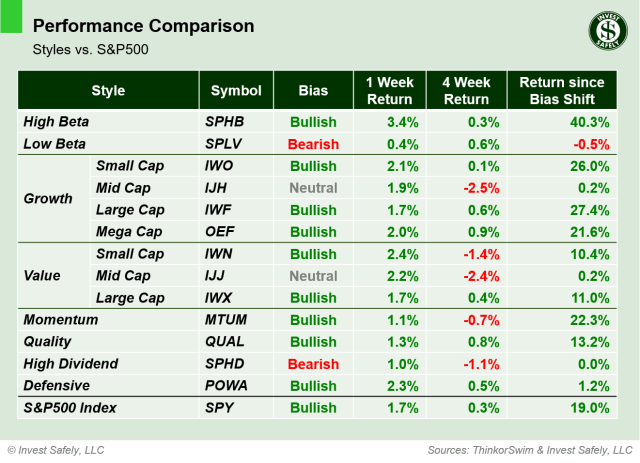
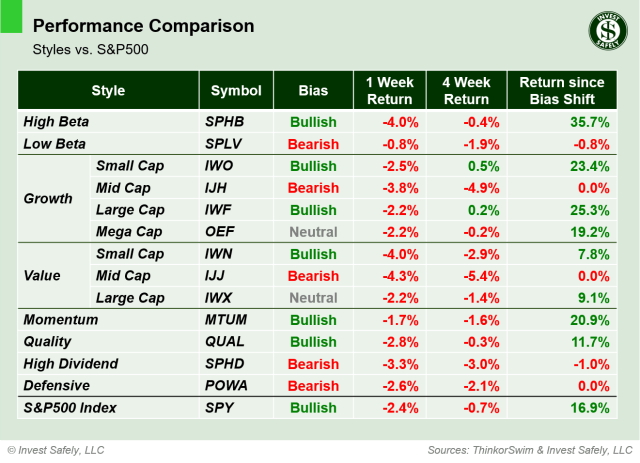
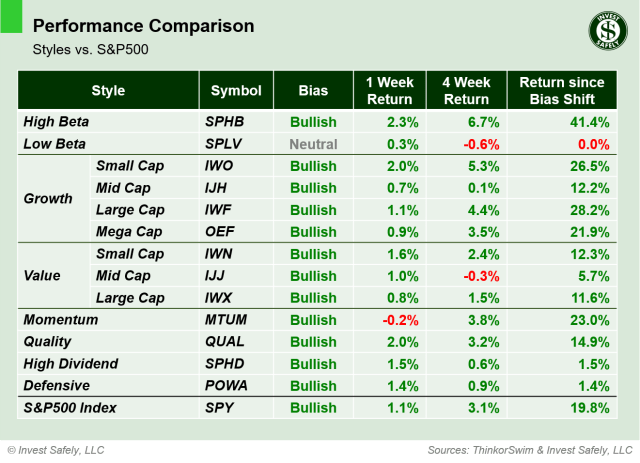
All Sector styles lost ground last week, with Momentum and Large Cap Growth ( $MTUM & $IWF) ending the week with the worst performance.
Small Cap Growth and Value, along with Quality ( $IWO, $IWN, $QUAL ) moved from Bullish to Neutral. Mid Cap Growth, Momentum, and Defensives ( $IJH, $MTUM, $POWA ) shifted to Bearish.
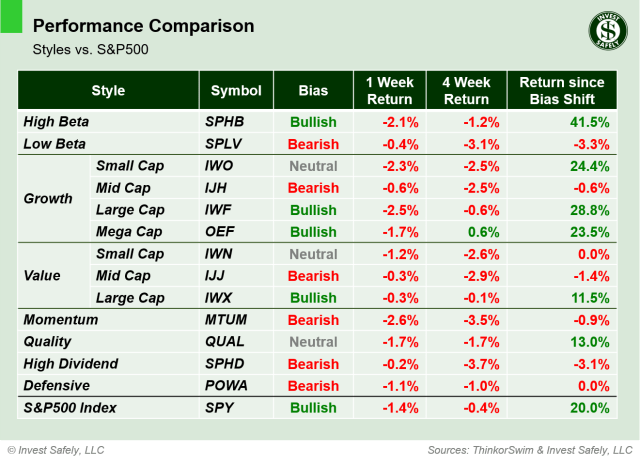
Sector Style Performance from Week 45 of 2025
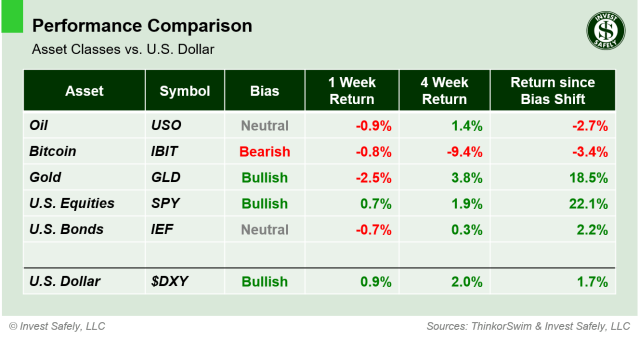
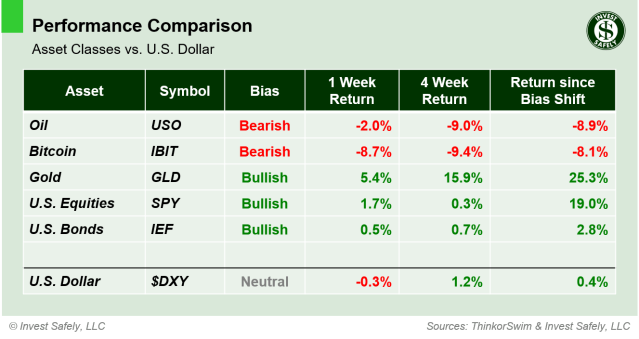
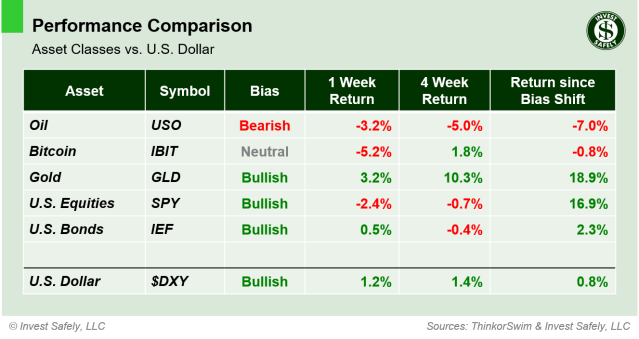
The U.S. Dollar ( $DXY ) was the best asset again last week, and continues to act as a headwind for other classes. Bitcoin ( $IBIT ) led to the downside, and is down almost 20% over the past 4 weeks. Oil ( $USO ) fell back to Bearish bias.
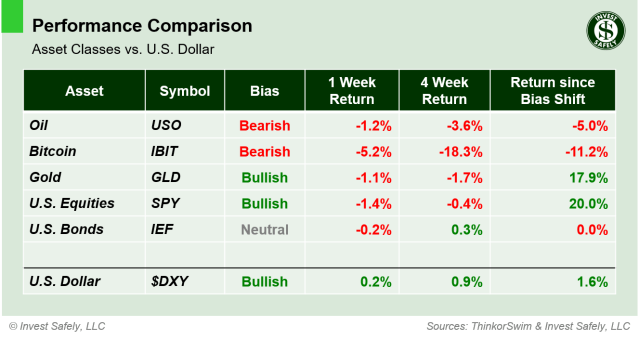
Asset Class Performance from Week 45 2025
COMMENTARY
We’ve reached an interesting junction for U.S. equity markets. Fundamentally speaking, the S&P500 index is on track for more than 10% earnings growth in the 3rd quarter ( >80% of companies have reported ). The Fed is easing; lowing short-term interest rates and ending quantitative tightening. So tailwinds are present for a year end rally.
And yet, almost half of the sectors within the S&P500 are now bearish, suggesting selling underneath the surface. As a market capitalization based index, the S&P500 is heavily influenced by the largest companies. At the moment, the 10 largest firms account ~40% of the index, and 8 of the 10 are Mag 7 ( Google has two share classes in the Top 10 ). Since they remain strong ( along with other technology companies like Broadcom ), so does the index overall, despite recent weakness in Meta ( $META ) and Microsoft ( $MSFT ).
But even with it’s heavy technology weighting, the $SPX hasn’t escaped unscathed. Price sliced through its 21-day moving average (green line in the price chart above) on elevated volume, which is a level many short-term investors use for bias. The index is now looking for support at the 50-day; more of a medium-term level.
With U.S. government still “closed” for business, it’s unlikely we’ll get October CPI/PPI data this week. Instead, the market will look to various Fed speakers to provide some kind of insight on inflation. Over the weekend, media headlines focused on the sharp increase in the cost of healthcare insurance.
Best to Your Week!
P.S. If you find this research helpful, please tell a friend.
If you don’t, tell an enemy.