Stock Market Outlook: May 10th = Uptrend
The stock market outlook shows an uptrend in place with the indexes reaching new all time highs.
Emerging Market, Technology, and Momentum outperformed; Oil, Energy, Low Beta underperformed. Employment data was better than expected, as investors now await the latest CPI/PPI inflation datasets.
TREND ANALYSIS
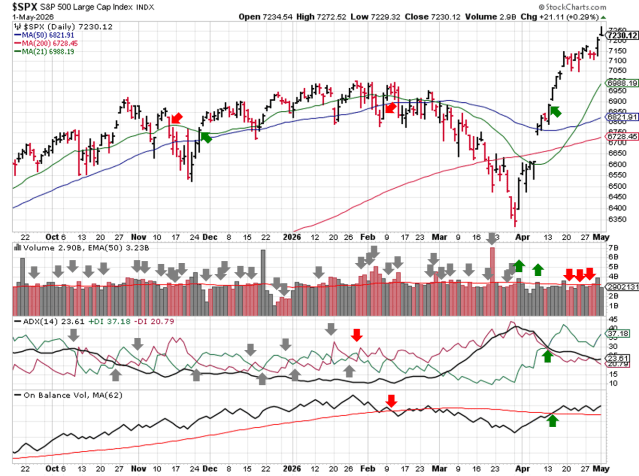
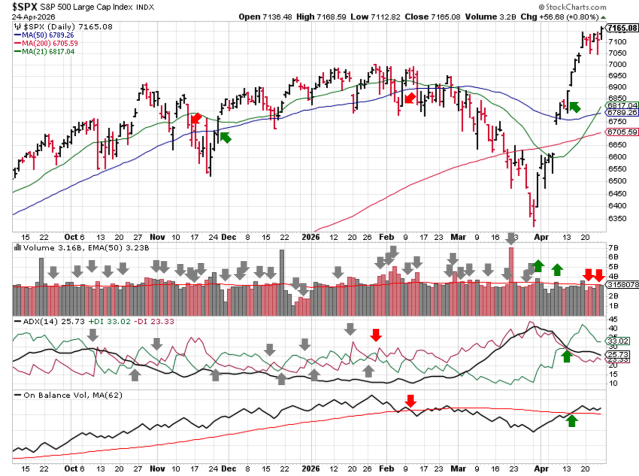
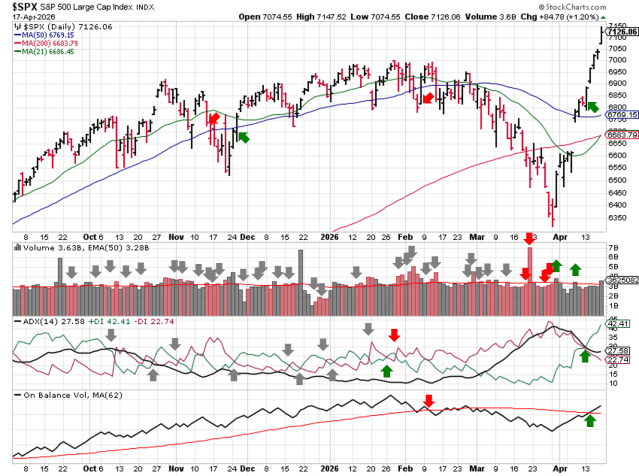
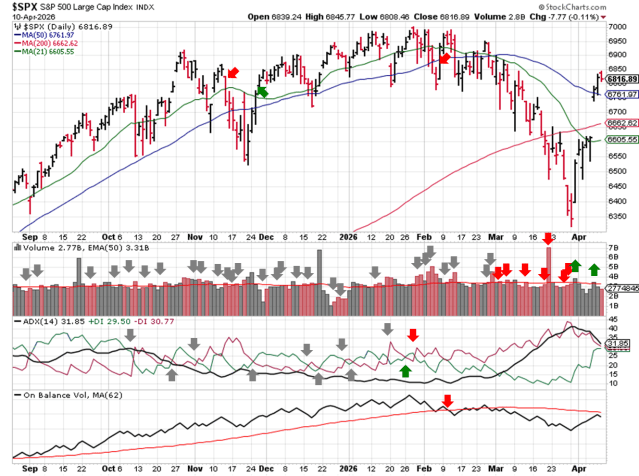
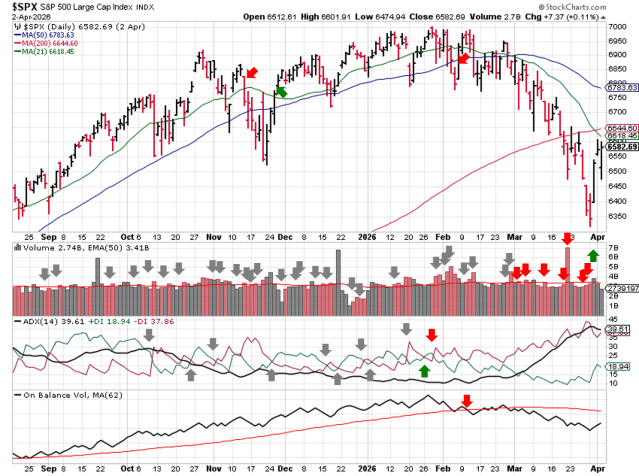
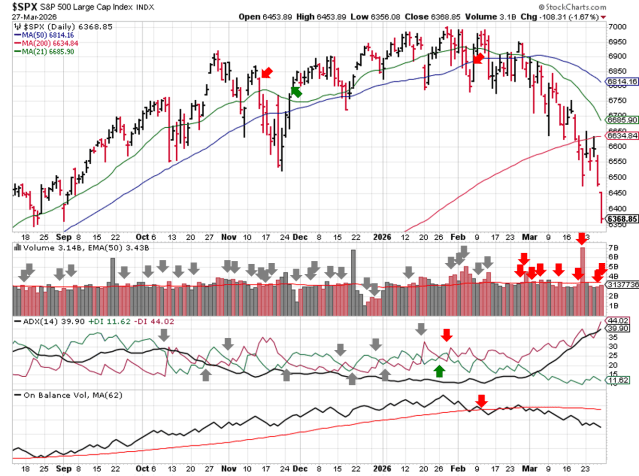
The S&P500 ( $SPX ) rose 2.3% last week, riding the recent accumulation of technology and semiconductor stocks. The index is now:
- ~8% above the 50-day moving average
- ~10% above the 200-day moving average
The three technical indicators used to identify trends remain bullish.
- Average Directional Index: Bullish
- No change
- Institutional Activity: Bullish
- Another distribution day added to the count ( 4 )
- On-Balance Volume: Bullish
- No change
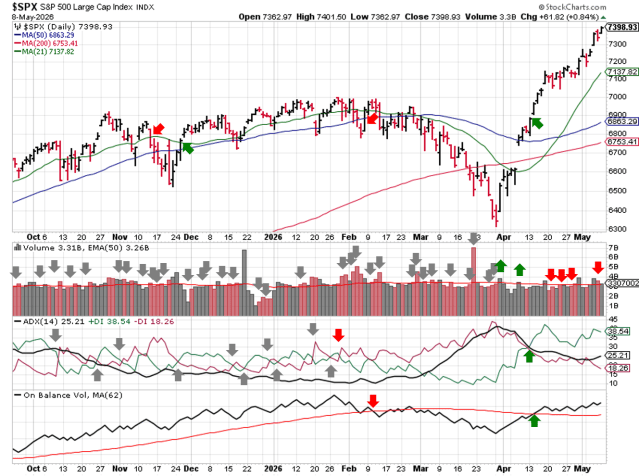
SPX Price & Volume Chart – 2026-05-10
PERFORMANCE HIGHLIGHTS & COMPARISONS
Asset Classes
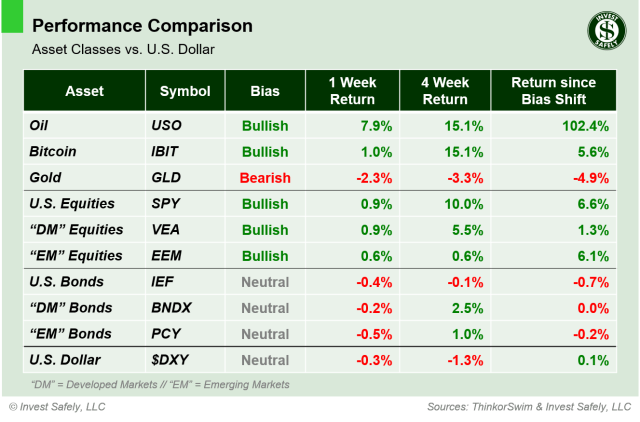
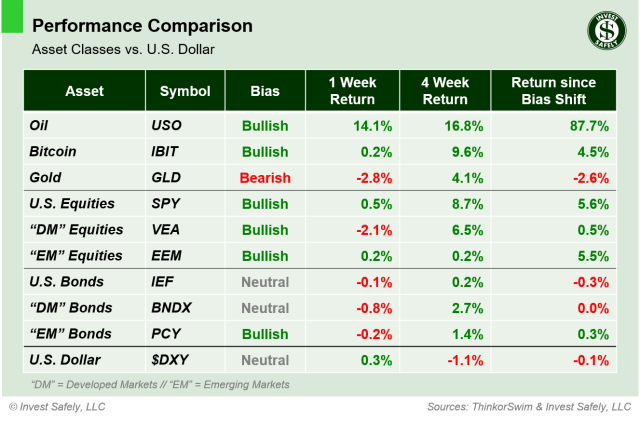
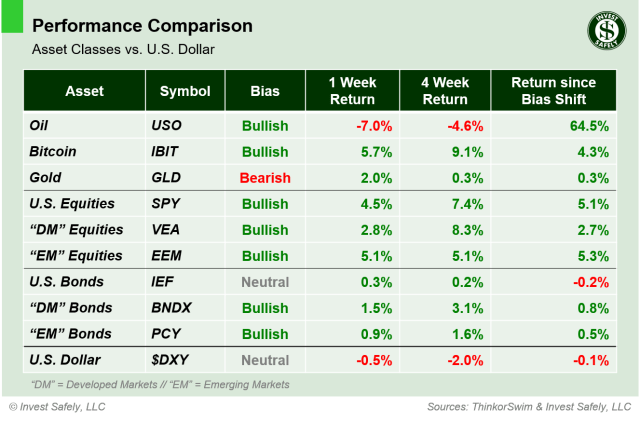
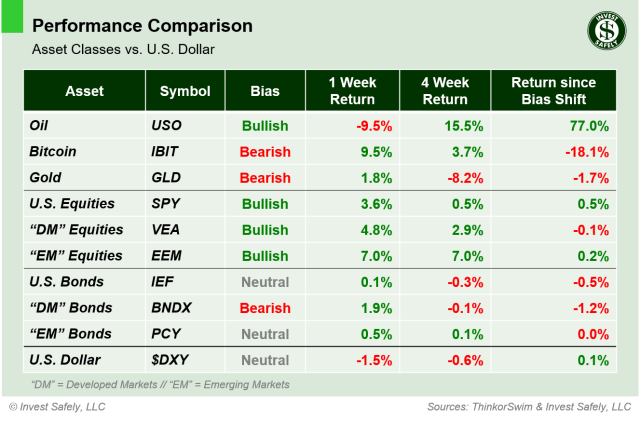
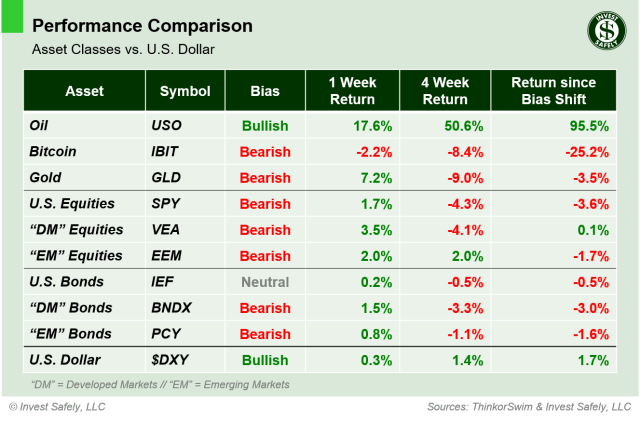
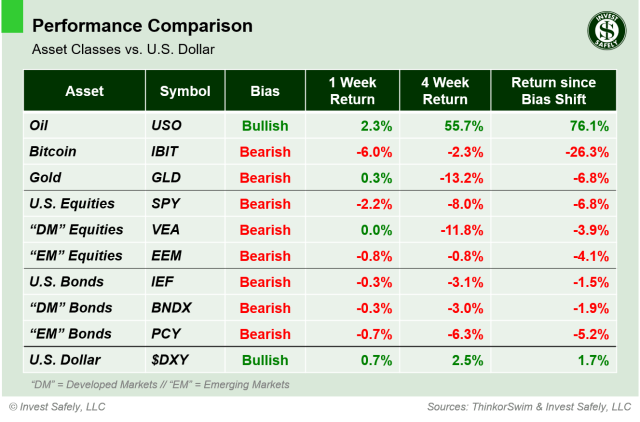
Emerging market equities ( $EEM ) led assets on the upside last week, and Oil ( $USO ) gave back some recent gains. Developed Market Bonds ( $BNDX ) moved up to bullish and the US Dollar ( $DXY) moved down to bearish bias.
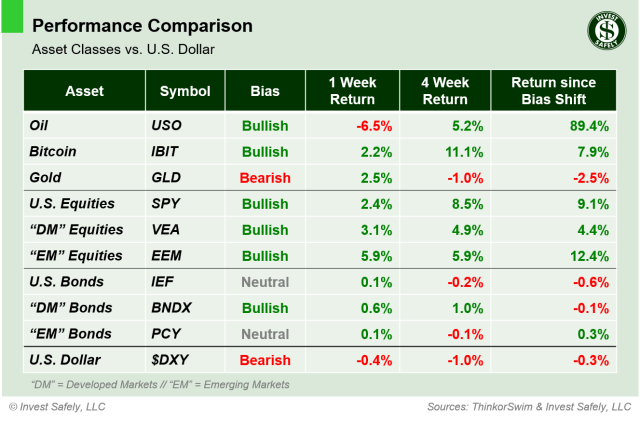
Asset Class Performance – 2026-05-10
S&P500 Sectors
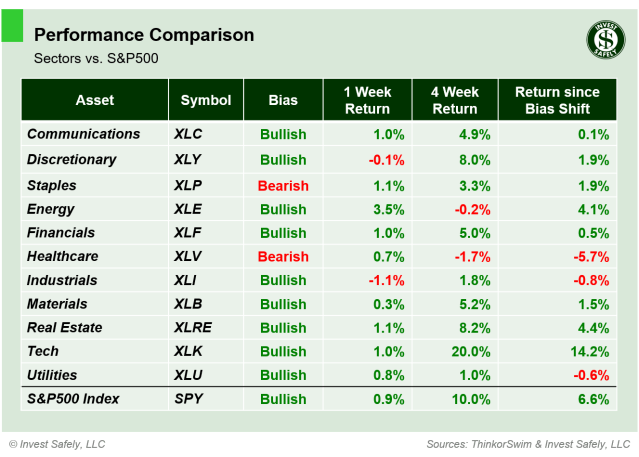
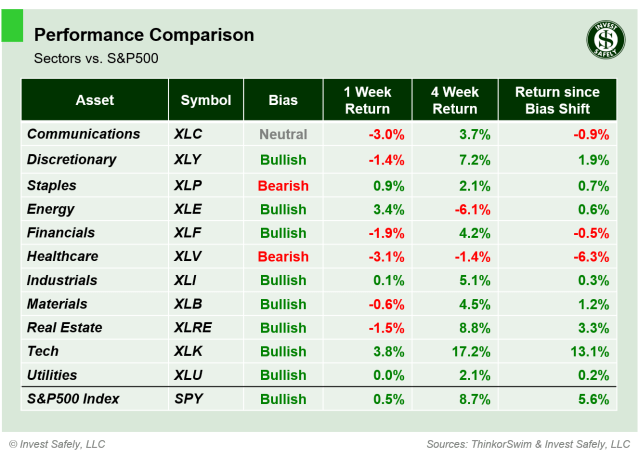
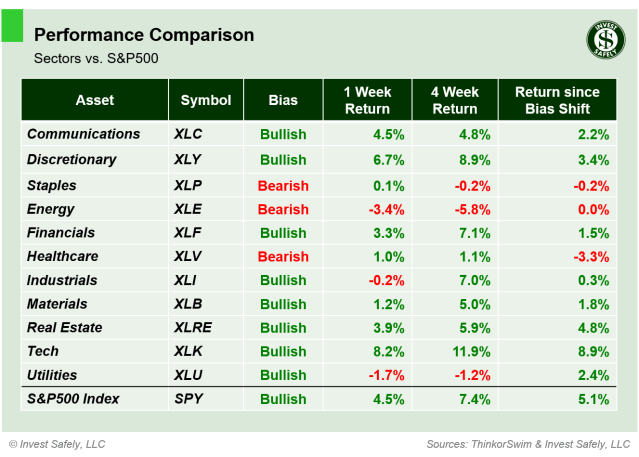
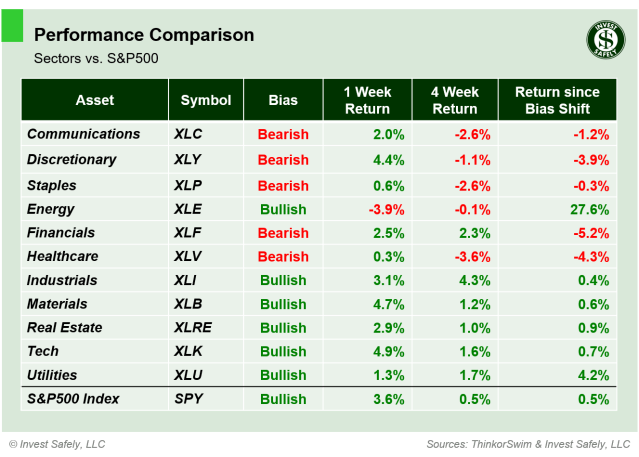
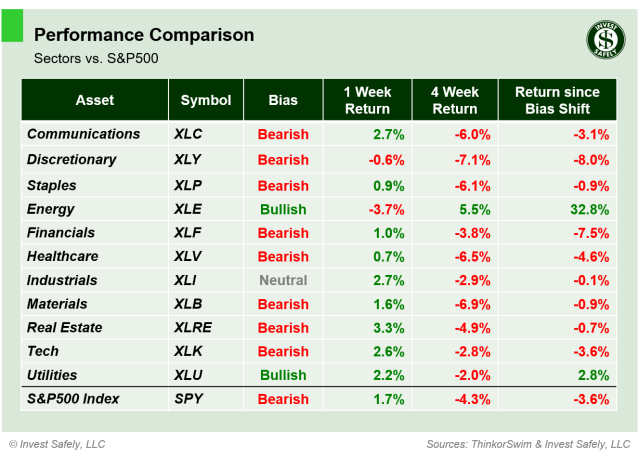
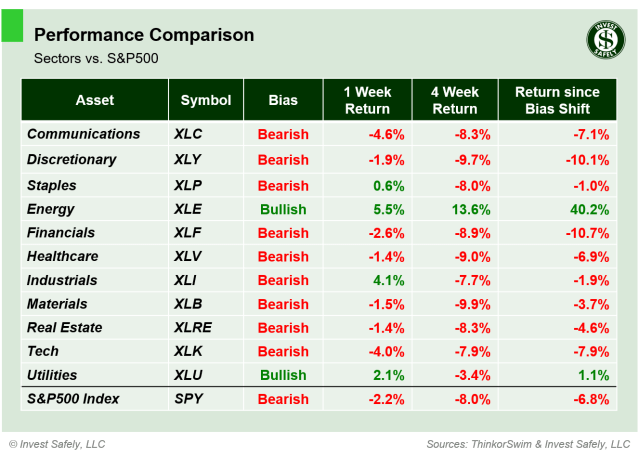
Technology ( $XLK ) outperformed all other sectors in dramatic fashion. Energy ( $XLE ) led to the downside, and dropped to bearish bias, along with Utilities ( $XLU ).
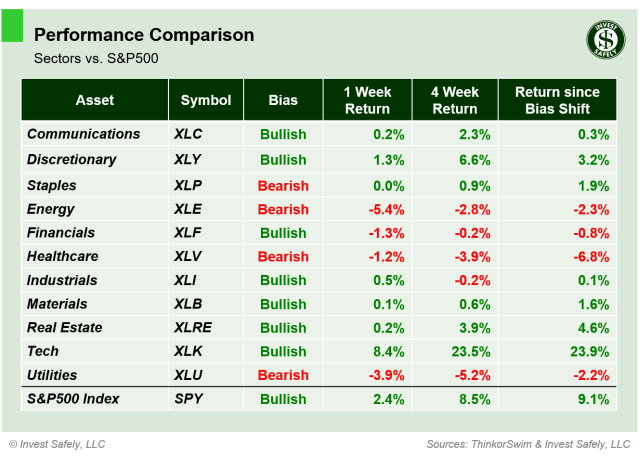
S&P Sector Performance – 2026-05-10
S&P500 Investing Styles
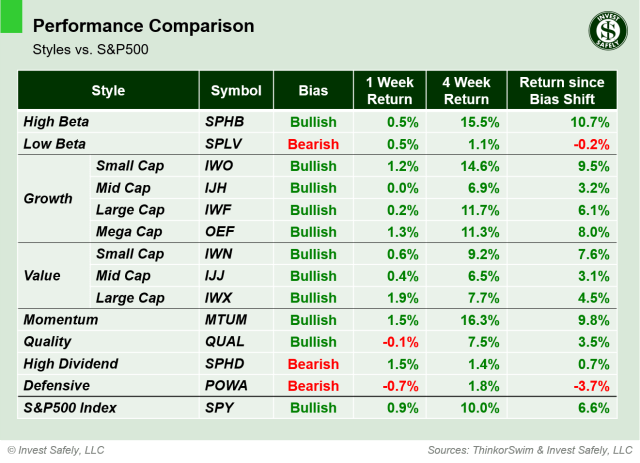
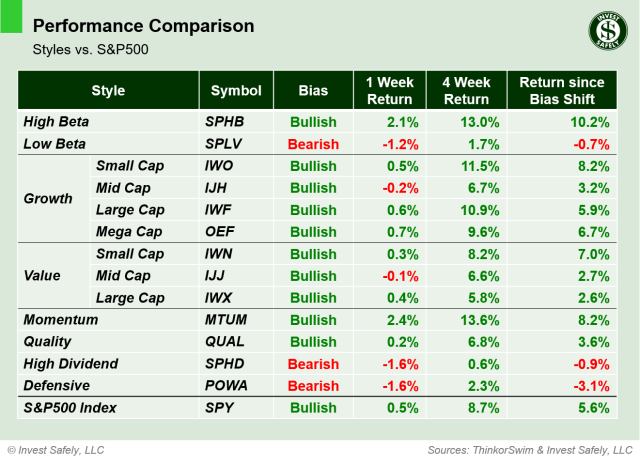
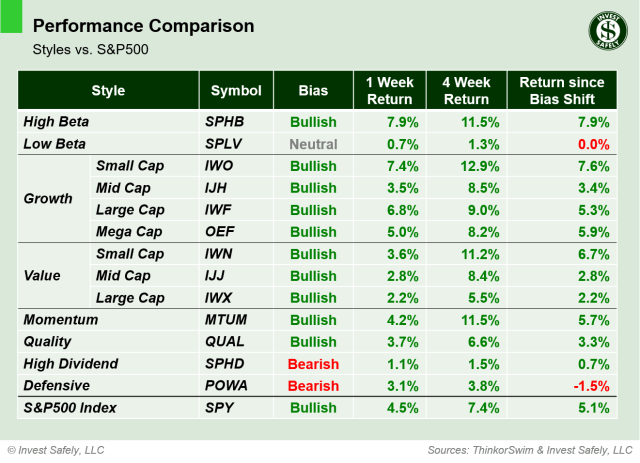
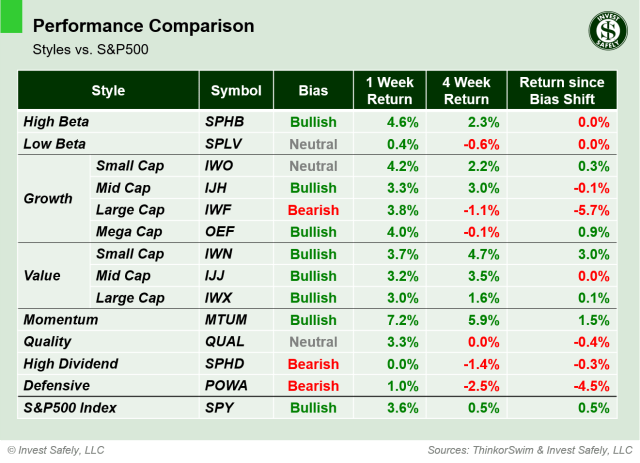
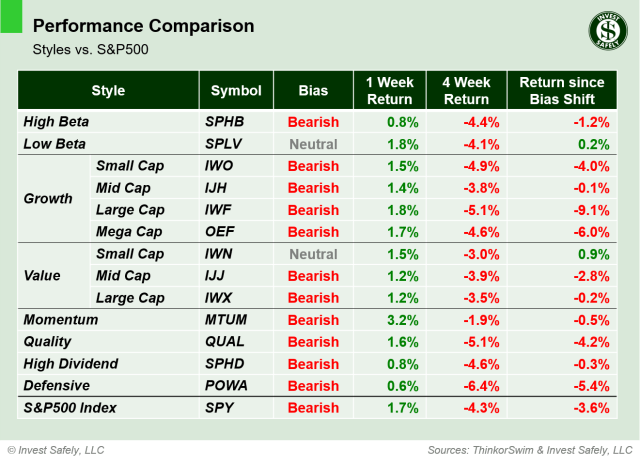
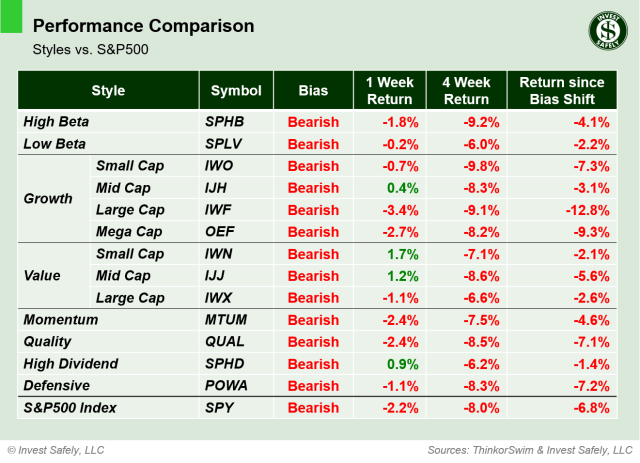
It was a risk on week in sector styles, with Momentum ( $MTUM ) and High Beta ( $SPHB ) outpacing the rest o the field. Low Beta ( $SPLV ) underperformed. There were no bias changes.
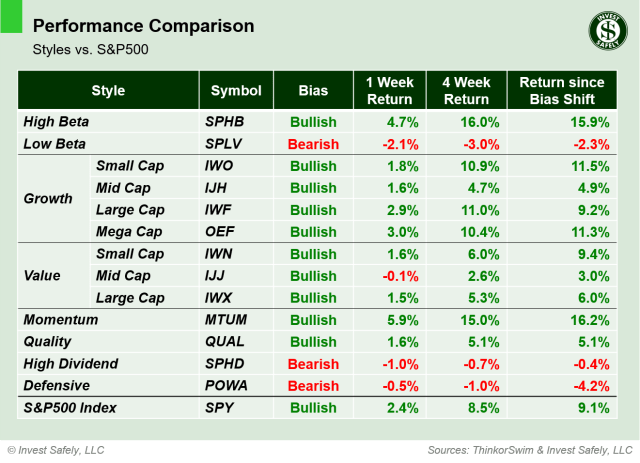
Sector Style Performance – 2026-05-10
COMMENTARY
Markets
Another week, another set of record highs for U.S. equities. As of Friday’s close, the S&P500 recorded six consecutive weekly gains, thanks in large part to the technology sector and semiconductor stocks. Even Bitcoin joined the party, after a rough 6 month stretch, while the Gold correction continues.
Macroeconomic Data & Policy
ISM Services PMI slipped slightly in April, but continues to show an expansion in place.
The latest employment data shows a “low hire, low fire” environment remains in place. March job openings (JOLTs) eased slightly, while private businesses (ADP employment) hired well above forecasts. NFP was higher year over year and exceeded expectations, despite being lower month over month.
The University of Michigan’s Consumer Sentiment Index dropped to a record low, with inflation and rising gasoline prices the major concerns.
Geopolitics
The U.S.-Iran “Maritime Conflict & Ceasefire” continues to provide financial markets with all the instability they can handle. Event-driven traders are having a field day in commodities, using various announcements and social media headlines as catalysts.
Underneath those headlines, follow-on and secondary effects from the supply chain disruption continue to grow. China’s recent export restriction on sulfuric acid adds to the current Hormuz-related shortages, and is expected to further increase prices in a wide swath of industries, from copper mining all the way to fertilizer production.
EYES ON THE HORIZON
This week provides the latest CPI/PPI datasets, along with retail sales and a tentative nomination of the new Fed Chair by the US Senate.
- Monday: —
- Tuesday: CPI, Fed Chair Nomination ( tentative )
- Wednesday: PPI
- Thursday: Retail Sales
- Friday: —
Best to Your Week!