Stock Market Outlook entering the Week of November 13th = Uptrend
-
- ADX Directional Indicators: Uptrend
- Price & Volume Signals: Uptrend
- Elliott Wave Analysis: Downtrend
ANALYSIS
The stock market outlook flipped back to an uptrend, with 2 of the 3 signals back to a bullish trend. You’re not surprised if you read last week’s outlook:
Given the current level of the VIX (below 30, above 20), don’t be surprised if the signals whipsaw back and forth.
The S&P500 ($SPX) rose almost 6% for the week, but technology stocks were the real winners with the NASDAQ ($COMP) jumping 8.1%!

SPX Price & Volume Chart for the Week of November 13 2022
The ADX started last week in bearish territory, flipped to bullish on Tuesday, back to bearish on Wednesday, then back to bullish on Thursday.
Price and volume also starts the week in uptrend territory, after a strong move past the 50-day moving average on higher trading volume.

SPX Elliott Wave Analysis for the Week of November 13 2022
Elliott Wave analysis shows the SPX just below the the 62% retracement target mentioned last week, suggesting the counter-trend rally is nearly complete.
COMMENTARY
Last week was certainly a long year! U.S. mid-term elections, CPI data for October, and the blowup of another cryptocurrency exchange were just a few of the highlights.
Despite all the warnings, no “red wave” materialized in the U.S. elections. Impact to markets? Minimal.
CPI data showed October inflation rose 7.7% year over year, which was lower than expected. Core inflation rose 6.3%, which was also lower than expected. To say that the market impact was positive is an understatement.
Then there’s crypto; specifically the implosion of FTX. FTX is an exchange used to trade various cryptocurrencies, and it filed for bankruptcy protection after experiencing the equivalent of a bank run. Since it’s not a bank, that’s a problem.
Many assume, incorrectly, that FTX (and other exchanges) provide some level of protection like brokerages and banks (read more about FDIC and SIPC protections here). They don’t.
Retail investors using the platform do so at their own risk; no guarantees, no deposit insurance, nothing. Instead, traders essentially loaned their money to FTX, in return for the opportunity to trade crypto. And FTX did as they pleased with those “loans”: salaries, investments, expenses, loans, whatever.
Last week, too many people decided to take back those loans at the same time. FTX couldn’t meet those requests, making them insolvent. At the same time, the value of their assets (mainly cryptocurrencies) plummeted, forcing the company to file for bankruptcy protection.
We saw similar movies earlier in the year, when other crypto exchanges blew up (e.g. Celsius, Voyager). The “losers” are a relatively small number of retail investors like you and me. Usually, there’s a few articles, the call for regulation, and then we collectively move on. Outside of the cryptocurrency markets, the direct impact is negligible.
But this time might actually be different! Various officials, “experts”, and celebrities were involved, whether they bought equity, received funding, and/or marketed the FTX trading platform…names you’ll recognize from the news, social media, CNBC, even the government. And they’ll all be looking to point fingers!
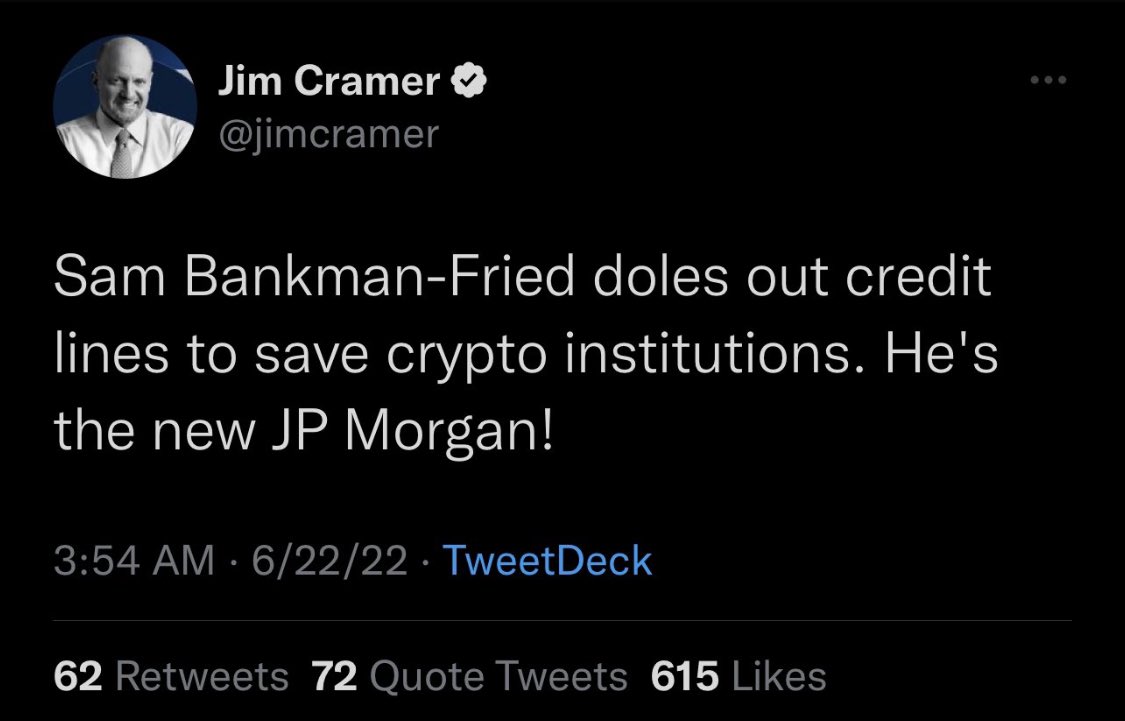
Using celebrity is a form of “classical conditioning”. You attribute the qualities of celebrity to the brand; in this case FTX and or it’s founder Sam Bankman-Fried. That type of marketing leads to a false sense of security and leads to poor decision making. We don’t know (yet) is how many institutions, non-retail investors, and creditors were caught up in the marketing and will need to take a loss?
I’ve seen one so far: the Ontario Teacher’s Pension Fund. Pension funds shouldn’t have been invested in as asset class as volatile as cryptocurrencies, let alone shares of an unregulated exchange in the Bahamas. In all likelihood, the decision to do business with FTX will result in losses in the millions of dollars.
That loss, and others like it, will be harder to move on from, let alone ignore. How much more spillover will there be? We don’t know yet…and that is the scary part.
It’s easy to experience the fear of missing out when stocks rocket higher. And that’s especially true during a bear market. This is your reminder to pause, recenter, and execute your process (e.g. your own OODA loop – H/T Hedgeye). History tells us to proceed with caution and tight stop losses, as last week’s moves aren’t typical of bull markets.
https://twitter.com/LizAnnSonders/status/1591033419127214085?s=20&t=oZzGhjcxZPrTQ0zpHPQInA
Best To Your Week!
P.S. If you find this research helpful, please tell a friend.
If you don’t, tell an enemy.