Weekend Stock Market Outlook – April 21 2024

Stock Market Outlook entering the Week of April 21st = Downtrend

  • ADX Directional Indicators: Downtrend
  • Price & Volume Signals: Downtrend
  • On Balance Volume Indicator: Downtrend

ANALYSIS
The stock market outlook begins the week in a downtrend, after confirmation during last Monday’s session.

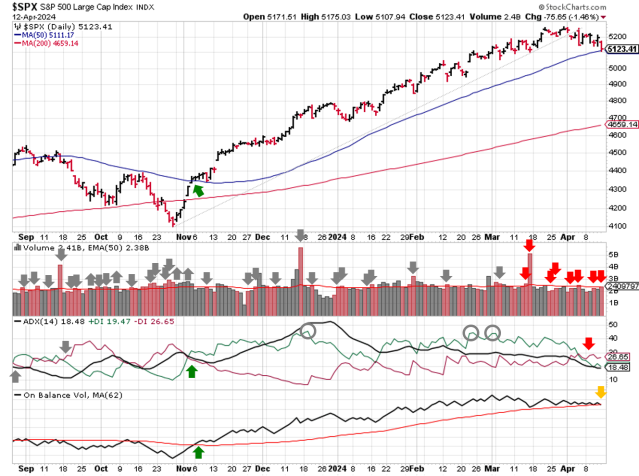
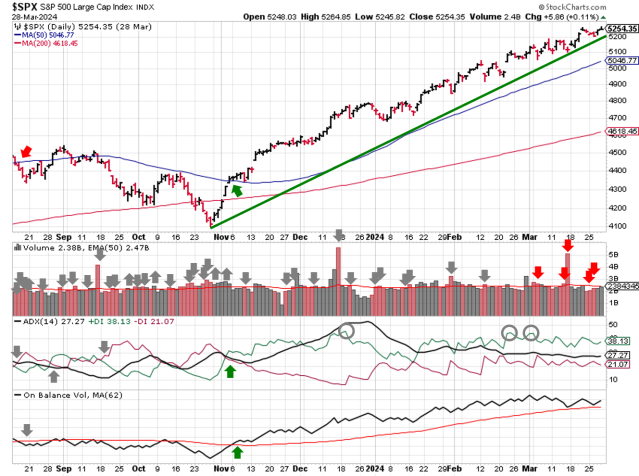
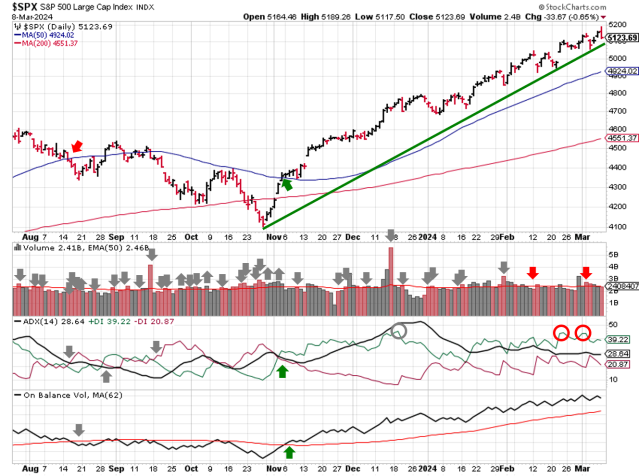
The S&P500 ($SPX) dropped 3% last week, with sellers in control each day.  The index sits ~3% below the 50-day and ~6% above the 200-day moving average.

Technical analysis of daily SPX prices

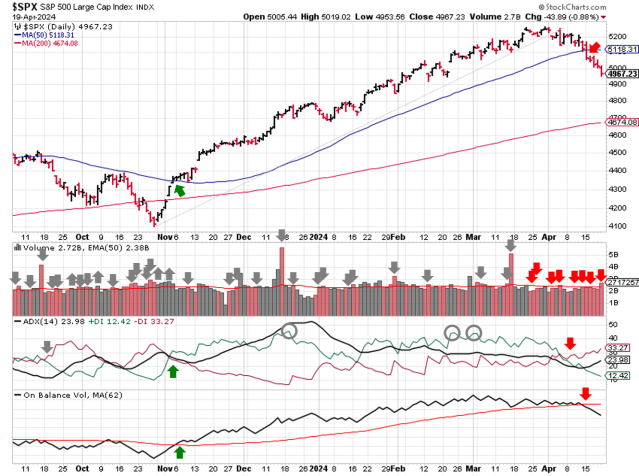
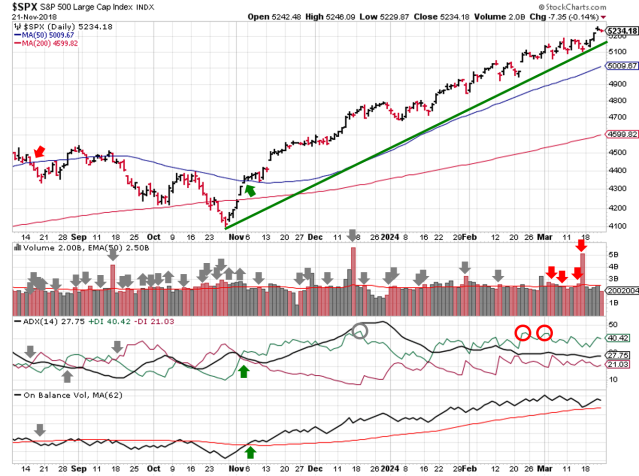
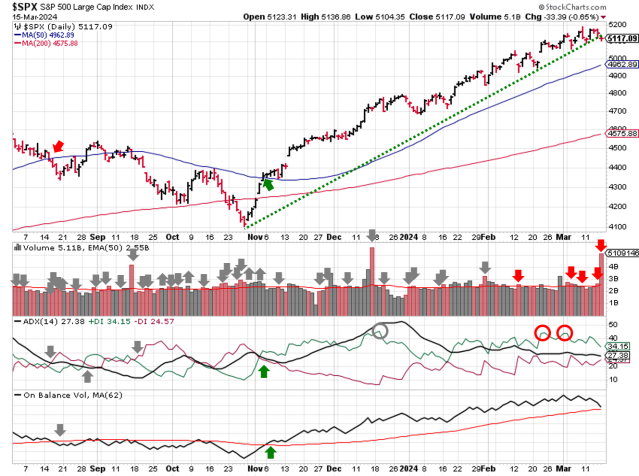
SPX Price & Volume Chart for the Week of Apr 21 2024

All three technical indicators are in confirmed downtrends.  Price/volume joined the ADX in bearish territory on Monday, after slicing through the 50-day moving average and confirming the downtrend signal.  The price/volume action also pushed OBV into a downtrend.

In total, the SPX gained ~16% (704 points) between the uptrend initiation on November 3 (4358) and the start of the downtrend last Monday (5062).  Now, the outlook is in capital preservation mode until signs of the next rally.  Fortunately, money market funds offer attractive alternatives these days, thanks to higher interest rates.

Weekly price performance by asset class

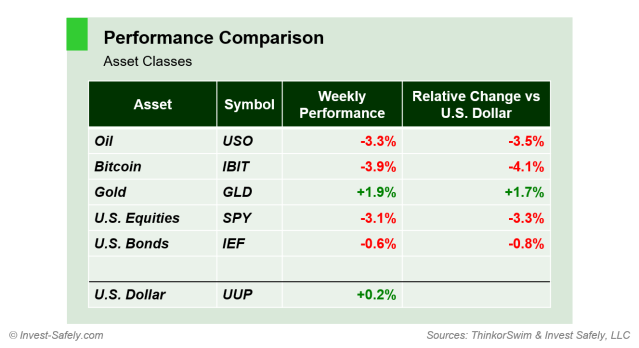
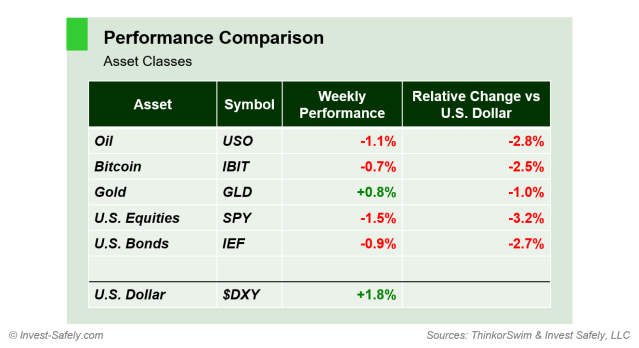
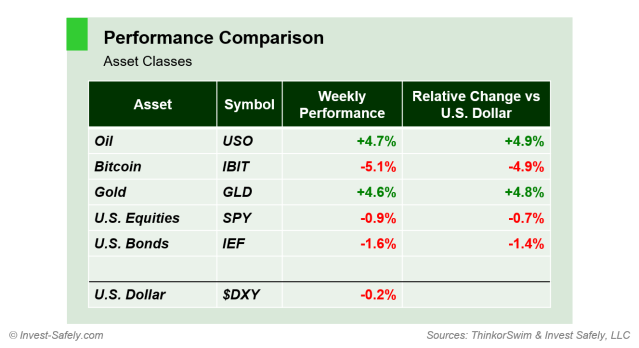
Asset Class Performance for Week 16 of 2024

Gold was the best asset class for the second week in a row, rising 2%.  Bitcoin led to the downside, although Oil and US Equities weren’t far behind.

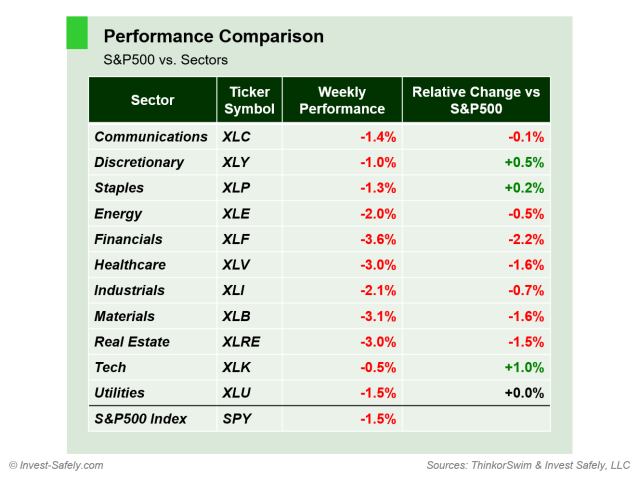
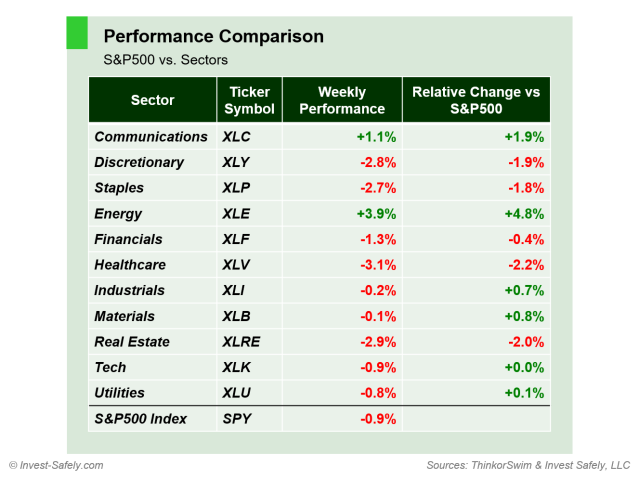
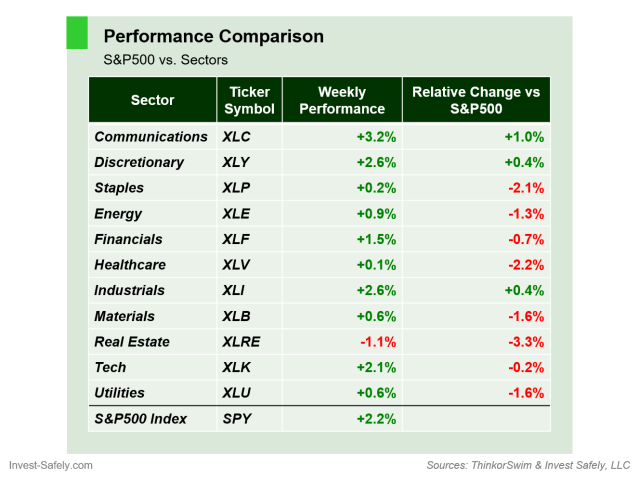
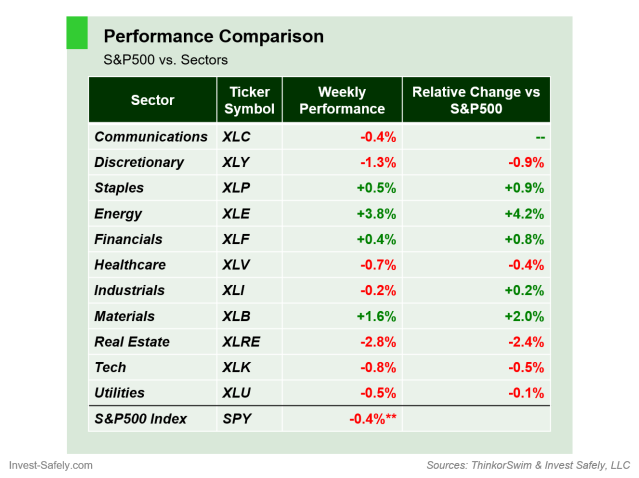
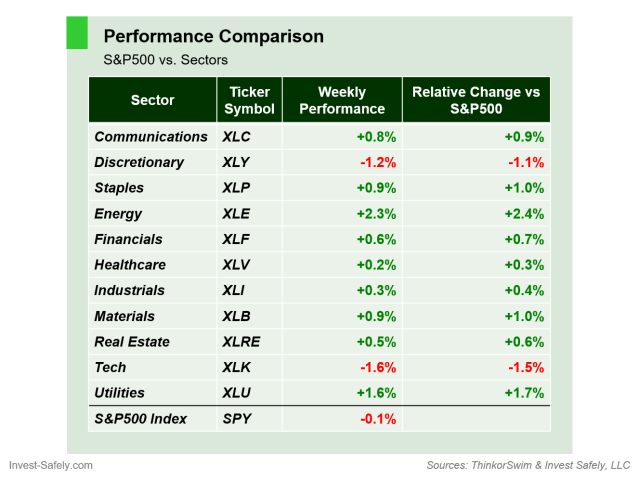
Within major equity sectors, Technology ($XLK) was the biggest loser, dropping over 6%, while Utilities ($XLU) gained ~2%.

Weekly price performance of S&P500 sector ETFs

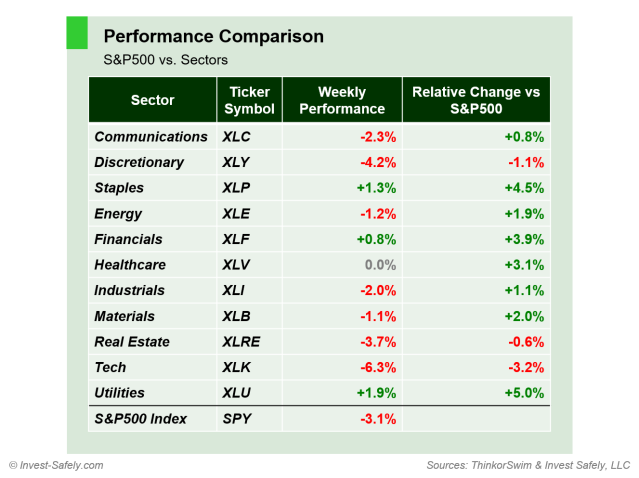
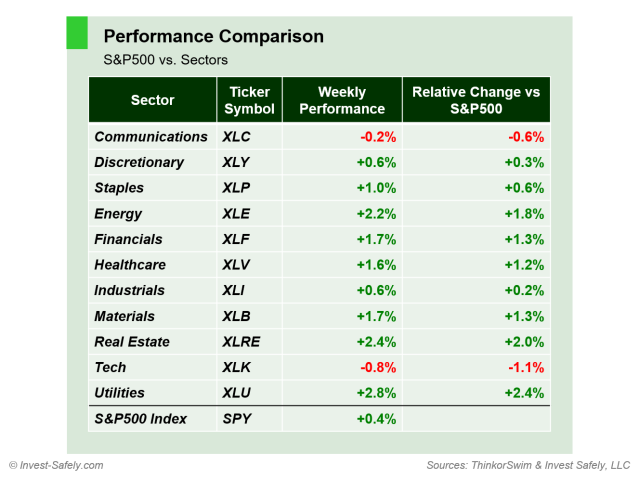
S&P Sector Performance for Week 16 of 2024

COMMENTARY
For the first time since Q3 last year, “buy the dip” gave way to “sell the rip”.  Even “better than expected” Q1 earnings couldn’t stem the tide of selling.  Instead, investors focused on weaker forward guidance, as well as higher-for-longer interest rates and geopolitics.

Last Tuesday, Federal Reserve Chairman Powell spoke at a forum on U.S.-Canada economic relations.  His comments on inflation threw cold water on the rate-cut crowd and sent longer-term interest rates higher:

“The recent data have clearly not given us greater confidence, and instead indicate that it’s likely to take longer than expected to achieve that confidence.”

“We can maintain the current level of restriction for as long as needed.”

Thursday evening, Israel conducted airstrikes against Iranian targets.  The move came as a surprise to many, as most media outlets expected a delayed response due to religious holidays.  Although the events took place outside of market hours, futures spiked; equities down, gold and oil up.  Those knee-jerk reactions were undone by the time the market opened on Friday, but buyers weren’t motivated to put capital at risk in equities over the weekend.

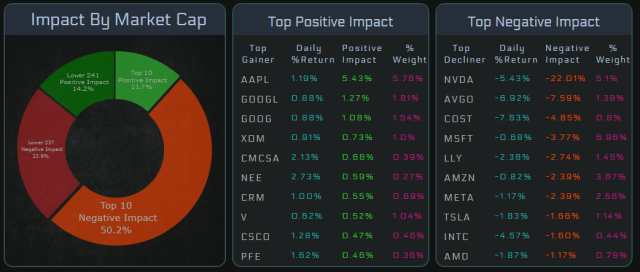
A big week for Q1 earnings, with 4 of the “Magnificent 7” reporting: $MSFT, $GOOG/$GOOGL, $META, $TSLA.  Microsoft, Google, and Meta combine for more than 12% of SPX market cap, so any surprises will have an outsized impact on index performance.

Data-wise, most news outlets will focus on Friday’s release of March PCE, due to its impact on rate cut narratives.  But we’ll also March Durable Goods orders (Wednesday morning) and the first (i.e. “advance”) estimate of Q1 GDP (Thursday morning).

Best to Your Week!

P.S. If you find this research helpful, please tell a friend.
If you don’t, tell an enemy.

Sources: Bloomberg, CNBC, Federal Reserve Bank of St. Louis, Hedgeye, Stockcharts.com, U.S. Bureau of Economic Analysis, U.S. Bureau of Labor Statistics

Invest Safely, LLC is an independent investment research and online financial media company.  Use of Invest Safely, LLC and any other products available through invest-safely.com is subject to our Terms of Service and Privacy Policy.
Not a recommendation to buy or sell any security.
Posted in Historical Data, Market Trends | Tagged , , , | Leave a comment

Weekend Stock Market Outlook – April 14 2024

Stock Market Outlook entering the Week of April 14th = Uptrend

  • ADX Directional Indicators: Downtrend
  • Price & Volume Signals: Mixed
  • On Balance Volume Indicator: Mixed

ANALYSIS
The stock market outlook shows an uptrend, but both remaining signals are on the verge of confirming a downtrend so be ready this week.

The S&P500 ($SPX) dropped 1.6% last week, unable to re-establish the trend line and dropping to the 50-day moving average.  The index still sits ~10% above the 200-day moving average.

Technical analysis of daily SPX prices

SPX Price & Volume Chart for the Week of Apr 142024

After a borderline crossover the week prior, the ADX confirmed a downtrend signal last Tuesday.  It’s a similar set-up for On-Balance Volume this week, thanks to a marginal crossover on Friday, so the signal moves to mixed while we look for confirmation early this week.

Institutional selling increased, hitting 8 distribution days within the past 5 weeks, which is above the threshold for a correction.  For now, the price/volume signal shifts to mixed, while we wait to see if the index finds support at the 50-day moving average.

Weekly price performance of S&P500 sector ETFs

S&P Sector Performance for Week 15 of 2024

Every major equity sector in the S&P registered a loss last week.  Relative to the index, Technology ($XLK) outperformed by 1%, while Financials ($XLF) dropped an additional ~2%.

Gold was the best asset class, rising almost 1%, although all 5 underperformed versus the U.S. dollar.  You’d have to dig a bit more into precious metals to find real outperformance (i.e. Palladium, Platinum, Silver).

Weekly price performance by asset class

Asset Class Performance for Week 15 of 2024

COMMENTARY
Stocks have had an incredible run from late October, and the factors in play have changed. Given the recent weakness in equities, it’s a good time to review your holdings and make adjustments (i.e. take profits and redeploy capital).

Inflation continues to be a concern for the Federal Reserve, producers, and consumers.  The March FOMC minutes revealed that the U.S. central bank that wouldn’t commit to rate cuts, out of concern that inflation remains elevated from their targets.  The release of the latest CPI and PPI data validates those worries.

March CPI was higher than expected, with the recent surge in oil and other commodities working its way through supply chains to the consumer.

CPI(y/y) Actual Prior Expected
Headline +3.5% +3.2% +3.4%
Core +3.8% +3.8% +3.7%

On the producer side, Core PPI was the main story.  Even after an upward revision to February data, March came in higher still, and that’s without food and energy costs.

PPI(y/y) Actual Prior Expected
Headline +2.1% +1.6% +2.2%
Core +2.4% +2.1% +2.3%

In response to March inflation readings, the probability of a rate cut moved further into the future.  Last month, the odds of a rate cut in June fell to 50/50, as measured by the CME Group’s 30-Day Fed Fund futures prices.  As of today, probability of a rate cut in June is less than 30%, and July is 50/50.

Earnings season kicked off last week with big banks (JPMorgan Chase, CitiGroup, and Wells Fargo) beating expectations.  This week the announcements really get going:

https://platform.twitter.com/widgets.js

Best to Your Week!

P.S. If you find this research helpful, please tell a friend.
If you don’t, tell an enemy.

Sources: Bloomberg, CNBC, Federal Reserve Bank of St. Louis, Hedgeye, Stockcharts.com, U.S. Bureau of Economic Analysis, U.S. Bureau of Labor Statistics

Invest Safely, LLC is an independent investment research and online financial media company.  Use of Invest Safely, LLC and any other products available through invest-safely.com is subject to our Terms of Service and Privacy Policy.
Not a recommendation to buy or sell any security.
Posted in Historical Data, Market Trends | Tagged , , , | Leave a comment

Weekend Stock Market Outlook – April 07 2024

Stock Market Outlook entering the Week of April 7th = Uptrend

  • ADX Directional Indicators: Mixed
  • Price & Volume Signals: Uptrend
  • On Balance Volume Indicator: Uptrend

ANALYSIS
The stock market outlook remains in a uptrend, despite Thursday’s volatility.

The S&P500 ($SPX) dropped 1% last week, starting Q2 with a loss.  The index also broke  below the November trendline, though reaching a new high would re-establish the line and create a new support level.   The index sits ~4% above the 50-day moving average, and ~12% above the 200-day moving average.

Technical analysis of daily SPX prices

SPX Price & Volume Chart for the Week of Apr 07 2024

The ADX signal is borderline, crossing over by the slimmest of margins on Friday.  Monday’s price action will determine if the signal can sustain the bearish view or reverts to bullish.  Institutional selling is elevated, but not excessive, so the signal remains in an uptrend for this week.  On Balance Volume also remains in an uptrend, but shows a negative divergence with price since mid-March.

Weekly price performance of S&P500 sector ETFs

S&P Sector Performance for Week 14 of 2024

Sector-wise, Energy ($XLE) outperformed by a wide margin.  Heathcare ($XLV) was the worst performer, although several sectors were in rough shape.  Oil and gold were the top asset classes last week; bitcoin was the worst.

Weekly price performance by asset class

Asset Class Performance for Week 14 of 2024

COMMENTARY
ISM Manufacturing PMI showed an expansion (reading above 50) for the first time in 16 months!  ISM Services PMI declined slightly, though still shows an expansion as well.

On the jobs front, JOLTS data was inline with expectations, while non-farm payrolls exceeded expectations, reaching its highest level in 10 months.

Speeches from Fed officials didn’t provide much excitement.  Some commentators thought Neel Kashkari may have spooked the markets, leading to Thursday’s sell-off.  His remarks were likely an example of correlation not causation.  Instead:

This type of “sequenced” move rather than a simultaneous move suggests “somebody” (the proverbial ,”I heard of a guy”) blew up and position unwinds were the bigger story. Perhaps a dollar bull was short bitcoin and crude against 2yr bonds. Who knows? But somebody felt more pain than the rest of us.

https://x.com/t1alpha/status/1776287914160525470

This week, CPI data and FOMC minutes are published on Wednesday, followed by PMI data on Thursday.

Best to Your Week!

P.S. If you find this research helpful, please tell a friend.
If you don’t, tell an enemy.

Sources: Bloomberg, CNBC, Federal Reserve Bank of St. Louis, Hedgeye, Stockcharts.com, U.S. Bureau of Economic Analysis, U.S. Bureau of Labor Statistics

Invest Safely, LLC is an independent investment research and online financial media company.  Use of Invest Safely, LLC and any other products available through invest-safely.com is subject to our Terms of Service and Privacy Policy.
Not a recommendation to buy or sell any security.
Posted in Historical Data, Market Trends | Tagged , , , | Leave a comment

Weekend Stock Market Outlook – March 31 2024

Stock Market Outlook entering the Week of March 31st = Uptrend

  • ADX Directional Indicators: Uptrend
  • Price & Volume Signals: Uptrend
  • On Balance Volume Indicator: Uptrend

ANALYSIS
The stock market outlook ends the first quarter of 2024 in an uptrend.

The S&P500 ($SPX) rose 0.4% last week, ending Q1 with a gain of 10.8%.  The index sits ~4% above the 50-day moving average, and ~14% above the 200-day moving average.

Technical analysis of daily SPX prices

SPX Price & Volume Chart entering the Week of Mar 31 2024

All three signals show an uptrend in place.  Institutional selling picked up last week, although volume remained below average.

In terms of sector performance, Real estate ($XLRE) claimed the top spot last week, after being the worst sector two weeks ago.  Energy ($XLE) was a close second.  Technology ($XLK) underperformed last week.

Weekly price performance of S&P500 sector ETFs

S&P Sector Performance for Week 13 of 2024

For the quarter, the $SPY ETF was up 11%, slightly more than the actual index.  Communications ($XLC) topped the gainers for the quarter, rising ~13% (+2% vs. the SPY).  Capital flows were not kind to Real Estate ($XLRE), which dropped ~1.5% for the quarter.  That’s a -12.5% loss versus the overall index.

From an asset class perspective, “commodities” were the best in Q1, albeit with a very large range of performance.  Bitcoin, livestock, and oil were the best performers, while industrial materials and agriculture lagged.

In second place was U.S. equities (i.e. $SPX), again with some variation by sector.  Then came gold, bond funds, and finally the US dollar.  All in all, this breakdown is typical of a “nominal expansion”, or economic growth (+GDP) with rising prices (+inflation).

COMMENTARY
The third and final GDP revision showed the US economy grew 3.4% in Q4 of 2023, slightly higher than the 3.2% reported in the second estimate. Consumer spending was revised higher, which isn’t surprising given “sticky” inflation data.

Government spending continues to contribute a large portion of GDP, increasing 4.6% year over year and showing now signs of slowing.  This may be on reason that asset prices and economic data behaved like it’s a nominal expansion (rising growth and rising inflation), while consumers “felt” that conditions are more recessionary (falling growth and rising inflation).

During the trading holiday on Friday, PCE data was released.  Thankfully, there were no surprises as changes were inline with expectations.

PCE(y/y) Actual Prior Expected
Headline +2.5% +2.4% +2.5%
Core +2.8% +2.9% +2.8%

This week is all about jobs, with JOLTS and NFP releases, as well as several speeches by Fed officials (including another one from Powell on Wednesday).

Best to Your Week!

P.S. If you find this research helpful, please tell a friend.
If you don’t, tell an enemy.

Sources: Bloomberg, CNBC, Federal Reserve Bank of St. Louis, Hedgeye, Stockcharts.com, U.S. Bureau of Economic Analysis, U.S. Bureau of Labor Statistics

Invest Safely, LLC is an independent investment research and online financial media company.  Use of Invest Safely, LLC and any other products available through invest-safely.com is subject to our Terms of Service and Privacy Policy.
Not a recommendation to buy or sell any security.
Posted in Historical Data, Market Trends | Tagged , , , , | Comments Off on Weekend Stock Market Outlook – March 31 2024

Weekend Stock Market Outlook – March 24 2024

Stock Market Outlook entering the Week of March 24th = Uptrend

  • ADX Directional Indicators: Uptrend
  • Price & Volume Signals: Uptrend
  • On Balance Volume Indicator: Uptrend

ANALYSIS
The stock market outlook shows an uptrend in place, as the $SPX ended the week just shy of another all time high.

The S&P500 ($SPX) rose just over 2% last week and re-established the long-term trendline.  The index sits ~4.5% above the 50-day moving average, and ~14% above the 200-day moving average.

Technical analysis of daily SPX prices

SPX Price & Volume Chart for the Week of Mar 24 2024

All three signals show an uptrend in place.  Institutional selling was scarce last week, and On Balance Volume rebounded from its moving average.

Communications ($XLC) outperformed the broader index last week, thanks in large part to its large weightings for Google ($GOOG/$GOOGL) and Meta ($META).  Real estate ($XLRE) spent a second week in a row as the weakest sector, with Equinix ($EQIX) dragging down the sector after Hindenburg Research alleged senior management manipulated financial metrics to trigger executive stock grants.

Weekly price performance of S&P500 sector ETFs

S&P Sector Performance for the Week of Mar 24 2024

COMMENTARY
The FOMC left rates unchanged. And while Powell may not have delivered a rate cut, he did deliver a dovish press conference.  Despite continued economic growth, low unemployment, and sticky inflation, the Fed still sees a total of 3 rate cuts this year, as well as the reduction of their quantitative tightening program.  Expectations are for inflation to gradually fall back to 2%, although the path with be “bumpy”.

The Bank of Japan went the other direction and raised rates for the first time in 17 years.  While the impact was small (from -0.1% to a range of 0.0% – 0.1%), it marks a move away from its negative interest-rate policy, and a potential change in profitability of the Yen Carry trade so many institutions use for low-risk arbitrage.

Best to Your Week!

P.S. If you find this research helpful, please tell a friend.
If you don’t, tell an enemy.

Sources: Bloomberg, CNBC, Federal Reserve Bank of St. Louis, Hedgeye, Stockcharts.com, U.S. Bureau of Economic Analysis, U.S. Bureau of Labor Statistics

Invest Safely, LLC is an independent investment research and online financial media company.  Use of Invest Safely, LLC and any other products available through invest-safely.com is subject to our Terms of Service and Privacy Policy.
Not a recommendation to buy or sell any security.
Posted in Historical Data, Market Trends | Tagged , , , , | Comments Off on Weekend Stock Market Outlook – March 24 2024

Weekend Stock Market Outlook – March 17 2024

Stock Market Outlook entering the Week of March 17th = Uptrend

  • ADX Directional Indicators: Uptrend
  • Price & Volume Signals: Uptrend
  • On Balance Volume Indicator: Uptrend

ANALYSIS
The stock market outlook shows an uptrend in place.  Although the signals stayed the same, weakness crept onto the scene last week and suggests a consolidation period is at hand.

The S&P500 ($SPX) lost 0.1% last week, and closed just below the rally’s trendline.  The index sits ~3% above the 50-day moving average, and 12% above the 200-day moving average (still historically elevated).

Technical analysis of daily SPX prices

SPX Price & Volume Chart for the Week of Mar 17 2024

All three signals show an uptrend in place, but the equity market probably tests those levels in the days ahead.  The index picked up a couple of distribution days last week, but option expiration masks the nature of Friday’s move.  Still, the count is elevated at 5, with 4 occurring over the past 10 trading sessions.  On Balance Volume remains above the 3 month average, but definitely weakened last week.

Weekly price performance of S&P500 sector ETFs

S&P Sector Performance for the Week of Mar 17 2024

The energy sector ($XLE) outperformed the broader index again last week, rising 3.8%, thanks in part to a bounce in the price of oil.  Real estate ($XLRE) had a tough week; the sector sold off as long-term interest rates popped higher, in response to higher PPI data.

**Note: $SPY performance in the table above isn’t adjusted for last week’s dividend (gain of ~0.3%).

COMMENTARY
The odds of rate cuts before June have fallen dramatically over the past 2 months, as data shows inflation remains “sticky”.

February CPI was slightly higher than expected, for both core and headline figures, although core was down from last month.

CPI(y/y) Actual Prior Expected
Headline +3.2% +3.1% +3.1%
Core +3.8% +3.9% +3.7%

February PPI, like CPI, was higher than expected, and also registered a jump in headline data.

PPI(y/y) Actual Prior Expected
Headline +1.6% +1.0% +1.1%
Core +2.0% +2.0% +1.9%

In the absence of new PCE data (next release is March 29), higher than expected CPI/PPI data does not bode well for those still hoping the Fed cuts rates this Wednesday. Even a June rate cut, which was a certainty a few weeks ago, looks closer to a 50/50 proposition at this point.

Best to Your Week!

P.S. If you find this research helpful, please tell a friend.
If you don’t, tell an enemy.

Sources: Bloomberg, CNBC, Federal Reserve Bank of St. Louis, Hedgeye, Stockcharts.com, U.S. Bureau of Economic Analysis, U.S. Bureau of Labor Statistics

Invest Safely, LLC is an independent investment research and online financial media company.  Use of Invest Safely, LLC and any other products available through invest-safely.com is subject to our Terms of Service and Privacy Policy.
Not a recommendation to buy or sell any security.
Posted in Historical Data, Market Trends | Tagged , , , , | Comments Off on Weekend Stock Market Outlook – March 17 2024

Weekend Stock Market Outlook – March 10 2024

Stock Market Outlook entering the Week of March 10th = Uptrend

  • ADX Directional Indicators: Uptrend
  • Price & Volume Signals: Uptrend
  • On Balance Volume Indicator: Uptrend

ANALYSIS
The stock market outlook shows an uptrend in place, with no change to the underling signals versus last week.

The S&P500 ($SPX) lost 0.1% last week.  The index sits ~4% above the 50-day moving average, and 12.5% above the 200-day moving average (historically elevated).

Technical analysis of daily SPX prices

SPX Price & Volume Chart for the Week of Mar 10 2024

All three signals show an uptrend in place. The ADX continues to wane with the positive directional indicator elevated (yellow light).  While outright distribution days have been in short supply since the beginning of the year, there have a been a couple of stalling days in the past 5 weeks, which were absent from last week’s chart.

Weekly price performance of S&P500 sector ETFs

S&P Sector Performance for the Week of Mar 10 2024

While the S&P500 was basically flat for the week, the energy sector ($XLE) and utilities ($XLU) outperformed, taking their turn as beneficiaries of the decline in the yield curve.

COMMENTARY
While ISM Services PMI was in line with estimates, U.S. factory orders caused a brief stir in the equity market on Tuesday.  New orders for manufactured goods in February fell 3.6% from January readings, which is the largest month/month drop since April 2020.

Wednesday’s JOLTS data was “unremarkable”, and Powell admitted to Congress what everyone in the banking industry expected: that pesky plan to raise capital requirements for large banks (i.e. Basil 3 standards) will be overhauled after industry complaints cost and economic impact.

Friday’s February nonfarm payrolls report showed 275k added jobs were added; more than the 198k forecast. Unemployment rose to 3.9%, while expectations were for it to remain at 3.7%. More importantly, though less reported, was the negative revision to January’s NFP data; jobs added was revised down from 353,000 to 229,000 (-35%)!

Speaking of things that didn’t get much notice, the Japanese Central Bank appears to be prepping the market for the end of its negative rate program, in place since 2016. Doing so would reduce the profitability of the Japanese Yen Carry Trade, a form of arbitrage used by institutions in forex/currency and debt markets. Employed across the globe since the mid-1990s, it came back into favor for the U.S. with the Fed’s recent hiking cycle.

Friday’s trading session also gave a great example of current market capitalization dynamics.  The performance of the indexes looked “not good” for most of the day.  But if you look beneath the surface, you’ll see that performance wasn’t widespread.

T1 Alpha Dashboard

Source: T1 Alpha // https://tier1alpha.com/

The S&P500 ended the day with a 0.57% loss.  But the number of advancing and declining stocks was 50/50.  What caused the negative performance shift?

Table of biggest winners and losers in S&P500

Source: T1 Alpha // https://tier1alpha.com/

As shown in the table above, 22% of the S&P500’s loss came from 1 stock, $NVDA.  $AVGO and $MSFT didn’t help either. Per Goldman Sachs:

The 10 largest stocks now account for 33% of S&P 500 market cap, well above the 27% share reached at the peak of the tech bubble in 2000, and 25% of earnings.

The good news? High concentration doesn’t end rallies.

This week, we get CPI on Tuesday, PPI on Wednesday, and another massive options expiration (quarterly) on Friday.

Best to Your Week!

P.S. If you find this research helpful, please tell a friend.
If you don’t, tell an enemy.

Sources: Bloomberg, CNBC, Federal Reserve Bank of St. Louis, Hedgeye, Stockcharts.com, U.S. Bureau of Economic Analysis, U.S. Bureau of Labor Statistics

Invest Safely, LLC is an independent investment research and online financial media company.  Use of Invest Safely, LLC and any other products available through invest-safely.com is subject to our Terms of Service and Privacy Policy.
Not a recommendation to buy or sell any security.
Posted in Historical Data, Market Trends | Tagged , , , , | Comments Off on Weekend Stock Market Outlook – March 10 2024