Weekend Stock Market Outlook – March 17 2024

Stock Market Outlook entering the Week of March 17th = Uptrend

  • ADX Directional Indicators: Uptrend
  • Price & Volume Signals: Uptrend
  • On Balance Volume Indicator: Uptrend

ANALYSIS
The stock market outlook shows an uptrend in place.  Although the signals stayed the same, weakness crept onto the scene last week and suggests a consolidation period is at hand.

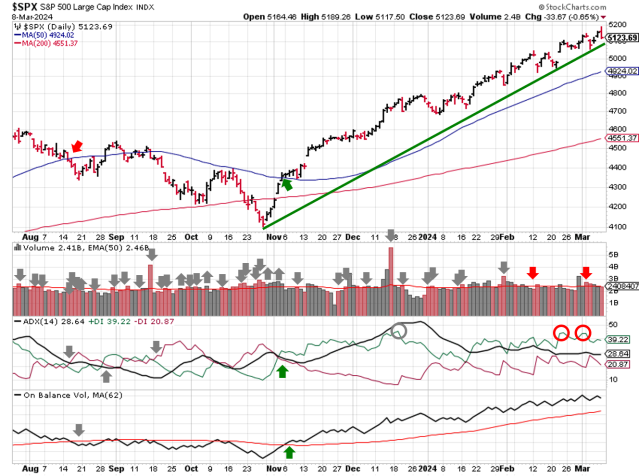
The S&P500 ($SPX) lost 0.1% last week, and closed just below the rally’s trendline.  The index sits ~3% above the 50-day moving average, and 12% above the 200-day moving average (still historically elevated).

Technical analysis of daily SPX prices

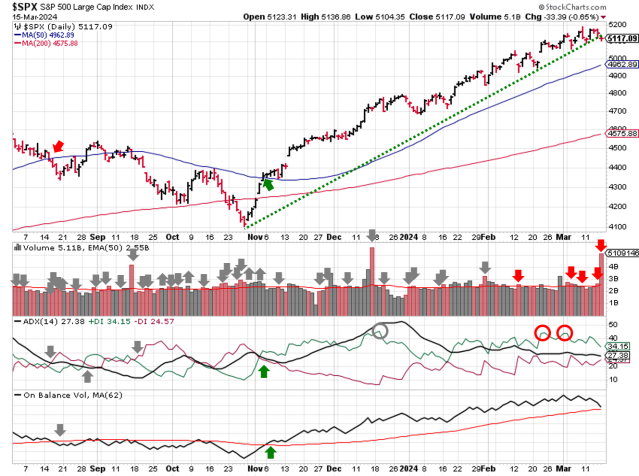
SPX Price & Volume Chart for the Week of Mar 17 2024

All three signals show an uptrend in place, but the equity market probably tests those levels in the days ahead.  The index picked up a couple of distribution days last week, but option expiration masks the nature of Friday’s move.  Still, the count is elevated at 5, with 4 occurring over the past 10 trading sessions.  On Balance Volume remains above the 3 month average, but definitely weakened last week.

Weekly price performance of S&P500 sector ETFs

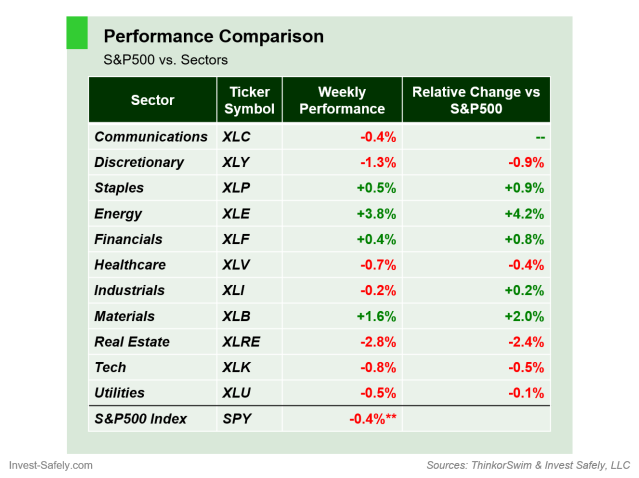
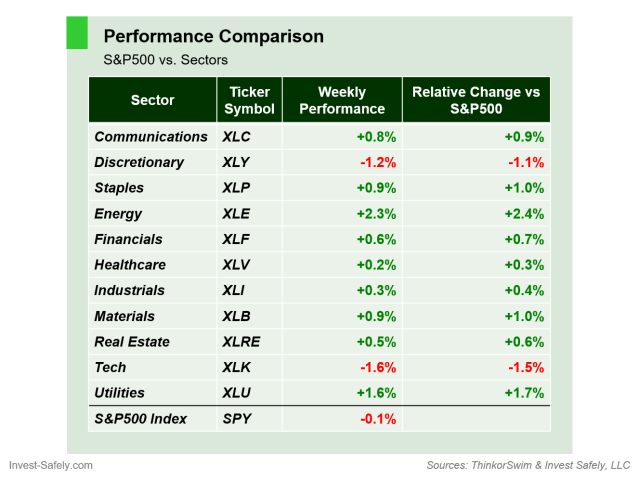
S&P Sector Performance for the Week of Mar 17 2024

The energy sector ($XLE) outperformed the broader index again last week, rising 3.8%, thanks in part to a bounce in the price of oil.  Real estate ($XLRE) had a tough week; the sector sold off as long-term interest rates popped higher, in response to higher PPI data.

**Note: $SPY performance in the table above isn’t adjusted for last week’s dividend (gain of ~0.3%).

COMMENTARY
The odds of rate cuts before June have fallen dramatically over the past 2 months, as data shows inflation remains “sticky”.

February CPI was slightly higher than expected, for both core and headline figures, although core was down from last month.

CPI(y/y) Actual Prior Expected
Headline +3.2% +3.1% +3.1%
Core +3.8% +3.9% +3.7%

February PPI, like CPI, was higher than expected, and also registered a jump in headline data.

PPI(y/y) Actual Prior Expected
Headline +1.6% +1.0% +1.1%
Core +2.0% +2.0% +1.9%

In the absence of new PCE data (next release is March 29), higher than expected CPI/PPI data does not bode well for those still hoping the Fed cuts rates this Wednesday. Even a June rate cut, which was a certainty a few weeks ago, looks closer to a 50/50 proposition at this point.

Best to Your Week!

P.S. If you find this research helpful, please tell a friend.
If you don’t, tell an enemy.

Sources: Bloomberg, CNBC, Federal Reserve Bank of St. Louis, Hedgeye, Stockcharts.com, U.S. Bureau of Economic Analysis, U.S. Bureau of Labor Statistics

Invest Safely, LLC is an independent investment research and online financial media company.  Use of Invest Safely, LLC and any other products available through invest-safely.com is subject to our Terms of Service and Privacy Policy.
Not a recommendation to buy or sell any security.
Posted in Historical Data, Market Trends | Tagged , , , , | Comments Off on Weekend Stock Market Outlook – March 17 2024

Weekend Stock Market Outlook – March 10 2024

Stock Market Outlook entering the Week of March 10th = Uptrend

  • ADX Directional Indicators: Uptrend
  • Price & Volume Signals: Uptrend
  • On Balance Volume Indicator: Uptrend

ANALYSIS
The stock market outlook shows an uptrend in place, with no change to the underling signals versus last week.

The S&P500 ($SPX) lost 0.1% last week.  The index sits ~4% above the 50-day moving average, and 12.5% above the 200-day moving average (historically elevated).

Technical analysis of daily SPX prices

SPX Price & Volume Chart for the Week of Mar 10 2024

All three signals show an uptrend in place. The ADX continues to wane with the positive directional indicator elevated (yellow light).  While outright distribution days have been in short supply since the beginning of the year, there have a been a couple of stalling days in the past 5 weeks, which were absent from last week’s chart.

Weekly price performance of S&P500 sector ETFs

S&P Sector Performance for the Week of Mar 10 2024

While the S&P500 was basically flat for the week, the energy sector ($XLE) and utilities ($XLU) outperformed, taking their turn as beneficiaries of the decline in the yield curve.

COMMENTARY
While ISM Services PMI was in line with estimates, U.S. factory orders caused a brief stir in the equity market on Tuesday.  New orders for manufactured goods in February fell 3.6% from January readings, which is the largest month/month drop since April 2020.

Wednesday’s JOLTS data was “unremarkable”, and Powell admitted to Congress what everyone in the banking industry expected: that pesky plan to raise capital requirements for large banks (i.e. Basil 3 standards) will be overhauled after industry complaints cost and economic impact.

Friday’s February nonfarm payrolls report showed 275k added jobs were added; more than the 198k forecast. Unemployment rose to 3.9%, while expectations were for it to remain at 3.7%. More importantly, though less reported, was the negative revision to January’s NFP data; jobs added was revised down from 353,000 to 229,000 (-35%)!

Speaking of things that didn’t get much notice, the Japanese Central Bank appears to be prepping the market for the end of its negative rate program, in place since 2016. Doing so would reduce the profitability of the Japanese Yen Carry Trade, a form of arbitrage used by institutions in forex/currency and debt markets. Employed across the globe since the mid-1990s, it came back into favor for the U.S. with the Fed’s recent hiking cycle.

Friday’s trading session also gave a great example of current market capitalization dynamics.  The performance of the indexes looked “not good” for most of the day.  But if you look beneath the surface, you’ll see that performance wasn’t widespread.

T1 Alpha Dashboard

Source: T1 Alpha // https://tier1alpha.com/

The S&P500 ended the day with a 0.57% loss.  But the number of advancing and declining stocks was 50/50.  What caused the negative performance shift?

Table of biggest winners and losers in S&P500

Source: T1 Alpha // https://tier1alpha.com/

As shown in the table above, 22% of the S&P500’s loss came from 1 stock, $NVDA.  $AVGO and $MSFT didn’t help either. Per Goldman Sachs:

The 10 largest stocks now account for 33% of S&P 500 market cap, well above the 27% share reached at the peak of the tech bubble in 2000, and 25% of earnings.

The good news? High concentration doesn’t end rallies.

This week, we get CPI on Tuesday, PPI on Wednesday, and another massive options expiration (quarterly) on Friday.

Best to Your Week!

P.S. If you find this research helpful, please tell a friend.
If you don’t, tell an enemy.

Sources: Bloomberg, CNBC, Federal Reserve Bank of St. Louis, Hedgeye, Stockcharts.com, U.S. Bureau of Economic Analysis, U.S. Bureau of Labor Statistics

Invest Safely, LLC is an independent investment research and online financial media company.  Use of Invest Safely, LLC and any other products available through invest-safely.com is subject to our Terms of Service and Privacy Policy.
Not a recommendation to buy or sell any security.
Posted in Historical Data, Market Trends | Tagged , , , , | Comments Off on Weekend Stock Market Outlook – March 10 2024

Weekend Stock Market Outlook – March 3 2024

Stock Market Outlook entering the Week of March 3rd = Uptrend

  • ADX Directional Indicators: Uptrend
  • Price & Volume Signals: Uptrend
  • On Balance Volume Indicator: Uptrend

ANALYSIS
The stock market outlook shows an uptrend in place, with almost no change in the underling signals versus last week.

The S&P500 ($SPX) rose 0.9% last week.  The index sits ~5% above the 50-day moving average, and 13.5% above the 200-day moving average (historically elevated).

Technical analysis of daily SPX prices

SPX Price & Volume Chart for the Week of Mar 03 2024

All three signals show an uptrend in place. The DI+ remains over 40 (yellow light).  There were no distribution days during the month of February, although trading volume was below average most of that time.

Highlight sector performance vs the S&P500

Taking a look at sectors with the S&P500, the big winner was real estate, which benefiting from the decline in rates last week. The sector rallied 3.3%, outperforming the broader index by almost 2%. Healthcare the worst sector, underperforming by ~2%.

COMMENTARY
90% of Q4 earnings season is complete and the results are in:

  • Revenues: +3.4% (y/y)
  • Earnings: +10% (y/y)

In case you’re wondering: No, that’s not an earnings recession!  That’s actually pretty solid earnings growth.  Soft-landing indeed.

This week, we get ISM services inflation on Tuesday, JOLTS on Wednesday, and NFP on Friday.  There are also a handful of speeds from the U.S. Federal Reserve, including two from Chairman Powell on Wednesday and Thursday.

Best to Your Week!

P.S. If you find this research helpful, please tell a friend.
If you don’t, tell an enemy.

Sources: Bloomberg, CNBC, Federal Reserve Bank of St. Louis, Hedgeye, Stockcharts.com, U.S. Bureau of Economic Analysis, U.S. Bureau of Labor Statistics

Invest Safely, LLC is an independent investment research and online financial media company.  Use of Invest Safely, LLC and any other products available through invest-safely.com is subject to our Terms of Service and Privacy Policy.
Not a recommendation to buy or sell any security.
Posted in Historical Data, Market Trends | Tagged , , , , | Comments Off on Weekend Stock Market Outlook – March 3 2024

Weekend Stock Market Outlook – February 25 2024

Stock Market Outlook entering the Week of February 25th = Uptrend

  • ADX Directional Indicators: Uptrend
  • Price & Volume Signals: Uptrend
  • On Balance Volume Indicator: Uptrend

ANALYSIS
The stock market outlook shows an uptrend in place, with all three signals showing green.

The S&P500 ($SPX) rose 1.7% last week.  The index sits ~5% above the 50-day moving average, and 13% above the 200-day moving average.

Technical analysis of daily SPX prices

SPX Price & Volume Chart for the Week of Feb 25 2024

All three signals show an uptrend in place.  However, the DI+ reading over 40 is a yellow light, especially with the overall ADX showing a weakening trend since the start of the year.

COMMENTARY
Nvidia ($NVDA) was the star of the show last week, coming through with an earnings beat Wednesday evening.  Per T1Alpha, Nvidia’s subsequent rally on Thursday (up 16.4%) was responsible for a third of the SPX’s 2% rally.

Think about that for a moment; ~30% of the move in an index of ~500 stocks came from one, single, company.  That’s amazing.

Thursday also marked the end of another streak: 252 trading sessions without a 2% move in the SPX.

Fighting the market (up or down) is always a losing proposition, so always ensure probabilities are in your favor.  Referring back to the 200-day moving average:  since the start of 1990, we’ve had 8602 trading sessions. The SPX has been 13% or higher than the 200 day moving average for 492 of those sessions.  That’s just 5% of the trading days over the past 34 years.

If the SPX is 15% or higher, the number of sessions drops to 208, or just 2.4%.

Technical analysis of daily SPX prices

Now, I’m not saying a correction is eminent.  The SPX could move sideways for a while, which take the gap lower.  Or we could enter a period like the late ’90s with a lot chop.  In both cases, the probabilities are shifting towards downside risk, rather than upside opportunity.

This week, be on the lookout the latest Durable Goods data on Tuesday, a revised GDP figure on Wednesday, PCE data on Thursday, and ISM manufacturing data on Friday.

Best to Your Week!

P.S. If you find this research helpful, please tell a friend.
If you don’t, tell an enemy.

Sources: Bloomberg, CNBC, Federal Reserve Bank of St. Louis, Hedgeye, Stockcharts.com, U.S. Bureau of Economic Analysis, U.S. Bureau of Labor Statistics

Invest Safely, LLC is an independent investment research and online financial media company.  Use of Invest Safely, LLC and any other products available through invest-safely.com is subject to our Terms of Service and Privacy Policy.
Not a recommendation to buy or sell any security.
Posted in Historical Data, Market Trends | Tagged , , , , | Comments Off on Weekend Stock Market Outlook – February 25 2024

Weekend Stock Market Outlook – February 18 2024

Stock Market Outlook entering the Week of February 18th = Uptrend

  • ADX Directional Indicators: Uptrend
  • Price & Volume Signals: Uptrend
  • On Balance Volume Indicator: Uptrend

ANALYSIS
The stock market outlook shows an uptrend in place, with the index sitting just below its 52-week high.

The S&P500 ($SPX) fell -0.4% last week, accounting for only the second weekly drop since the end of October.  The index sits ~4% above the 50-day moving average, and 11.5% above the 200-day moving average.

Technical analysis of daily SPX prices

SPX Price & Volume Chart for the Week of Feb 18 2024

Both ADX and price/volume signals show an uptrend in place, within minimal institutional selling.  This week’s update sees the return of a third signal, in the form of the On Balance Volume indicator. In replacing Elliott Wave, I wanted to find a signal that was:

  1. Available from free charting software like Stockcharts
  2. Aligned with passive capital flows (e.g. the large volume of money that’s passively added to index funds via 401k’s)

Per Investopedia, On-balance volume (OBV) is a technical trading momentum indicator that uses volume flow to predict changes in stock price, which seems to fit the bill.  We’ll see how it holds up when the next correction hits.

COMMENTARY
Higher than expected inflation data was an unwelcome surprise for investors, and sent pundits scrambling for new narratives to justify rate cuts this year.

  • January CPI (y/y)
      • Headline
        • Actual      = +3.1%
        • Prior         = +3.4%
        • Expected = +2.9%
      • Core
        • Actual      = +3.9%
        • Prior        = +3.9%
        • Expected = +3.7%
  • January PPI (y/y)
    • Headline
      • Actual      = +0.9%
      • Prior         = +1.0%
      • Expected = +0.6%
    • Core
      • Actual      = +2.0%
      • Prior        = +1.7%
      • Expected = +3.%

Immediate reaction from markets was as expected, with longer-term (>10 year) interest rates spiking higher and equities dropping.  That said, equities recovered nicely from each surprise.

Lost in the shuffle were poor retail sales figures, which were down 0.8% month over month, versus the expected for a decline of 0.1%.

A light week on tap for economic data, to be replaced with FOMC minutes on Wednesday and several speeches from Fed officials Thursday.

U.S. equity markets are closed tomorrow (Feb 19th)for President’s Day.

Best to Your Week!

P.S. If you find this research helpful, please tell a friend.
If you don’t, tell an enemy.

Sources: Bloomberg, CNBC, Federal Reserve Bank of St. Louis, Hedgeye, Stockcharts.com, U.S. Bureau of Economic Analysis, U.S. Bureau of Labor Statistics

Invest Safely, LLC is an independent investment research and online financial media company.  Use of Invest Safely, LLC and any other products available through invest-safely.com is subject to our Terms of Service and Privacy Policy.
Not a recommendation to buy or sell any security.
Posted in Historical Data, Market Trends | Tagged , , , , | Comments Off on Weekend Stock Market Outlook – February 18 2024

Weekend Stock Market Outlook – February 11 2024

Stock Market Outlook entering the Week of February 11th = Uptrend

  • ADX Directional Indicators: Uptrend
  • Price & Volume Signals: Uptrend

ANALYSIS
The stock market outlook shows an uptrend in place, as U.S. equities continue notching all time highs.

The S&P500 ($SPX) gained 1.4% last week (again).  The index sits ~5% above the 50-day moving average, and 12% above the 200-day moving average.  Since bottoming on October 27, the market has only encountered 1 losing week and rallied ~24%.  Impressive, to say the least.

Technical analysis of daily SPX prices

SPX Price & Volume Chart for the Week of Feb 11 2024

No surprise; no change in the signals this week:  both ADX and price/volume signals show an uptrend in place for the S&P500.  Trading volume has declined slightly since the start of February; not ideal conditions when hitting new, all-time highs, but not a signal to sell either.

COMMENTARY
The S&P500 breached 5,000 for the first time last week.  While there’s nothing “fundamentally” significant about that level, fund managers have been using it for hedging strategies in the options market.

Earnings season is winding down, but that doesn’t mean the fireworks are over.  Artificial intelligence story / semiconductor manufacturer ARM holdings ($ARM) beat estimates after the close on February 7th and the stock price gapped up ~23% overnight.  On the 8th, the stock rallied another 34% intraday, before cooling off a bit at the end of the day.  From the close on the 7th to the close on the 8th, the stock ended up (literally) ~48% higher.  Investors are hoping that price action bodes well for the more widely held stock of Nvidia ($NVDA), which is set to report in a little over a week (Feb 21).

Not every company was so successful; well known names like Paypal($PYPL), Pinterest ($PINS) and Snapchat ($SNAP) were punished for perceived weakness in their financials (revenue, earnings, and/or guidance).

Looking ahead, the latest CPI figures are released on Tuesday, which will once again fire up pundits about the rate cuts.  If inflation comes in higher than consensus, expect some selling pressure on equities.  A lower than consensus data point probably propels U.S. stocks higher.  Later in the week we get retail sales, PPI, and consumer sentiment.

Best to Your Week!

P.S. If you find this research helpful, please tell a friend.
If you don’t, tell an enemy.

Sources: Bloomberg, CNBC, Federal Reserve Bank of St. Louis, Hedgeye, Stockcharts.com, U.S. Bureau of Economic Analysis, U.S. Bureau of Labor Statistics

Invest Safely, LLC is an independent investment research and online financial media company.  Use of Invest Safely, LLC and any other products available through invest-safely.com is subject to our Terms of Service and Privacy Policy.
Not a recommendation to buy or sell any security.
Posted in Historical Data, Market Trends | Tagged , , , , | Comments Off on Weekend Stock Market Outlook – February 11 2024

Weekend Stock Market Outlook – February 04 2024

Stock Market Outlook entering the Week of February 4th = Uptrend

  • ADX Directional Indicators: Uptrend
  • Price & Volume Signals: Uptrend

ANALYSIS
The stock market outlook shows an uptrend in place, as U.S. equities continue notching all time highs.

The S&P500 ($SPX) gained 1.4% last week.  The index sits ~5% above the 50-day moving average, and ~11.5% above the 200-day moving average.  Over the past 25 years or so, the $SPX hasn’t spent a lot of time more than 10% above the 200-day moving average.

Technical analysis of daily SPX prices

SPX Price & Volume Chart for the Week of Feb 04 2024

No change in the signals this week:  both ADX and price/volume signals show an uptrend in place.

COMMENTARY
Last week’s QRA provided mixed signals, and a change in reporting methodology.  It appears the U.S. treasury will have a negative issuance in Q2, meaning that some of it’s outstanding debt will be reduced.

The FOMC kept interest rates unchanged, and threw cold water on the idea of a rate cut in March.  Since the market expect several rate cuts this year, the hawkish tone of the press conference was a surprise.

Non-farm payrolls were higher than expected.  Although some adjustments skewed the number higher, it was still a large beat, and even managed to outperform on a year-over-year viewpoint.

Best to Your Week!

P.S. If you find this research helpful, please tell a friend.
If you don’t, tell an enemy.

Sources: Bloomberg, CNBC, Federal Reserve Bank of St. Louis, Hedgeye, Stockcharts.com, U.S. Bureau of Economic Analysis, U.S. Bureau of Labor Statistics

Invest Safely, LLC is an independent investment research and online financial media company.  Use of Invest Safely, LLC and any other products available through invest-safely.com is subject to our Terms of Service and Privacy Policy.
Not a recommendation to buy or sell any security.
Posted in Historical Data, Market Trends | Tagged , , , , | Comments Off on Weekend Stock Market Outlook – February 04 2024