
Stock Market Outlook entering the Week of February 3rd = Uptrend
- 20/50 Day Moving Averages: Uptrend
- Price & Volume Action: Uptrend
- Objective Elliott Wave Analysis: Uptrend
COMMENTARY
Positive action last week keeps the outlook in an uptrend as we start the month of February. Punxsutawney Phil didn’t see his shadow, so we don’t’ get 6 more weeks of a bear market…that’s how it works, right?
In the weekly view, we see another close at the highs…that’s 5 straight weeks. Three of them on higher than average trading volume. The 2018 Q4 downtrend we’ve been following is finished and prices ended the week above the 40-week moving average. We still don’t have a “low” to use for the new uptrend. But we can say that when we do see that low, it represents a good buying opportunity in the near future, rather than a continuation of the downtrend.
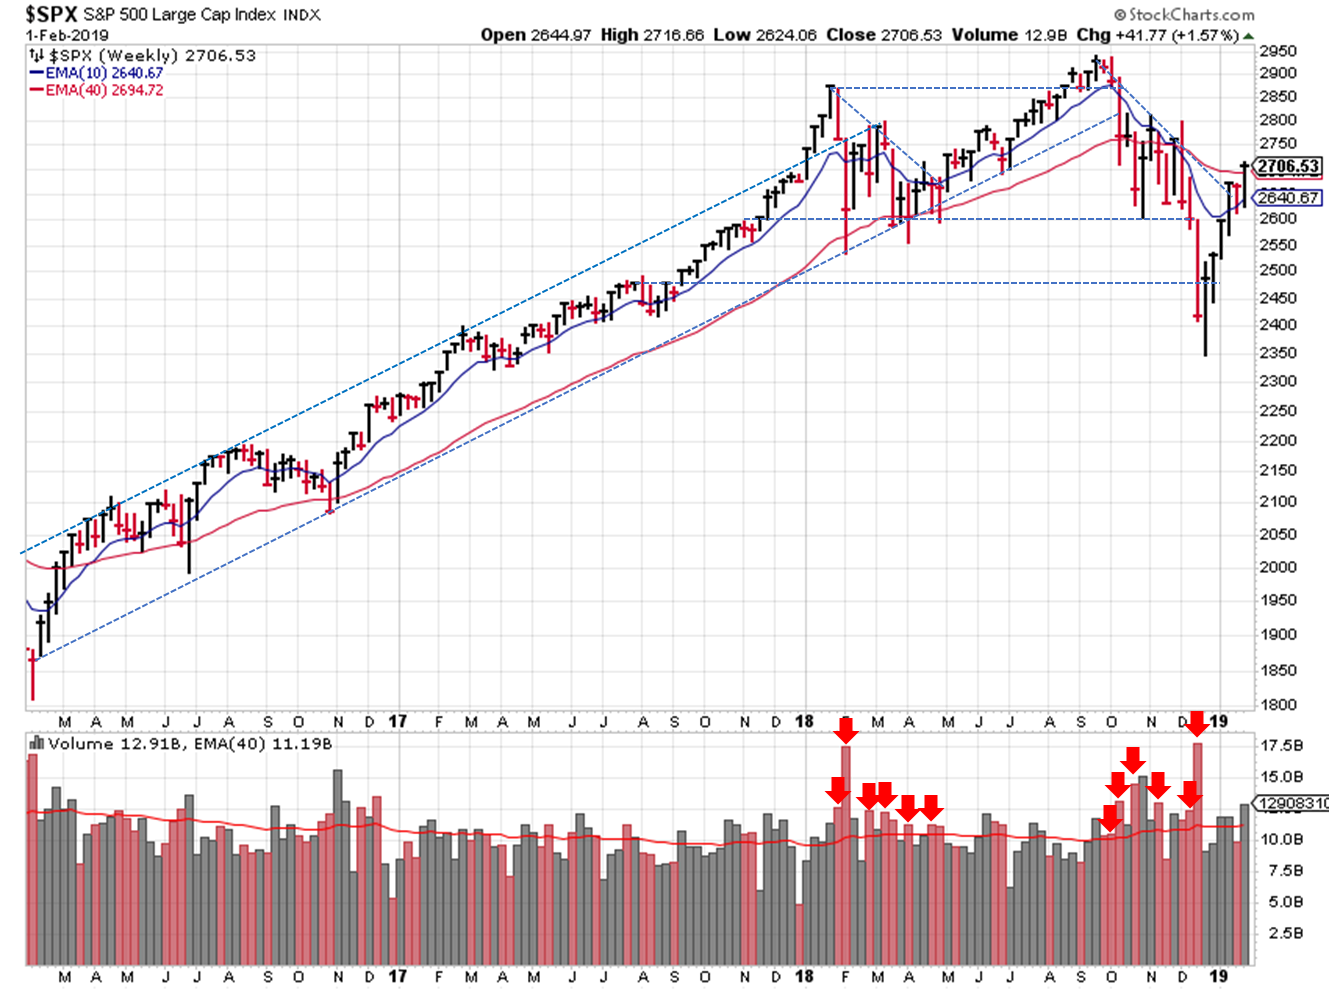
2019-02-03 – SPX Trendline Analysis – Weekly
Switching to a daily view, the S&P ($SPX) found support at the 50-day moving average, broke the 2018 Q4 downtrend, and closed above the 200-day moving average (with volume). Mirroring the weekly view, the SPX still needs to put in a higher “low” price of some kind. For now, we’ll use what we have to estimate the trendline.

2019-02-03 – SPX Trendline Analysis – Daily
The DI+ / DI- continues to show a bullish environment. Price and volume was bullish last week, courtesy of high volume accumulation days. The latest OEW analysis also puts us back in an uptrend, with the probability of a new bull market 80%.
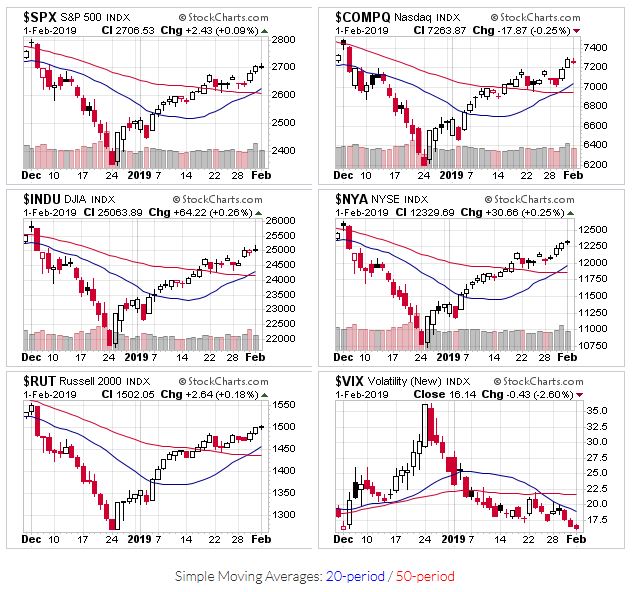
2019-02-03 – US Stock Market Averages
More broadly speaking, all the indexes start the week above their 50 day moving averages. The VIX is back around 16…is that an indication we’ll see a spike in volatility? Asking for a friend…
So what investing “lessons learned” can we take away from January? Don’t fight the Fed. It’s amazing what a few dovish speeches will do in today’s trading environment, considering nothing has changed in the past few weeks (underlying fundamentals, etc.).
If you find this research helpful, please tell a friend. If you don’t find it helpful, tell an enemy. I share articles and other news of interest via Twitter; you can follow me @investsafely. The weekly market outlook is also posted on Facebook and Linkedin.
Once a year, I review the market outlook signals as if they were a mechanical trading system, while pointing out issues and making adjustments. The goal is to give you to give you an example of how to analyze and continuously improve your own systems.
- 2015 Performance – Stock Market Outlook
- 2016 Performance – Stock Market Outlook
- 2017 Performance – Stock Market Outlook
For the detailed Elliott Wave Analysis, go to the ELLIOTT WAVE lives on by Tony Caldaro. Charts provided courtesy of stockcharts.com.


