
Stock Market Outlook entering the Week of January 27th = Uptrend
- 20/50 Day Moving Averages: Uptrend
- Price & Volume Action: Uptrend
- Objective Elliott Wave Analysis: Uptrend
COMMENTARY
No change in signals after a fairly quiet week of trading; the S&P opened at 2671 and closed at 2665. Zooming out, it looks like prices are at an inflection point. The S&P closed just above the 2018 Q4 downtrend two weeks ago but didn’t make much progress last week.
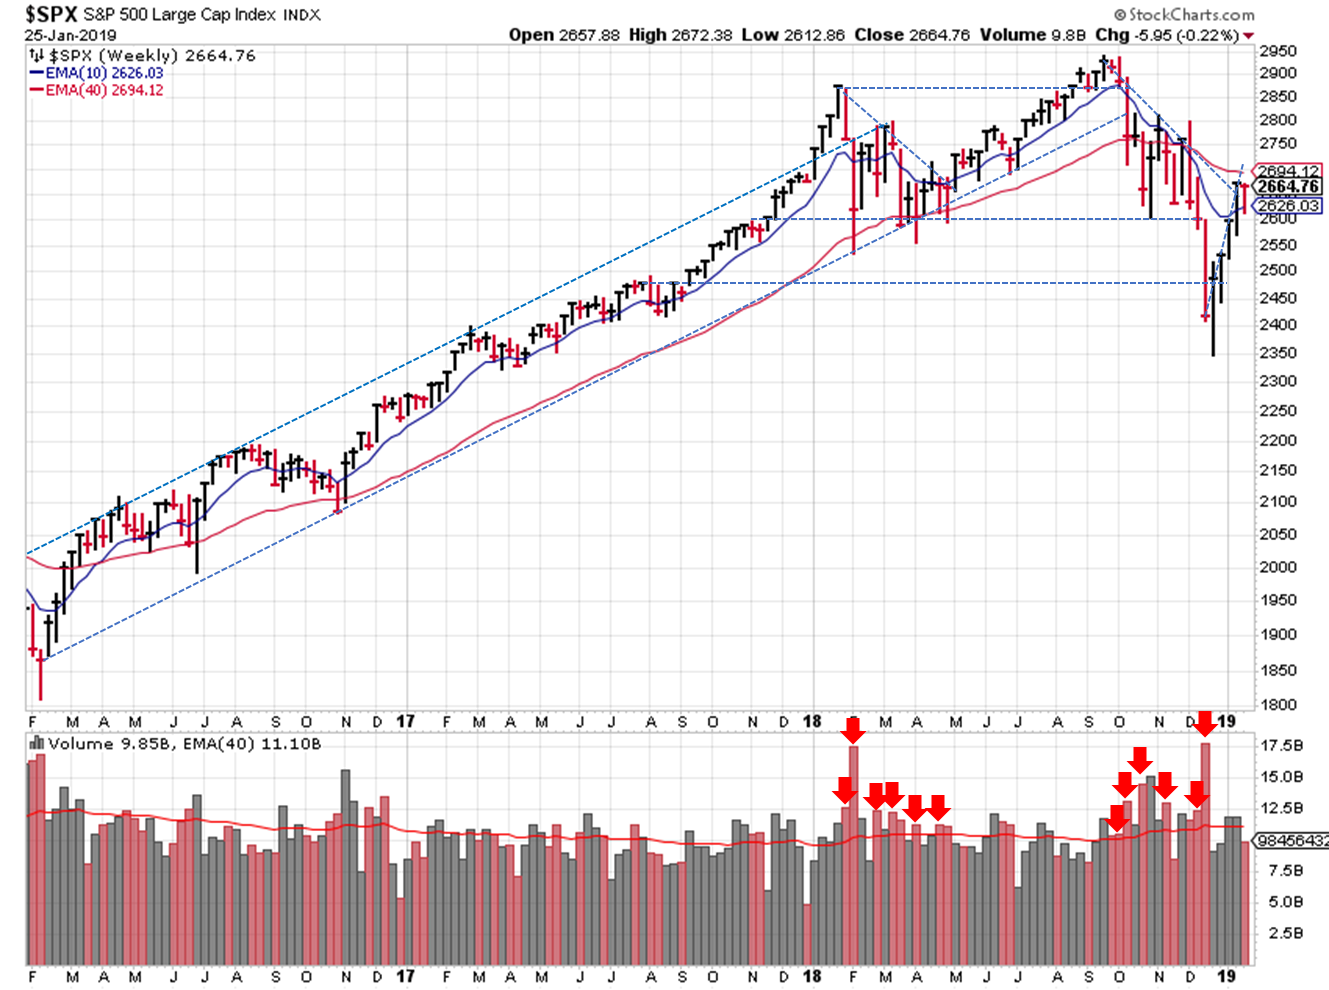
2019-01-27 – SPX Trendline Analysis – Weekly
In fact, the S&P appears to have closed below the recent uptrend line; without a real “lower high” closing price, the uptrend was always tentative. So there’s a small chance that the Q4 downtrend isn’t complete.
Switching to the near-term, the S&P ($SPX) found support at the 50-day moving average, but couldn’t sustain the pace its uptrend, as mentioned above. And prices still haven’t broken the 2018 Q4 downtrend line.
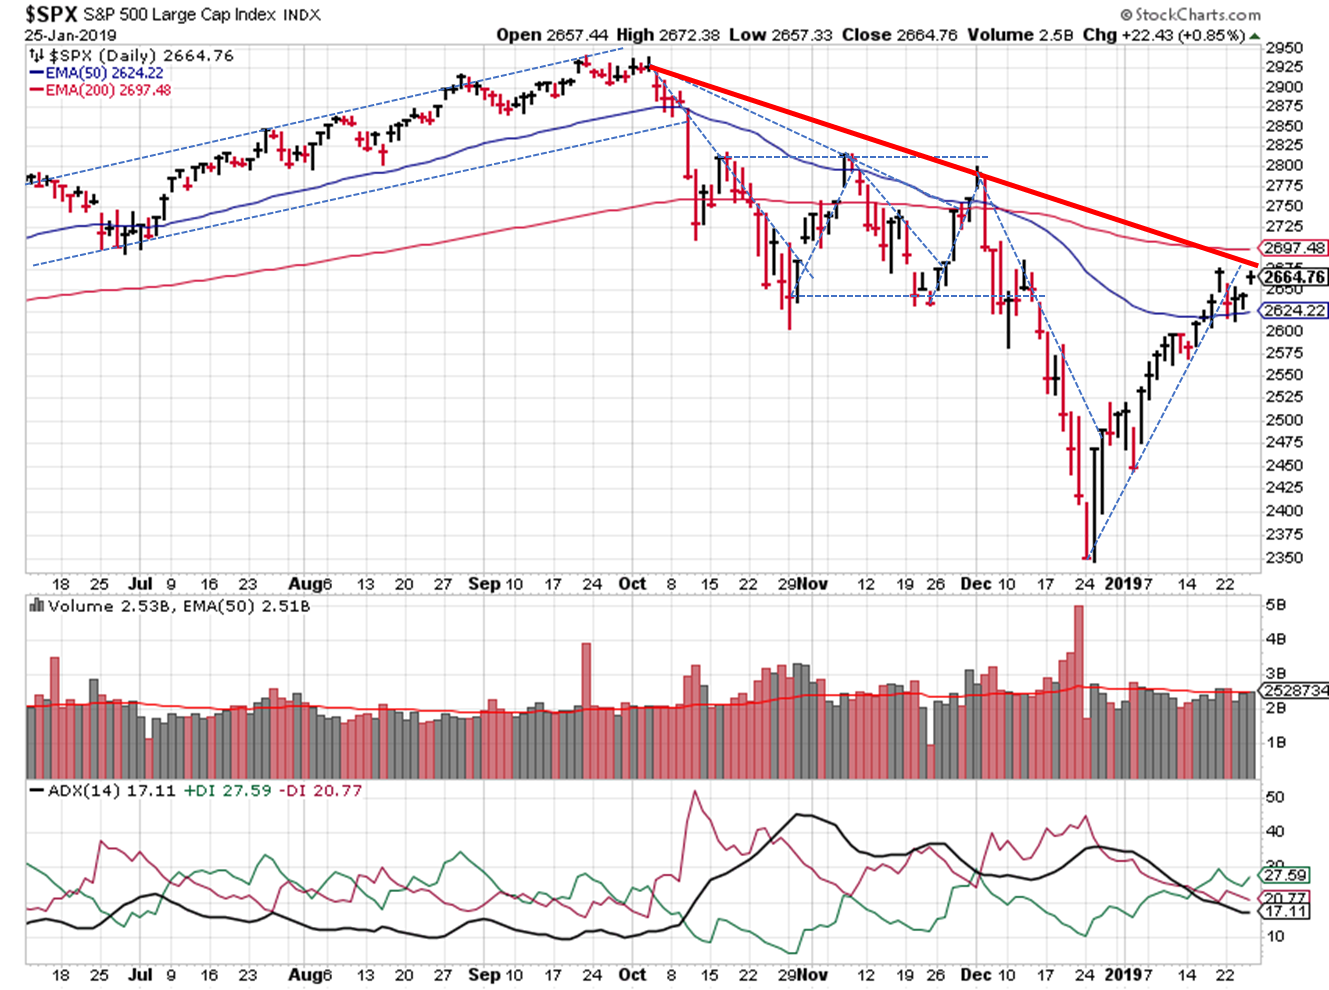
2019-01-27 – SPX Trendline Analysis – Daily
The DI+ / DI- continues to signal a bullish environment. As mentioned last week, we haven’t seen a lower weekly close in some time. I could imagine a scenario where prices meet resistance at the 2018 Q4 downtrend and lose some ground before establishing a real uptrend and moving higher the rest of Q1.
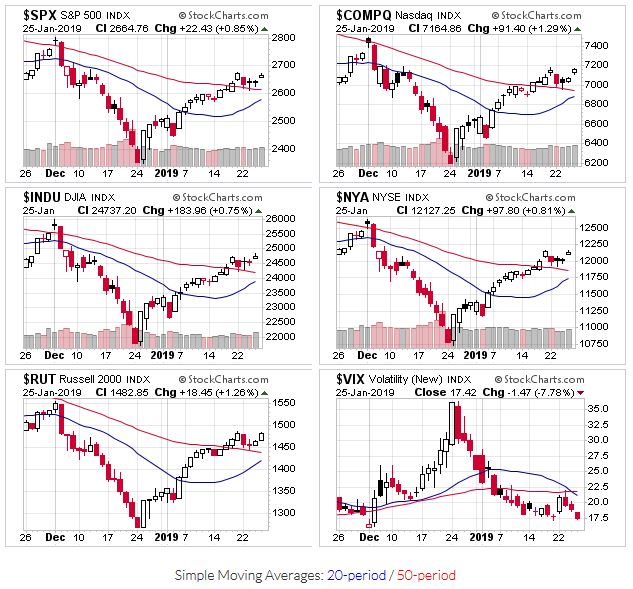
2019-01-27 – US stock market averages
The averages start the week above their 50 day moving averages. Price and volume also looks positive, as the S&P hasn’t seen a distribution day since early January. And finally, OEW puts the probability of an uptrend at 80% this week, and odds of a bull market at 50%.
On the plus side, any extension of the Q4 downtrend or signal change is likely a buy the dip opportunity. And no whipsaw last week!
If you find this research helpful, please tell a friend. If you don’t find it helpful, tell an enemy. I share articles and other news of interest via Twitter; you can follow me @investsafely. The weekly market outlook is also posted on Facebook and Linkedin.
Once a year, I review the market outlook signals as if they were a mechanical trading system, while pointing out issues and making adjustments. The goal is to give you to give you an example of how to analyze and continuously improve your own systems.
- 2015 Performance – Stock Market Outlook
- 2016 Performance – Stock Market Outlook
- 2017 Performance – Stock Market Outlook
For the detailed Elliott Wave Analysis, go to the ELLIOTT WAVE lives on by Tony Caldaro. Charts provided courtesy of stockcharts.com.


