
Market Outlook entering the Week of March 15th = Uptrend @ Risk
MOVING AVERAGES
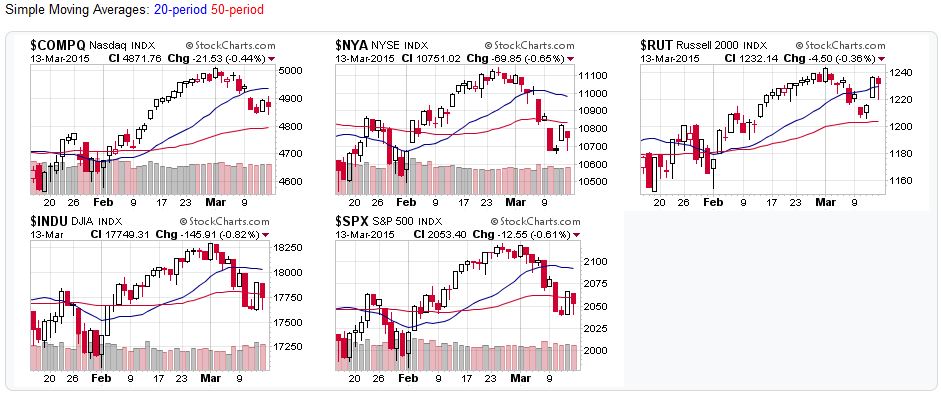
- Short-term (20 DMA): Downtrend
With the exception of the Russell 2000, all the major stock market averages remained below their 20-day moving averages.
- Intermediate (50 DMA): Sell Signal
With the exception of the NASDAQ and Russell 2000, the major stock market averages fell below their 50-day moving averages.
- Long-term (200 DMA): Uptrend
All the major stock market averages remained above their 200-day moving averages.
COMMENTARY
U.S. equities continued to struggle last week, and high-volume selling dominated Friday’s trading session for the third week in a row. Last minute trading softened the blow covering up the day’s weakness. Most of the indexes remained below their 20 DMA, and a few also took out the 50 DMA. If we see continued weakness (the remaining averages take out their 50 DMA) and/or another day of high volume selling, the latest rally is as good as gone.
Intermediate-term Elliott Wave Analysis support and resistance levels fell again, back to the levels seen during early February:
- Resistance: 2,070 / 2,085
- Support: 1,973 / 2,019
2015-03-15 – US Stock Market Averages
Sources:
For the detailed Elliott Wave Analysis, go to the ELLIOTT WAVE lives on by Tony Caldaro. For price/volume data, head to stockcharts.com.
Moving Average Signals:
- Uptrend=Market indexes remained above their moving average during the trading week
- Downtrend=Market indexes remained below their moving average during the trading week
- Buy signal=Market indexes fell below their moving averages during the trading week
- Sell signal=Market indexes rose above their moving averages during the trading week


