Stock Market Outlook entering the Week of February 16th = Uptrend
- ADX Directional Indicators: Uptrend
- Institutional Activity (Price & Volume): Uptrend
- On Balance Volume Indicator: Uptrend
ANALYSIS
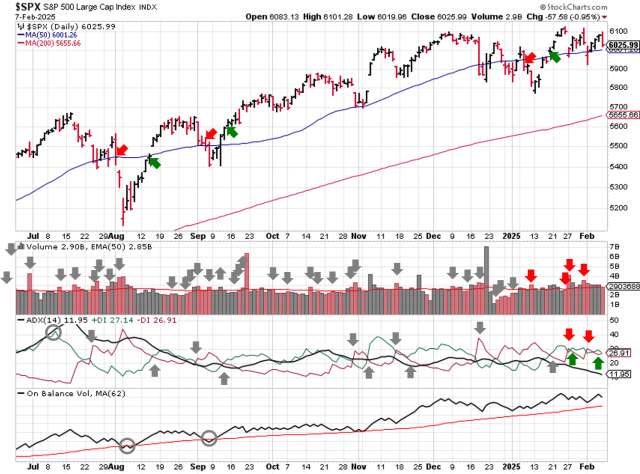
The stock market outlook remains in an uptrend, with the S&P500 on the verge of breaking out to new highs.
The S&P500 ( $SPX ) rose 1.5% last week. The index is ~2% above the 50-day moving average and ~8% above the 200-day moving average.

SPX Price & Volume Chart for Feb 16 2025
The ADX continues working overtime, just like last week, flipping from bullish to bearish, then back to bullish again. Talk about whiplash…and another reason to use more than 1 signal. With an overall reading below 10, the ADX isn’t providing much “signal” anyway. Institutional activity remains in an uptrend, as does On-Balance Volume.

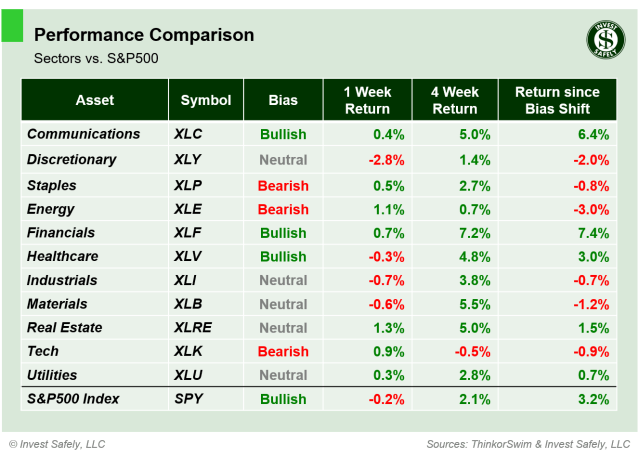
S&P Sector Performance for Week 07 of 2025
Technology staged a big rebound last week, leading all sectors higher. Healthcare, after showing a few weeks of relative strength, took a break and was the worst performer. Several sectors flipped back to bullish bias:
- Consumer Staples ( $XLP )
- Technology ( $XLK )
- Materials ( $XLB )
- Real Estate ( $XLRE )
- Utilities ( $XLU )
Energy ( $XLE ) improved to neutral, despite Oil’s somewhat sluggish performance recently.

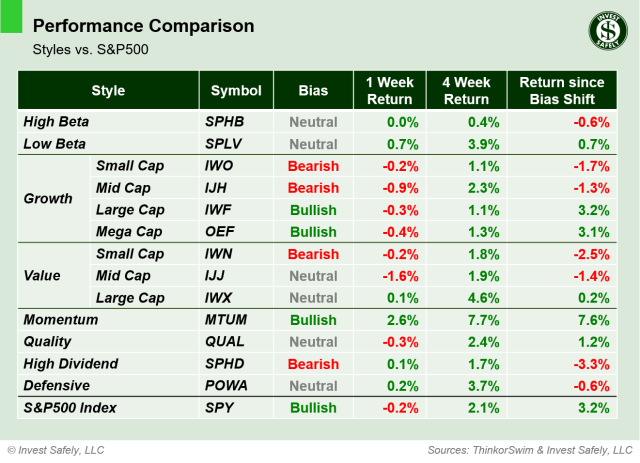
Sector Style Performance for Week 07 of 2025
The Momentum ( $MTUM ) style outperformed again last week, while Defensive names ( $POWA ) lagged. Several styles flipped back to bullish bias:
- High Beta ( $SPHB )
- Low Beta ( $SPLV )
- Large Cap Value ( $IWX )
- Quality ( $QUAL )
High Dividend ( $SPHD ) improved from bearish to neutral.

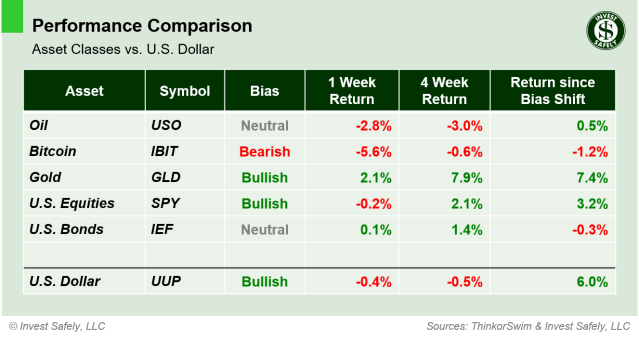
Asset Class Performance for Week 07 2025
After a couple rough weeks, Bitcoin ( $IBIT ) edged out U.S. equities as the best performer last week. It still needs a bit more improvement to get back to a bullish bias. The U.S. Dollar was the worst performer, and moved from bullish to bearish bias for the first time since October (could be a good thing for international equities and other negatively correlated assets).
COMMENTARY
The consumer price index (CPI) rose for the 4th consecutive month, getting back to 3%. Core CPI increased as well, but has remained relatively flat since June 2024.
| CPI (y/y) | Actual | Prior |
Expected |
| Headline | +3.0% | +2.9% | +2.9% |
| Core | +3.3% | +3.2% | +3.2% |
Producer prices (PPI) were flat in January, thanks to a 20 basis point increase (+0.2%) in December’s reading. PPI has mirrored CPI, in that both have risen steadily since September. Core PPI fell 10 basis points (-0.10%), but again, that’s only because December’s reading also increased by 20 basis points.
| PPI (y/y) | Actual | Prior |
Expected |
| Headline | +3.5% | +3.5% | +3.2% |
| Core | +3.6% | +3.7%* | +3.3% |
Finally, January retail sales fell 0.9% versus December, much worse than the forecast for -0.1%. Sales were also down versus last January.
No major tariff or trade rumors heading into the weekend, but U.S. markets are closed Monday for President’s Day.
Best to Your Week!
P.S. If you find this research helpful, please tell a friend.
If you don’t, tell an enemy.