Weekend Stock Market Outlook

Stock Market Outlook entering the Week of October 15th = Uptrend

  • 20/50 Day Moving Averages: Uptrend
  • Price & Volume Action: Uptrend
  • Objective Elliott Wave Analysis: Uptrend

COMMENTARY
Another uneventful week in the markets and the latest uptrend rolls on.  After a small spike, volatility resumed its downward trend.

All the indexes remain above their 20 and 50 day moving averages.

Price chart for $INDU,$NYA,$SPX,$USD,$COMPQ,$CRB,$RUT,$GOLD

2017-10-15 – US Stock Market Averages

Price and volume action remains positive; early September break-outs are holding on to their recent gains.

OEW also remains in a uptrend, citing this uptrend’s ability to grind out higher highs.


If you find this research helpful, please tell a friend. I share articles and other news of interest via Twitter; you can follow me @investsafely. The weekly market outlook is also posted on Facebook and Linkedin.

You can check out how well (or poorly) the outlook has tracked the market using past performance estimates:

For the detailed Elliott Wave Analysis, go to the ELLIOTT WAVE lives on by Tony Caldaro.  Charts provided courtesy of stockcharts.com.


Posted in Historical Data, Market Trends, Other Blogs | Tagged , , , , | Comments Off on Weekend Stock Market Outlook

Weekend Stock Market Outlook

Stock Market Outlook entering the Week of October 8th = Uptrend

  • 20/50 Day Moving Averages: Uptrend
  • Price & Volume Action: Uptrend
  • Objective Elliott Wave Analysis: Uptrend

COMMENTARY
No changes again this week, after another strong showing by the US markets; volatility is approaching record lows again.  Now is the time when most investors get complacent; don’t be most investors.  Stick to your rules, lock in gains when targets are hit, and always keep your losses small.

All the indexes remain above their 20 and 50 day moving averages.

Price action for $INDU,$NYA,$SPX,$USD,$COMPQ,$CRB,$RUT,$GOLD

2017-10-08 – US Stock Market Averages

Price and volume action continues to look positive as more distribution days fell outside the tracking timeframe.

OEW remains in a uptrend; when it completes, be on the lookout for our largest corrections since 2016.  Although, that’s probably on the order to 7-10%, so more of a buying opportunity.


If you find this research helpful, please tell a friend. I share articles and other news of interest via Twitter; you can follow me @investsafely. The weekly market outlook is also posted on Facebook and Linkedin.

You can check out how well (or poorly) the outlook has tracked the market using past performance estimates:

For the detailed Elliott Wave Analysis, go to the ELLIOTT WAVE lives on by Tony Caldaro.  Charts provided courtesy of stockcharts.com.


Posted in Historical Data, Market Trends, Other Blogs | Tagged , , , , | Comments Off on Weekend Stock Market Outlook

Weekend Stock Market Outlook

Stock Market Outlook entering the Week of October 1st = Uptrend

  • 20/50 Day Moving Averages: Uptrend
  • Price & Volume Action: Uptrend
  • Objective Elliott Wave Analysis: Uptrend

COMMENTARY
October, already?  The uptrend rolls on, with no change in signals this week.  Many of blogs / newsletters I read continue to sound the alarm regarding pensions, government debt, monetary policy, and the growing disconnect between stock prices and underlying fundamental values.  But the fact remains that US equity markets remain the least dirty shirt in the hamper, so to speak, and as such are likely to see continued capital inflows.

All the indexes remain above their 20 and 50 day moving averages to kick off the week.

Price action for $INDU,$NYA,$SPX,$USD,$COMPQ,$CRB,$RUT,$GOLD

2017-10-01 – US Stock Market Averages

Leading stocks continue to move higher, although proper bases and buy points are still lacking.  The second point is actually not surprising; without proper corrections, proper bases don’t get built.  My hypothesis: the lack of actual corrections is the reason I see a lot more flat bases and or base on base patterns, verses cups and double bottoms.

The OEW uptrend remains in place to start October as well.


If you find this research helpful, please tell a friend. I share articles and other news of interest via Twitter; you can follow me @investsafely. The weekly market outlook is also posted on Facebook and Linkedin.

You can check out how well (or poorly) the outlook has tracked the market using past performance estimates:

For the detailed Elliott Wave Analysis, go to the ELLIOTT WAVE lives on by Tony Caldaro.  Charts provided courtesy of stockcharts.com.


Posted in Historical Data, Market Trends, Other Blogs | Tagged , , , , | Comments Off on Weekend Stock Market Outlook

Weekend Stock Market Outlook

Stock Market Outlook entering the Week of September 24th = Uptrend

  • 20/50 Day Moving Averages: Uptrend
  • Price & Volume Action: Uptrend
  • Objective Elliott Wave Analysis: Uptrend

COMMENTARY
The market signals are still coming up green, with no changes to the overall signal set.  What I can I say?  Low volatility (measured by the $VIX) and falling dollar make for boring updates to the market outlook.

All the indexes remain above their 20 and 50 day moving averages to kick off the week.

Price charts for $INDU,$NYA,$SPX,$USD,$COMPQ,$CRB,$RUT,$GOLD

2017-09-24 – US Stock Market Averages

Distribution days continue to drop off the count, putting the indexes in more “robust” territory.  The Russell 2000 has staged an impressive climb since hitting its 200 day moving average, showcasing leadership from small caps (a positive sign).  Also, more leading stocks broke out last week; trading volume has been just good enough.

OEW continues to show an uptrend in progress.


If you find this research helpful, please tell a friend. I share articles and other news of interest via Twitter; you can follow me @investsafely. The weekly market outlook is also posted on Facebook and Linkedin.

You can check out how well (or poorly) the outlook has tracked the market using past performance estimates:

For the detailed Elliott Wave Analysis, go to the ELLIOTT WAVE lives on by Tony Caldaro.  Charts provided courtesy of stockcharts.com.


Posted in Historical Data, Market Trends, Other Blogs | Tagged , , , , , | Comments Off on Weekend Stock Market Outlook

Weekend Stock Market Outlook

Stock Market Outlook entering the Week of September 17th = Uptrend

  • 20/50 Day Moving Averages: Uptrend
  • Price & Volume Action: Uptrend
  • Objective Elliott Wave Analysis: Uptrend

COMMENTARY
One small change in the signal set as all 3 start this week in an uptrend.  It looks like neither hurricanes nor North Korea can stop this bull.  Eventually, something will wear it out.  But until then, it’s rally on.

All the indexes start the week above their 20 and 50 day moving averages.

Price charts for $INDU,$NYA,$SPX,$USD,$COMPQ,$CRB,$RUT,$GOLD

2017-09-17 – US Stock Market Averages

New price highs combined with higher trading volume to give us a welcome signal last week in the form of accumulation. And that puts the markets in a strong position to start this week.  Most leading stocks are still extended from proper buy points, so be on the lookout for new leadership to emerge (maybe cyclicals).

OEW confirmed an uptrend last week as the markets broke to new highs.


If you find this research helpful, please tell a friend. I share articles and other news of interest via Twitter; you can follow me @investsafely. The weekly market outlook is also posted on Facebook and Linkedin.

You can check out how well (or poorly) the outlook has tracked the market using past performance estimates:

For the detailed Elliott Wave Analysis, go to the ELLIOTT WAVE lives on by Tony Caldaro.  Charts provided courtesy of stockcharts.com.


Posted in Historical Data, Market Trends, Other Blogs | Tagged , , , , , | Comments Off on Weekend Stock Market Outlook

Weekend Stock Market Outlook

Stock Market Outlook entering the Week of September 10th = Uptrend

  • 20/50 Day Moving Averages: Uptrend
  • Price & Volume Action: Uptrend
  • Objective Elliott Wave Analysis: Mixed

COMMENTARY
No change from last week’s signal set, but the price action doesn’t leave us with that warm, fuzzy feeling.  We did see trading volume return, but so did sellers.  Traders brushed off North Korean concerns and one hurricane.  Will Hurricane Irma (and potentially Jose) stop this bull market?

The Nasdaq and S&P500 begin the week above their 20 and 50 day moving averages.  The Dow starts this week above the 50 day, but below the 20 day.  And finally, the Russell 2000 is below the 50 day, but above the 20 day.  With a majority of the indexes above their 50 day, we’ll keep the uptrend signal in place for this week.

Price Trends for $INDU,$NYA,$SPX,$USD,$COMPQ,$CRB,$RUT,$GOLD

2017-09-10 – US Stock Market Averages

Most of the indexes added a distribution day to their already elevated count.  Given this environment, it shouldn’t be surprising that most leading stocks that have broken out haven’t made much progress.  Even more concerning is the lack of trading volume during those breakouts.  Ideally, you’d like to see volumes at least 50% higher than average.  That said, these stocks aren’t breaking down either.

Given the lack of progress by leading stocks, it probably also isn’t surprising that OEW continues to show the market at an inflection point.  We continue to wait for a break of key support levels to know which way this market is headed.


If you find this research helpful, please tell a friend. I share articles and other news of interest via Twitter; you can follow me @investsafely. The weekly market outlook is also posted on Facebook and Linkedin.

You can check out how well (or poorly) the outlook has tracked the market using past performance estimates:

For the detailed Elliott Wave Analysis, go to the ELLIOTT WAVE lives on by Tony Caldaro.  Charts provided courtesy of stockcharts.com.


Posted in Historical Data, Market Trends, Other Blogs | Tagged , , , , , | Comments Off on Weekend Stock Market Outlook

Weekend Stock Market Outlook

Stock Market Outlook entering the Week of September 2nd = Uptrend

  • 20/50 Day Moving Averages: Uptrend
  • Price & Volume Action: Uptrend
  • Objective Elliott Wave Analysis: Mixed

COMMENTARY
Aggressive buying on Thursday put the markets in good position to kick-off September trading, and the outlook has regained uptrend status.  There are still reasons for concern, so we’ll look to this week’s trading action for more concrete direction.  In the US, the weeks starts with the markets closed for Labor Day.

All the indexes begin this week above their 20 and 50 day moving averages.   Even the Russell 2000 joined the party, bouncing back from it’s recent weakness and climbing out of bear market territory.

Price Action for $INDU,$NYA,$SPX,$USD,$COMPQ,$CRB,$RUT,$GOLD

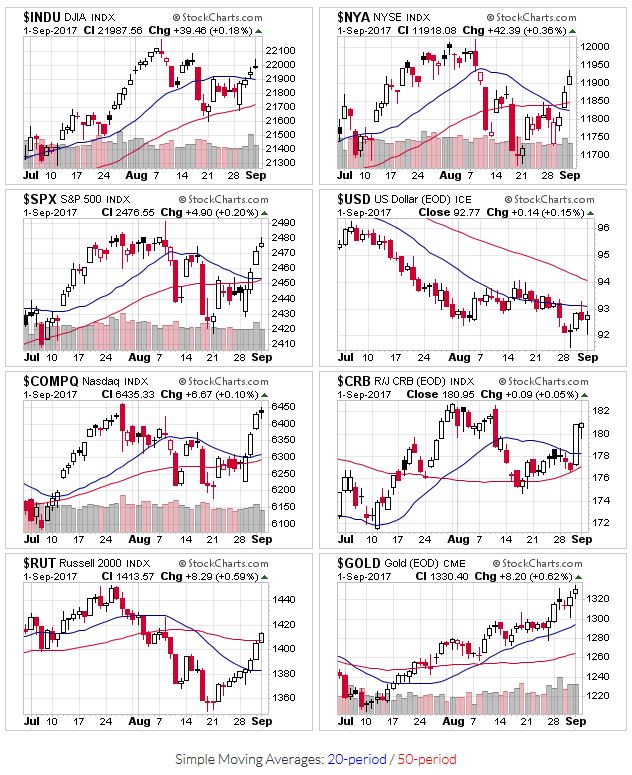
2017-09-02 – US Stock Market Averages

Last week was definitely an accumulation week, as trading volume rose with prices.  And there were even a few breakouts.  So we can change the outlook back to an uptrend.  That said, I am still cautious though, as the price patterns for a majority of leading stocks (i.e. stocks with the best fundamentals) are still under construction.  Most are have had substantial run ups since November of last year, and are just beginning to form new bases.  The markets still have a high distribution day count over the past 4 weeks as well.  If we see another strong showing this week,

OEW shows the market at an inflection point, so we could see prices go either direction.  I’ve tried to be definitive this year (uptrend or downtrend), but there really isn’t’ a clear direction from OEW right now.  We just have to watch price action unfold.

Typically, this week also marks the end of summer vacation season; hopefully we’ll see a return of trading volume.  As mentioned last week, September is a notoriously weak month in terms of return.  Combine these traits, and I expect the markets will cross their moving averages a few times, meaning we’ll likely see changes between uptrends and downtrends as we work our way through the month.


If you find this research helpful, please tell a friend. I share articles and other news of interest via Twitter; you can follow me @investsafely. The weekly market outlook is also posted on Facebook and Linkedin.

You can check out how well (or poorly) the outlook has tracked the market using past performance estimates:

For the detailed Elliott Wave Analysis, go to the ELLIOTT WAVE lives on by Tony Caldaro.  Charts provided courtesy of stockcharts.com.


Posted in Historical Data, Market Trends, Other Blogs | Tagged , , , , , | Comments Off on Weekend Stock Market Outlook