Great Recession Revisited?

A few days back, a reader sent me an email entitled “Great Recession Revisited”.  The note included the following tweet, and asked if I felt the same way:

I certainly understand the sentiment.  No confidence in the Fed or government?  Check.

Unrelenting selling?  No bottom is sight?  Definitely feels that way, especially this December.

Down 1-3% on a daily basis?  True, but we’ve been in an abnormally low volatility market recently, so I think that feels worse than it really is…FWIW, 2008-2009 was more like 3-5% on a daily basis.

Hopelessness on par with 2008-2009?  Uh…no.  Not even close.   Back then, the recession was in full swing; layoffs were everywhere, nightly news focused on the collapse of financial institutions, and small companies were having problems making payroll because of illiquid credit markets!

Is there apprehension?  You better believe it.  Economic fundamentals are beginning to decline and we have a few warning signs for a recession in the next 9-24 months.

Check out last week’s review of economic indicators in “On My Radar” from Steve Blumenthal:

  • High risk of global recession?  Check!
  • Unemployment?  Actually, labor markets are still improving.
  • Yield curve?  Flattening, but not inverted yet.
  • Credit conditions? Favorable.
  • Corporate Debt?  A lot…not good!
  • Valuations?  Even higher than 2007, before the Great Recession…also not good!

So while some aspects are a bit off, I agree with embracing the fear and uncertainty and learning from it.  Looking through Steve’s charts, 2006 and 2007 painted a similar picture to the above.  Outside of those economic indicators, I see a lot of similarity between 2018 and 2007 as well.  Check out the VIX…

Daily VIX level for the past 20 years

We’re just beginning to experience the volatility coming off record lows…just like 2006 and 2007.

Price action is also similar to late 2007…eerily similar for the S&P500.  The timeframe is off by a week or two, but overall results are similar.  A 16% decline by the start of the new year (1).

2008-01-18 - SPX Technical Analysis - Weekly

2008-01-18 – SPX Technical Analysis – Weekly

Bear Sterns went under that March and the S&P hit a new low, before indexes rallied back to a trendline (2).  By mid-2008, stocks were just one of MANY types of investments getting hammered, and that was before volatility really took off (3,4).

2008-12-18 - SPX Technical Analysis - Weekly

2008-12-18 – SPX Technical Analysis – Weekly

The saying goes “History doesn’t repeat, but it often rhymes”.  If we’re going to see another 2008-2009 style, recessionary sell-off, I’d expect economic indicators to be weaker beforehand.  There’s no shortage of reasons that could happen, so pick your poison.  In the meantime, that would give stocks a chance to rebound, creating the classic bull trap (2).

2001-2019 - SPX Weekly Price Chart

Or, maybe the “bull trap” occurred in 2018 Q3…maybe we have one, last rip your face off rally!  No one really knows.  As has been said many times on this blog, “You can’t predict, you can only prepare.”

Great Recession revisited?  Not quite…or at least not yet.  Instead, the markets have given investors a wake up call.   So the question isn’t whether we’re going to see another recession…the question is “What are you doing to prepare?”

Posted in Uncategorized | Comments Off on Great Recession Revisited?

Weekend Stock Market Outlook

Stock Market Outlook entering the Week of December 23rd = Downtrend

  • 20/50 Day Moving Averages: Downtrend
  • Price & Volume Action: Downtrend
  • Objective Elliott Wave Analysis: Downtrend

COMMENTARY
Investors say that prices take the stairs on the way up, and the escalator on the way down.  I think the market opted for the elevator this month.  But there’s still hope; the Santa Claus rally (sustained increases in the stock market that begin on December 26th and extend through January 2nd) is still on the table.

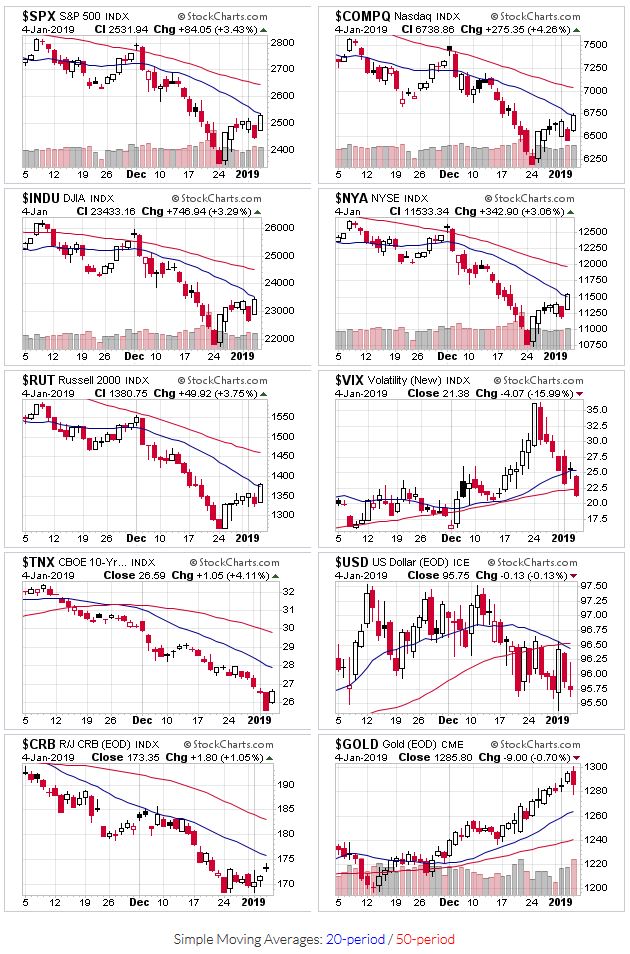
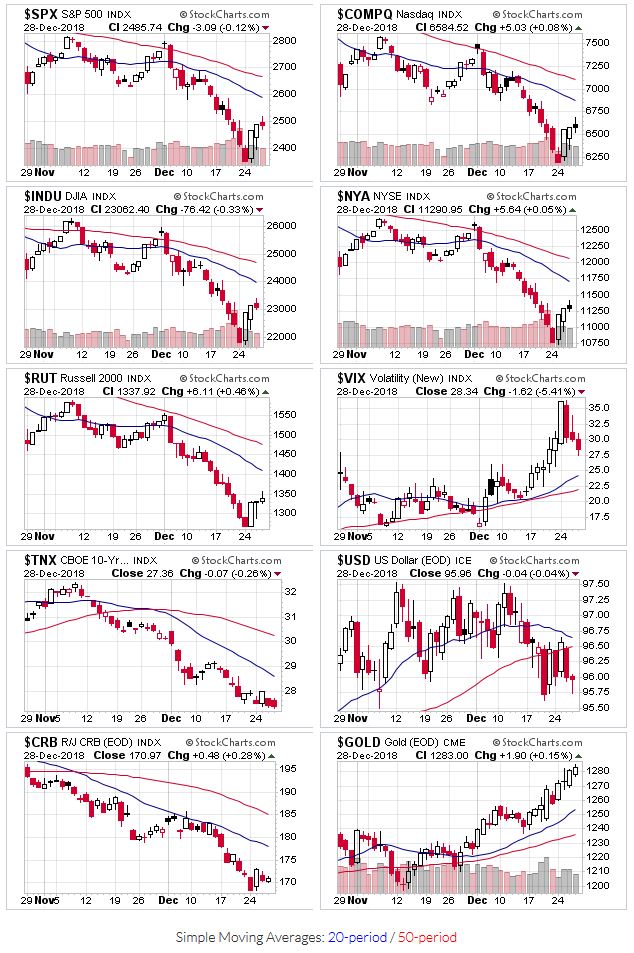
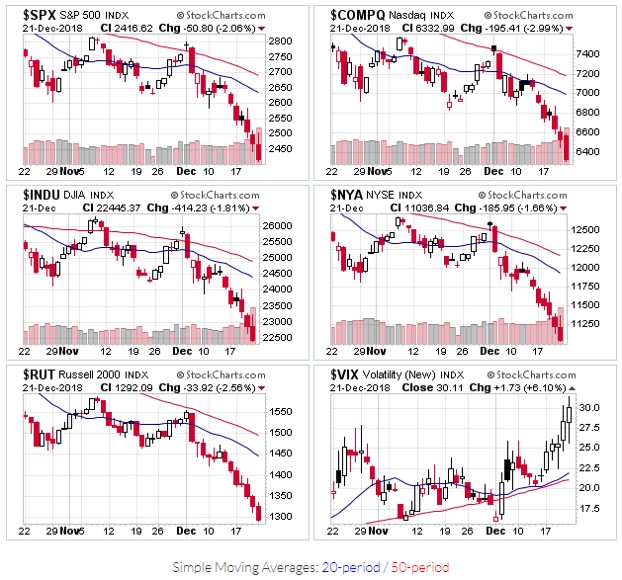
All the indexes are WAY below their 20, 50, and 200 day moving averages.

Price Charts for $SPX, $COMPQ, $INDU, $NYA, $RUT, $VIX

2018-12-23 – US Stock Market Averages

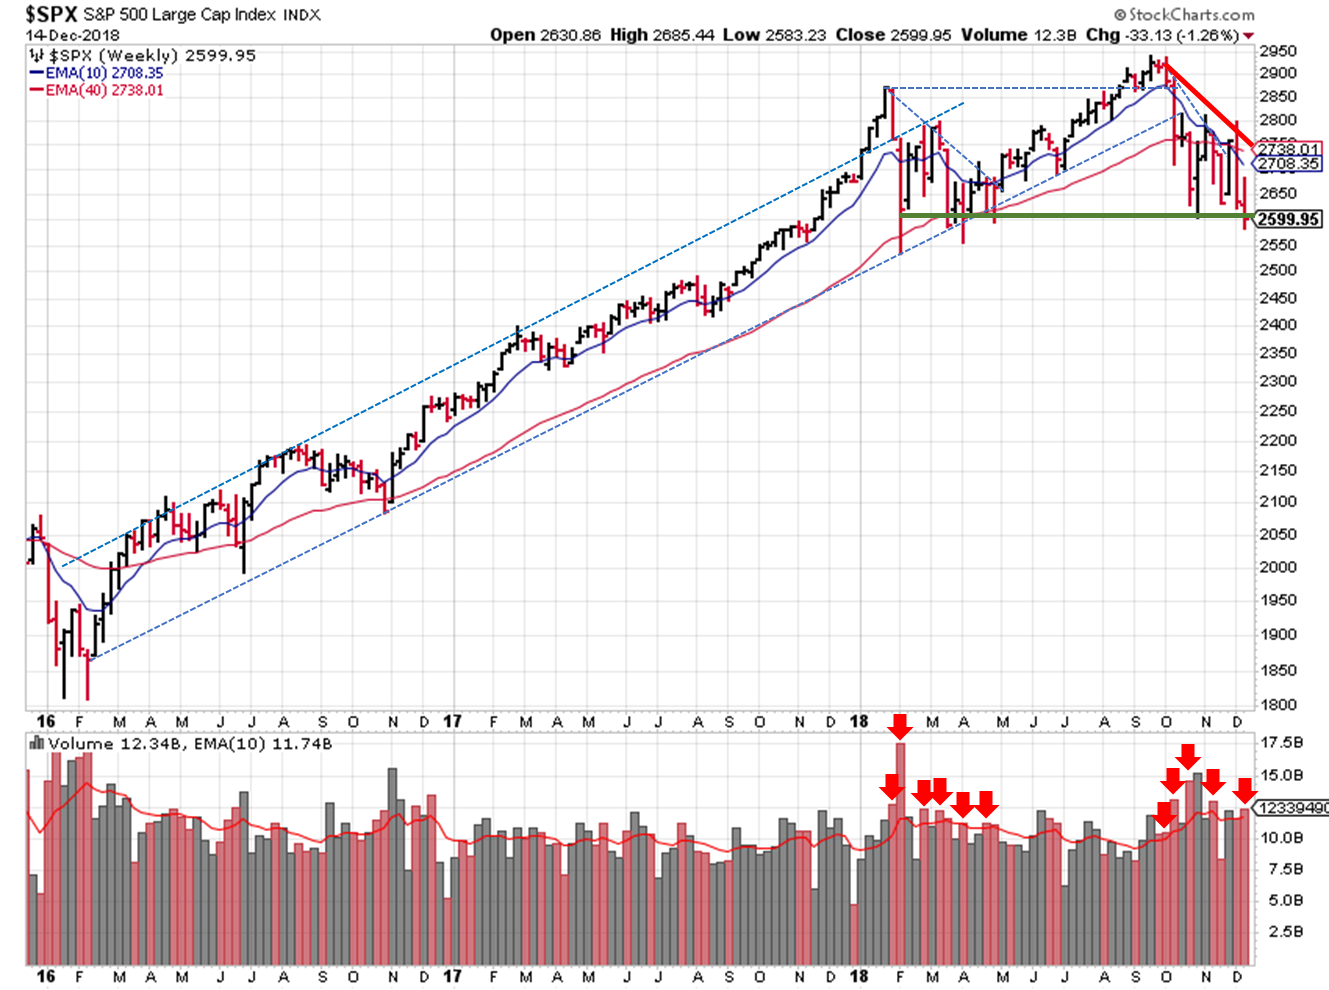
The price/volume combo remains in a downtrend as well.  Volume rose during the week, then exploded Friday. The quadruple witching day (market index futures, market index options, stock options and stock futures expired) at the end of the last full trading week in 2018 was the main catalyst.

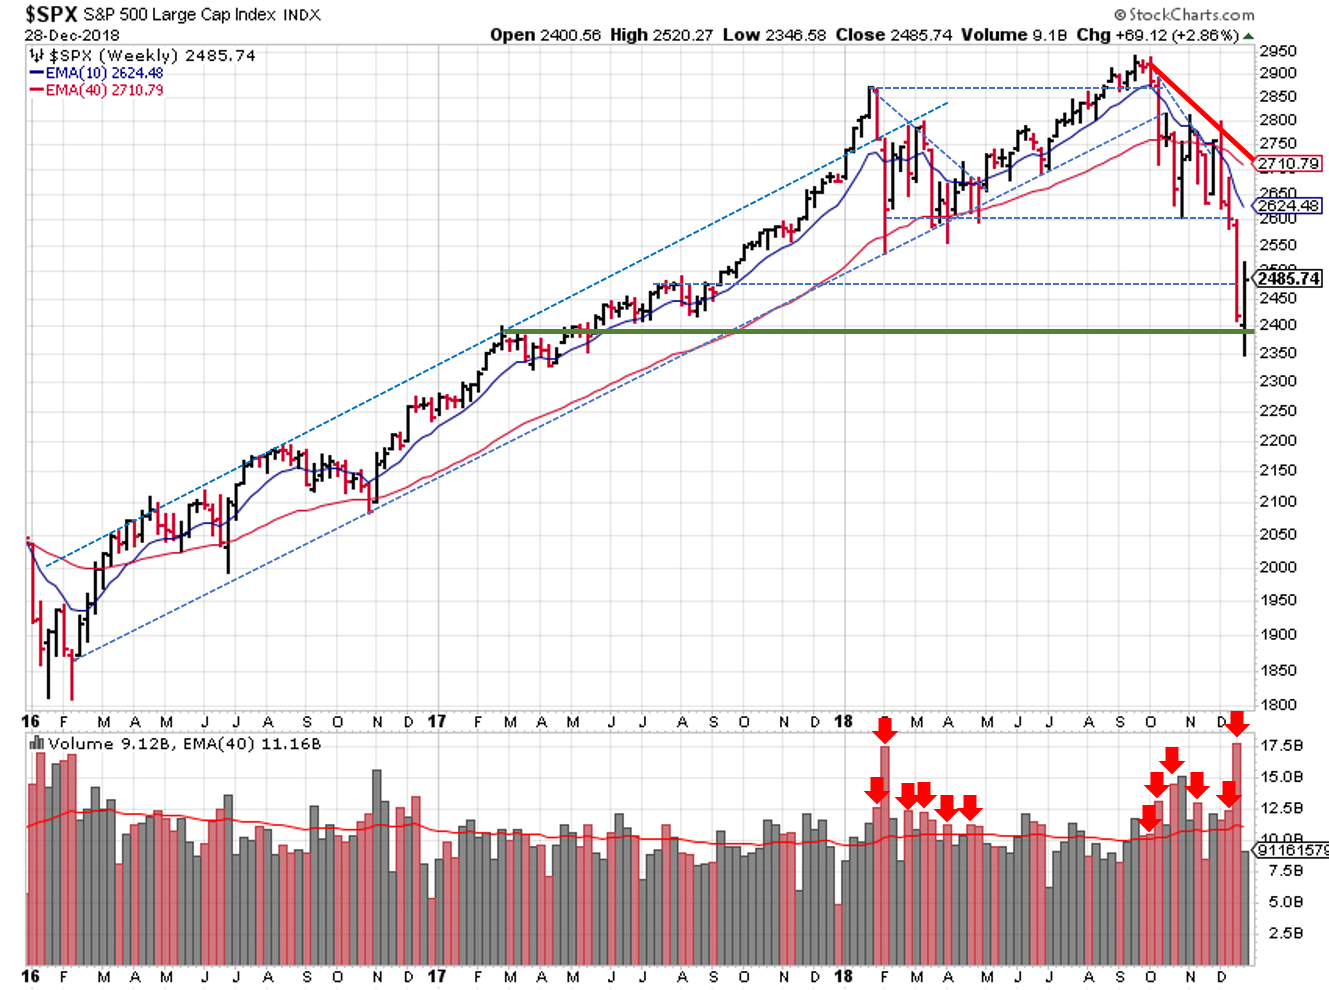
OEW (downtrend) saw last week expected support level wiped out by falling prices:

There were three Fibonacci retracement levels for support..: (38.2%) 2509, (50.0%) 2376, and (61.8%) 2242. Obviously the first one did not hold. Our worse case support has been around SPX 2400, which is also close to the 50% retracement…

On to some trendlines. Sadly, there was no bounce back to the recent trading range, nor was there a floor of support from early 2018.  The S&P ($SPX) fell to prices we haven’t seen in over a year (August 2017).  Now we need to go back almost 2 years to see where we might bottom…elevator indeed.

2018-12-23 - SPX Technical Analysis - Daily

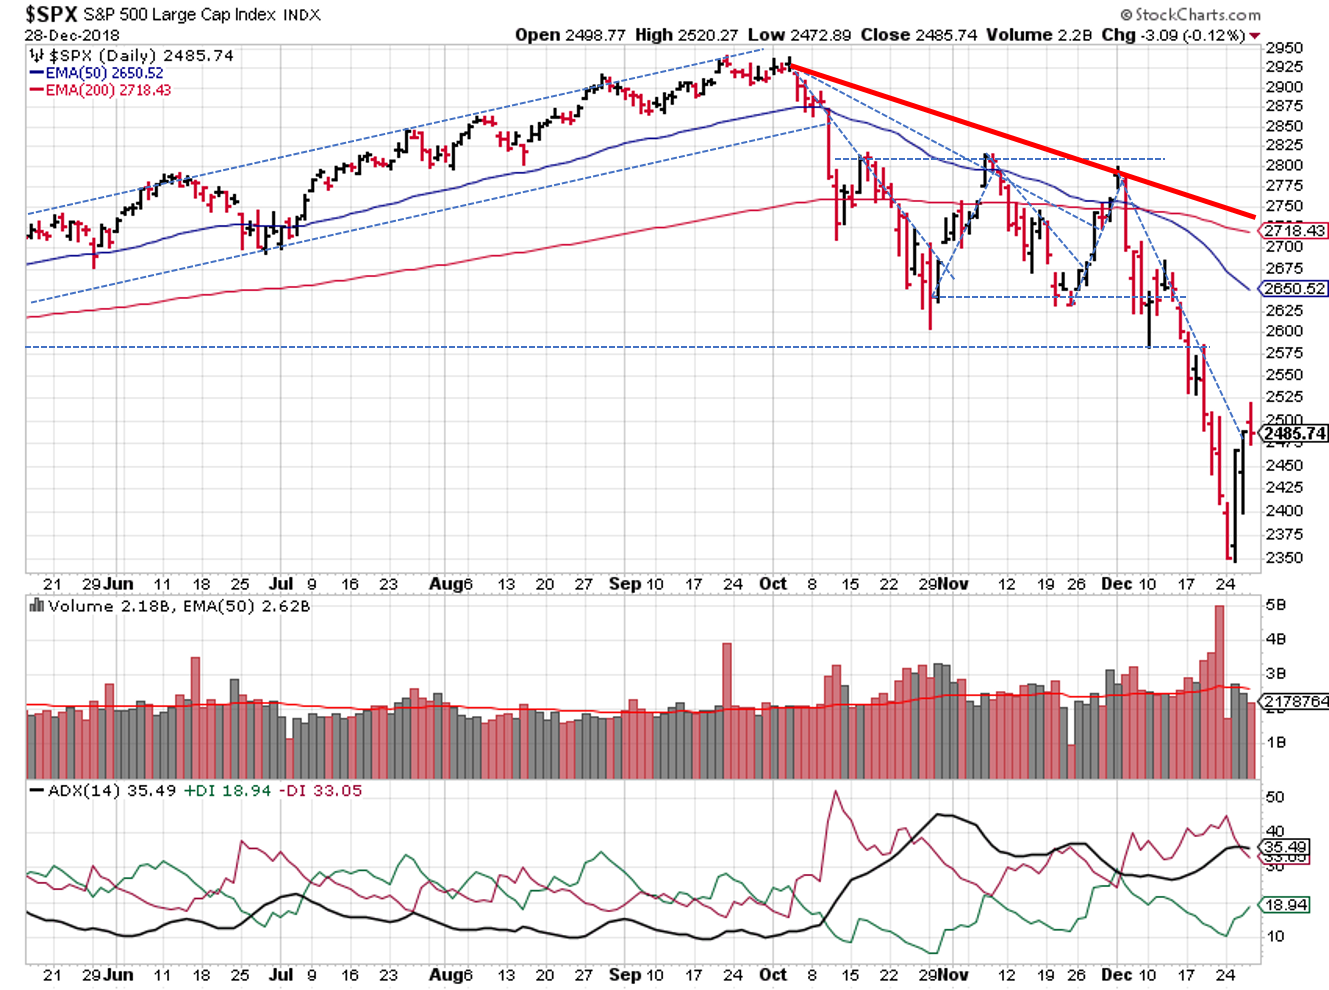
2018-12-23 – SPX Technical Analysis – Daily

There was support around 2480, which would have been a 16% correction. Next up is 2395 (similar to the OEW viewpoint), then we go down to 2276, and then on to 2184. Those levels represent 19%, 23%, and 26% declines from the all time of 2940, respectively.

2018-12-23 - SPX Technical Analysis - Weekly

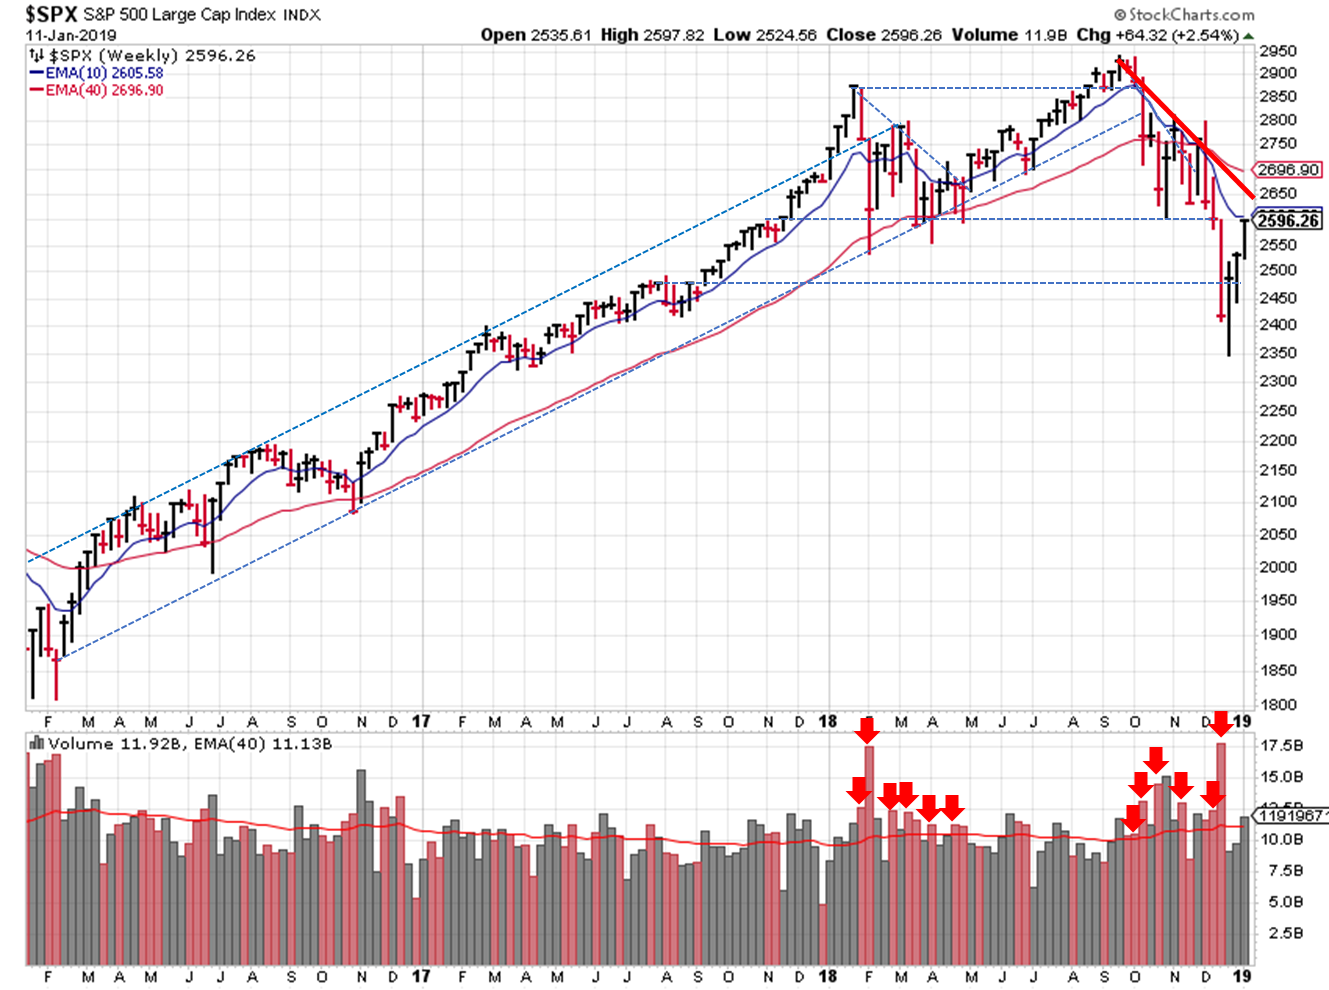
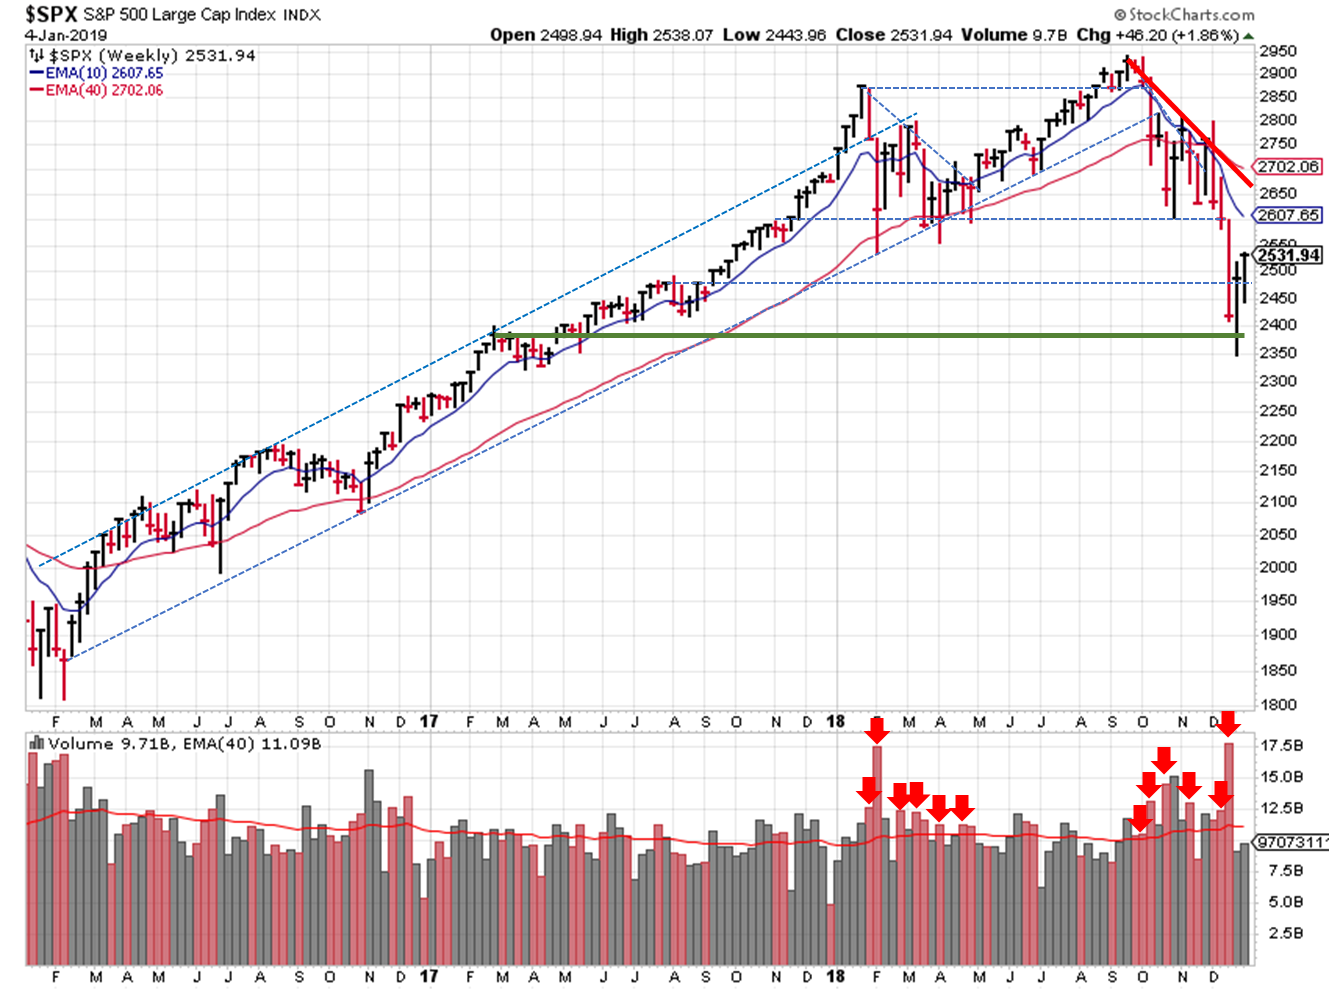
2018-12-23 – SPX Technical Analysis – Weekly

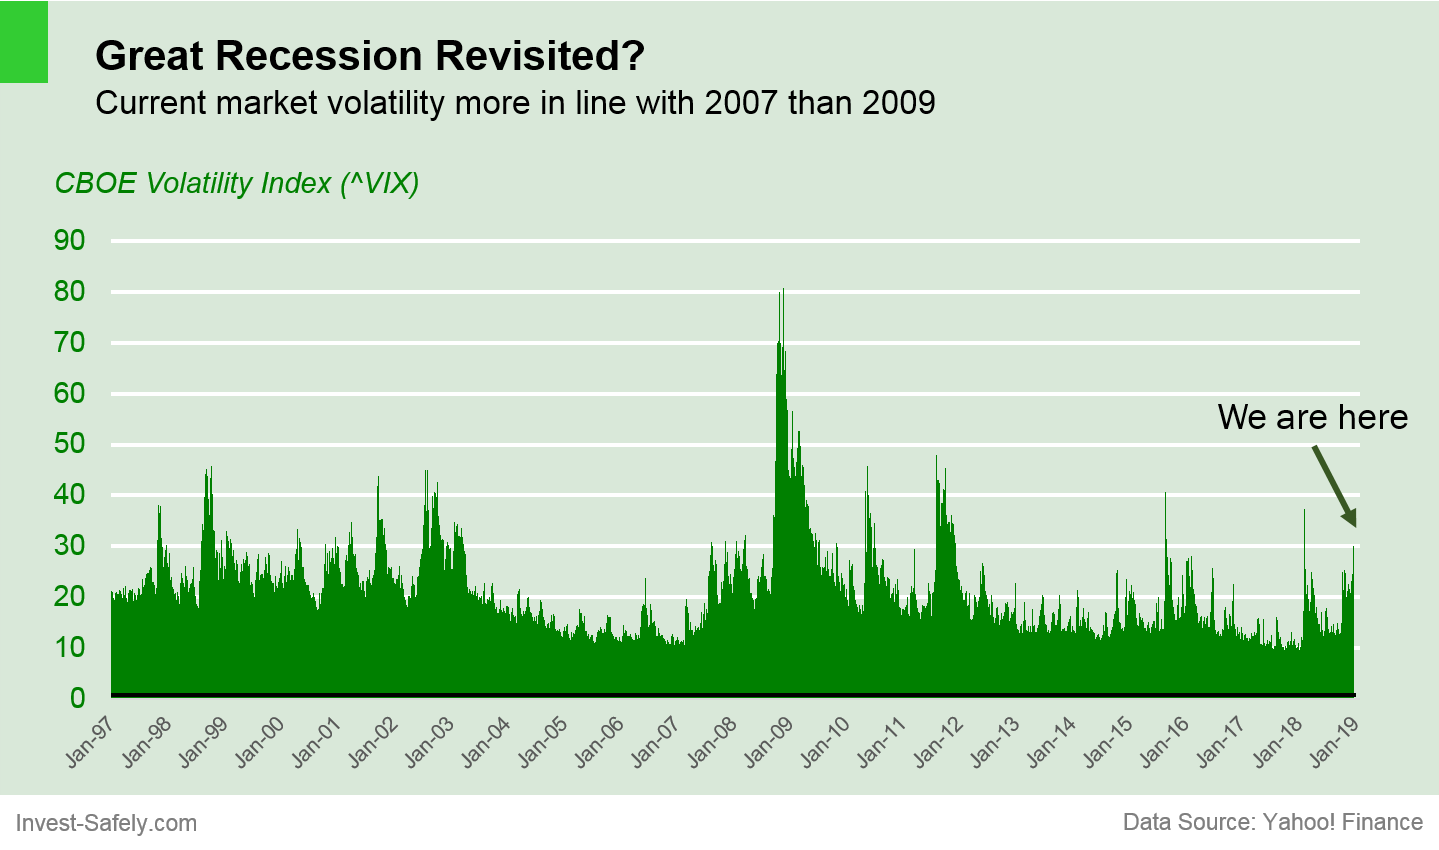
Right now, the SPX is ~18% from the September high, which is the largest correction since 2011 (~20%).  Not quite bear market territory, but close…no wonder the twitterverse is losing its collective mind.

To be fair, we haven’t seen many corrections since 2009.  And when we did see a drop, it was typically V-shaped with prices rebounding quickly.  So it’s rational to think these moves to the downside are abnormal. They’re not.

$SPX vs 200-day moving average

SPX vs 200-day moving average

Historically, stocks look really oversold right now. Could they go lower and be more oversold? Of course. Either way, last week’s action is a fantastic opportunity to review your buy and sell rules. When the markets are “always” in an uptrend, it’s easy to lose discipline and not get burned. Even when the markets move sideways, investors don’t want to “trade”, so they ignore signals and wait for a rebound.

We’re not in a recession just yet, so a v-shaped recovery wouldn’t surprise me. Maybe the executive and legislative branches will act like adults, reach an agreement, end the government shutdown, and the Santa Claus rally will come to town.  Now that would be a Christmas miracle.

We have a short, low volume trading week ahead, with partial session Monday (Christmas Eve) and no trading on Tuesday (Christmas Day). A great time to log out of StockTwits, turn off CNBC, and relax!

Warmest wishes and a joy filled holiday week to you and your family.

Merry Christmas!


If you find this research helpful, please tell a friend. If you don’t find it helpful, tell an enemy. I share articles and other news of interest via Twitter; you can follow me @investsafely. The weekly market outlook is also posted on Facebook and Linkedin.

You can check out how well (or poorly) the outlook has performed as a stand-alone, signal generator using past performance estimates:

For the detailed Elliott Wave Analysis, go to the ELLIOTT WAVE lives on by Tony Caldaro.  Charts provided courtesy of stockcharts.com.


Posted in Historical Data, Market Trends, Other Blogs | Tagged , , , , | Comments Off on Weekend Stock Market Outlook

Weekend Stock Market Outlook

Stock Market Outlook entering the Week of December 16th = Downtrend

  • 20/50 Day Moving Averages: Downtrend
  • Price & Volume Action: Downtrend
  • Objective Elliott Wave Analysis: Downtrend

COMMENTARY
So far, Santa hasn’t come to our rescue with his rally yet. Investors are probably rethinking those GI Joe’s with the kung-fu grips (if you don’t know that line, the movie Trading Spaces would make an excellent last minute gift).

All the indexes are still below their 20, 50, and 200 day moving averages to start this week.

Price charts for $SPX,$COMPQ,$INDU,$NYA,$RUT,$VIX,$TNX,$USD,$CRB,$GOLD

2018-12-16 – US Stock Market Averages

The price/volume combo remains in a downtrend as well.  Trading volumes were just about average across the week, but institutions still appear to be in sell mode.

OEW continues with the probable downtrend call, while looking for the SPX to find support at 2577 or even 2550.

The S&P ($SPX) closed at 2599.95 last week, falling below the 2630 support level we’ve been watching. Friday was also the first time the SPX closed below 2630 since April! A bounce-back on Monday would salvage the sideways trading range, but for now it looks done and dusted.

2018-12-16 - SPX Technical Analysis - Daily

2018-12-16 – SPX Technical Analysis – Daily

The 2580 support level, which was established way back between February and April, is now in play…which coincides with the OEW target mentioned earlier.

2018-12-16 - SPX Technical Analysis - Weekly

2018-12-16 – SPX Technical Analysis – Weekly

Not much we can do right now on the long side for growth strategies.  Fingers crossed and stops tight if you do decide to brave the waters.  For income strategies, some utilities have been doing really well recently, but that’s about it.  The good news is that P/E ratios are beginning to come down.  When the market turns around, there will be some solid names for sale.

Participate. Protect. Prepare.


If you find this research helpful, please tell a friend. If you don’t find it helpful, tell an enemy. I share articles and other news of interest via Twitter; you can follow me @investsafely. The weekly market outlook is also posted on Facebook and Linkedin.

You can check out how well (or poorly) the outlook has performed as a stand-alone, signal generator using past performance estimates:

For the detailed Elliott Wave Analysis, go to the ELLIOTT WAVE lives on by Tony Caldaro.  Charts provided courtesy of stockcharts.com.


Posted in Historical Data, Market Trends, Other Blogs | Tagged , , , , | Comments Off on Weekend Stock Market Outlook

Weekend Stock Market Outlook

Stock Market Outlook entering the Week of December 9th = Downtrend

  • 20/50 Day Moving Averages: Downtrend
  • Price & Volume Action: Downtrend
  • Objective Elliott Wave Analysis: Downtrend

COMMENTARY
Yikes. Just when things started looking brighter, U.S. equities sold off…hard. One week after the switch to an uptrend, the outlook sours and reverts to a downtrend, with confirmation from all 3 signals.  Typical price action for bear markets actually, but that means admitting and accepting we’re in one.  One thing everyone can agree on…it’s a traders market.

All the indexes start this week below their 20 day moving averages, sending this signal back to a downtrend.  They’re all below their 200-day moving averages as well.

Price charts for $SPX,$COMPQ,$INDU,$NYA,$RUT,$VIX,$TNX,$USD,$CRB,$GOLD

2018-12-09 – US Stock Market Averages

In almost a complete 180 from last week, the price/volume signal switches back to a downtrend signal.  Last week’s losses came on higher trading volume…not the kind of price action that supports an uptrend.  Strong fundamental performance didn’t provide shelter from the storm either.  Lululemon reported Q3 results Thursday, beating top and bottom line estimates and maintaining their future outlook. The result? Opened Friday at $132, closed at $113 and change…down 14% for the week.

OEW switched back to a downtrend.  Even Tony commented on the difficulty identifying trends given the current market conditions and gyrations.

The S&P ($SPX) wiped out two trendlines last week; the short term uptrend, and the intermediate downtrend.  If you squint and give yourself some wiggle room, it almost looks like the SPX is range-bound between 2810 and 2630.  Prices ended the week at 2633.

2018-12-09 - SPX Technical Analysis - Daily

2018-12-09 – SPX Technical Analysis – Daily

Longer term, 2600 (give or take a couple percentage points) has served as the floor of support most of 2018.  If it doesn’t hold, look for a new downward price channel to develop.  Since the stock markets were closed on Wednesday, we didn’t add another week of high volume selling.

2018-12-09 - SPX Technical Analysis - Weekly

2018-12-09 – SPX Technical Analysis – Weekly

You may have heard about the yield curve inversion last week. Normally, more uncertainty exists over longer time periods, which brings higher risk, which requires higher yield to compensate. An inversion means an expectation of higher risk in the short term.

Yield Curve Examples - 2018-12-09

Yield Curve Examples – Courtesy of Stockcharts.com

In this case, the short end of the yield curve (3 and 5 year yields) inverted slightly, meaning the yield on the 3 year was higher than the 5 year.  Before you head for the hills, true inversion, the kind that preceded every recession in the past 60 years or so, occurs when the short end (1 year) is higher than the long end (10+ year).  Even then, a recession starts anytime from 6 to 24 months after an inversion event.  And here’s a silver lining.  Per The Fat Pitch:

SPX normally gains over the next 3 and 9 months after the first 5-3 inversion of the cycle (from Troy Bombardia; note that 1973 was the year of the oil embargo).

So you’ve got some time to get things in order.

Participate. Protect. Prepare.


If you find this research helpful, please tell a friend. If you don’t find it helpful, tell an enemy. I share articles and other news of interest via Twitter; you can follow me @investsafely. The weekly market outlook is also posted on Facebook and Linkedin.

You can check out how well (or poorly) the outlook has performed as a stand-alone, signal generator using past performance estimates:

For the detailed Elliott Wave Analysis, go to the ELLIOTT WAVE lives on by Tony Caldaro.  Charts provided courtesy of stockcharts.com.


Posted in Historical Data, Market Trends, Other Blogs | Tagged , , , , | Comments Off on Weekend Stock Market Outlook

Weekend Stock Market Outlook

Stock Market Outlook entering the Week of December 2nd = Uptrend

  • 20/50 Day Moving Averages: Mixed
  • Price & Volume Action: Uptrend
  • Objective Elliott Wave Analysis: Uptrend

COMMENTARY
A change in language from Fed chair Powell put big investors back in buy mode, and the market rallied from there. At the G-20 summit this weekend, the U.S. and China agreed to start negotiations and ease trade tensions, with the U.S. postponing plans to increase tariffs on Chinese goods. A solid week of trading, the perception of a more accommodating Fed, and a temporary reprieve from tariffs puts the markets back in an uptrend, just in time for the annual Santa Claus rally.

All the indexes start this week above their 20 day moving averages. And their all fairly close to, if not right above, their 50 day moving averages. So this signal moves from downtrend to mixed.

Price charts for $SPX,$COMPQ,$INDU,$NYA,$RUT,$VIX,$TNX,$USD,$CRB,$GOLD

2018-12-02 – US Stock Market Averages

The price/volume signal switches back to an uptrend signal, with last week’s gains coming on higher trading volume. Growth stocks have had 6-8 weeks to build new bases, so this is about the time you’d want to see new breakouts from names that held up well during the sell-off. Time to check those buy lists!

OEW switched to an uptrend. It appears they ~2 weeks early in the call for an uptrend…a common issue when trying to call a trend change.

The S&P ($SPX) found its footing, looks set to give us that Santa Claus rally to close out the year. Prices broke through the second leg down (after failing to do so on the 19th. The index also closed just above the October/November downtrend, another positive sign in line with the uptrend generated by the signals above. The ADX isn’t quite there yet, but is trending in the right direction (DI- coming down, DI+ rising, and the weakening bearish trend).

2018-12-02 - SPX Technical Analysis - Daily

2018-12-02 – SPX Technical Analysis – Daily

Looking back of the past few weeks, you can see the back and forth between uptrends and downtrends in each of the signals. This is one reason to use more than one signal in your trading process. It’s not perfect, but the odds of success are higher…or the odds of being wrong and losing money are lower, if you have your safe investing hat on.

Participate. Protect. Prepare.


If you find this research helpful, please tell a friend. If you don’t find it helpful, tell an enemy. I share articles and other news of interest via Twitter; you can follow me @investsafely. The weekly market outlook is also posted on Facebook and Linkedin.

You can check out how well (or poorly) the outlook has performed as a stand-alone, signal generator using past performance estimates:

For the detailed Elliott Wave Analysis, go to the ELLIOTT WAVE lives on by Tony Caldaro.  Charts provided courtesy of stockcharts.com.


Posted in Historical Data, Market Trends, Other Blogs | Tagged , , , , | Comments Off on Weekend Stock Market Outlook

Weekend Stock Market Outlook

Stock Market Outlook entering the Week of November 25th = Downtrend

  • 20/50 Day Moving Averages: Downtrend
  • Price & Volume Action: Downtrend
  • Objective Elliott Wave Analysis: Downtrend

COMMENTARY
Investors didn’t display much holiday cheer during the short trading week in the US. So much for my thought that we’d head back to the 50-day moving average last week…just another example of why it’s so important to stick with clearly defined buy and sell rules.

All the indexes start the week back below their 20 and 50 day moving averages.

Price charts for $SPX,$COMPQ,$INDU,$NYA,$RUT,$VIX,$TNX,$USD,$CRB,$GOLD

2018-11-25 – US Stock Market Averages

The price/volume signal switches to a downtrend signal after taking out the October lows. As mentioned last week, it wasn’t a strong uptrend to begin with, so a change isn’t so surprising.

OEW is back to a downtrend, as the uptrend within the overall downtrend appears to have completed already (versus last week’s statement that a rally to +2800 was in the cards).

The S&P ($SPX) gapped down last week, breaking through a fledgling trendline and eventually closing out the week below the October low.  The closing price wasn’t too far way from that mark, so support around 2640 is still a possibility.

2018-11-25 - SPX Technical Analysis - Daily

2018-11-25 – SPX Technical Analysis – Daily

In the weekly view, the S&P confirmed the downtrend last week.

2018-11-25 - SPX Technical Analysis - Weekly

2018-11-25 – SPX Technical Analysis – Weekly

Hopefully you stayed conservative last week and enjoyed some Thanksgiving feasting.

Participate. Protect. Prepare.


If you find this research helpful, please tell a friend. If you don’t find it helpful, tell an enemy. I share articles and other news of interest via Twitter; you can follow me @investsafely. The weekly market outlook is also posted on Facebook and Linkedin.

You can check out how well (or poorly) the outlook has performed as a stand-alone, signal generator using past performance estimates:

For the detailed Elliott Wave Analysis, go to the ELLIOTT WAVE lives on by Tony Caldaro.  Charts provided courtesy of stockcharts.com.


Posted in Historical Data, Market Trends, Other Blogs | Tagged , , , , | Comments Off on Weekend Stock Market Outlook

Weekend Stock Market Outlook

Stock Market Outlook entering the Week of November 18th =  Downtrend

  • 20/50 Day Moving Averages: Downtrend
  • Price & Volume Action: Mixed
  • Objective Elliott Wave Analysis:Mixed

COMMENTARY
A difficult week to judge.  In the end, preserving capital is key and caution is the name of the game right now.

This week starts with major indexes back below their 50-day moving averages.  Most fell below their 20-day moving averages last week as well, but were able to recover by the close on Friday… the lone exception being the NASDAQ.

Price charts for $SPX,$COMPQ,$INDU,$NYA,$RUT,$VIX,$TNX,$USD,$CRB,$GOLD

2018-11-18 – US Stock Market Averages

The price/volume signal switches to a mixed signal because we picked up a couple distribution days and we weren’t able to hold a key moving averages (200 day).  Neither of which is what you want to see early in an uptrend.  Also, the best performing stocks aren’t exactly “growth stocks” (car parts, retail, drug stores).

OEW indicates an uptrend within the overall downtrend.  So far, OEWs expectation for a sell off to ~2,700 was the right call, as prices found support at that level on Wednesday and Thursday.  If the analysis holds, a rally to +2800 will follow over the next few weeks, before we fall again towards 2,400.

The S&P ($SPX) couldn’t hold its 200 day moving average, and retreated last week.  In the process, it “filled” both gap ups in the recent uptrend.  There was price support around ~2,700, as OEW expected.

2018-11-18 - SPX Technical Analysis - Daily

2018-11-18 – SPX Technical Analysis – Daily

Looking at the long-term picture, the S&P should confirm the uptrend or downtrend this week…unless it moves completely sideways and closes at the same price as last week.

2018-11-18 - SPX Technical Analysis - Weekly

2018-11-18 – SPX Technical Analysis – Weekly

To summarize, the moving averages didn’t provide much support last week, so the downtrend signal remains in place.  The price/volume indicator shifted to from uptrend to mixed.  OEW is still mixed, but shows a short-term uptrend within the overall downtrend.  You could argue that the price/volume indicator has an uptrend bias since it hasn’t shown an outright downtrend yet. And OEW could be interpreted as an uptrend for the near term.  This interpretation would show 2 of the 3 signals in uptrend mode, and initiate a trend change.

So what to do?   My expectation is that we rally higher from here.  We may even get back above the 50-day moving average, which would shift the overall signal back to an uptrend…albeit missing out on a ~2% price increase.  The characteristics of the market are different (volatility, etc.), so you need to make sure your signals are appropriate.  Keep your losses small, and don’t be in a hurry to initiate large positions.

Participate. Protect. Prepare.


If you find this research helpful, please tell a friend. If you don’t find it helpful, tell an enemy. I share articles and other news of interest via Twitter; you can follow me @investsafely. The weekly market outlook is also posted on Facebook and Linkedin.

You can check out how well (or poorly) the outlook has performed as a stand-alone, signal generator using past performance estimates:

For the detailed Elliott Wave Analysis, go to the ELLIOTT WAVE lives on by Tony Caldaro.  Charts provided courtesy of stockcharts.com.


Posted in Historical Data, Market Trends, Other Blogs | Tagged , , , , | Comments Off on Weekend Stock Market Outlook